|
 |
|
| For any question on data and metadata, please contact: Eurostat user support |
|
|||
| 1.1. Contact organisation | National Statistical Institute of Spain |
||
| 1.2. Contact organisation unit | Labour Market Statistics Directorate |
||
| 1.5. Contact mail address | Paseo de la Castellana 183 |
||
|
|||
| 2.1. Data description | |||
In Spain, four Structural Earnings Surveys were undertaken, all in collaboration with the Statistical Office of the European Communities (Eurostat). The first was the Structural Earnings Survey for the period referring to 1995, which covered units with ten or more employees in the activities of industry, building, commerce, hotels and restaurants, transport, communications, finance institutions and insurance. The second, referred to 2002, broadened the coverage to include the activities outlined in sections M, N and O of NACE Rev.1. The third, with 2006 as a reference year, included the small units (those with less than 10 employees) in the same activities than in 2002. The fourth and last, referred to 2010, has as a main characteristic to include economic activities regarding public administration.
The Community Regulations used as the bases for producing the last survey were as follows:
The aim of this document is to be used to evaluate the quality of the survey. The structure of this report follows the content of Commission Regulation (EC) No. 698/2006 of 5 May 2006 Implementing Council Regulation (EC) No. 530/99 as regards quality evaluation of structural statistics on labour costs and earnings. |
|||
| 2.2. Classification system | |||
Not available. |
|||
| 2.3. Coverage - sector | |||
Not available. |
|||
| 2.4. Statistical concepts and definitions | |||
Not available. |
|||
| 2.5. Statistical unit | |||
Not available. |
|||
| 2.6. Statistical population | |||
Not available. |
|||
| 2.7. Reference area | |||
Not available. |
|||
| 2.8. Coverage - Time | |||
Not available. |
|||
| 2.9. Base period | |||
Not available. |
|||
|
|||
| 3.1. Source data | |||
[Not requested] |
|||
| 3.2. Frequency of data collection | |||
[Not requested] |
|||
| 3.3. Data collection | |||
[Not requested] |
|||
| 3.4. Data validation | |||
[Not requested] |
|||
| 3.5. Data compilation | |||
[Not requested] |
|||
| 3.6. Adjustment | |||
[Not requested] |
|||
|
|||
| 4.1. Quality assurance | |||
Not available. |
|||
| 4.2. Quality management - assessment | |||
[Not requested] |
|||
|
|||
| 5.1. Relevance - User Needs | |||
The main users could be classified in the following groups:
|
|||
| 5.2. Relevance - User Satisfaction | |||
The INE has conducted general surveys of user satisfaction in 2007 and 2010, and plans to continue doing them. Its purpose is to know the perception of users of INE statistics regarding the quality of the information they use, and to what extent their needs are covered. Furthermore, there are other special surveys for certain aspects: dissemination of information, quality of certain publications, etc.. No specific user satisfaction survey related to the SES has been carried out among users to know their needs of information and whether they are satisfied or not with the published results. This may be accounted for by the lack of contact with most users since the remittance of results is often impersonal, and by the fact that the information is looked for in INTERNET. It is known only the opinion of users who have received information on request or who have asked for methodological details. In general, these users are satisfied. Nevertheless they consider that the survey should offer more detailed breakdown of some variables (in particular of regions, branch of activity and wage components) and also include more variables related to the employee (family situation, etc). |
|||
| 5.3. Completeness | |||
[Not requested] |
|||
| 5.3.1. Data completeness - rate | |||
[Not requested] |
|||
|
||||||||||||||||||||||||||||||||||||||||||||||||||||||||||||||||||||||||||||||||||||||||||||||||||||||||||||||||||||||||||||||||||||||||||||||||||||||||||
| 6.1. Accuracy - overall | ||||||||||||||||||||||||||||||||||||||||||||||||||||||||||||||||||||||||||||||||||||||||||||||||||||||||||||||||||||||||||||||||||||||||||||||||||||||||||
[Not requested] |
||||||||||||||||||||||||||||||||||||||||||||||||||||||||||||||||||||||||||||||||||||||||||||||||||||||||||||||||||||||||||||||||||||||||||||||||||||||||||
| 6.2. Sampling error | ||||||||||||||||||||||||||||||||||||||||||||||||||||||||||||||||||||||||||||||||||||||||||||||||||||||||||||||||||||||||||||||||||||||||||||||||||||||||||
The calculation of the coefficients of variation of key variables is performed in each survey implementation and disseminated in the publication of their results and the successive quality reports. |
||||||||||||||||||||||||||||||||||||||||||||||||||||||||||||||||||||||||||||||||||||||||||||||||||||||||||||||||||||||||||||||||||||||||||||||||||||||||||
| 6.2.1. Sampling error - indicators | ||||||||||||||||||||||||||||||||||||||||||||||||||||||||||||||||||||||||||||||||||||||||||||||||||||||||||||||||||||||||||||||||||||||||||||||||||||||||||
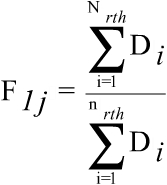
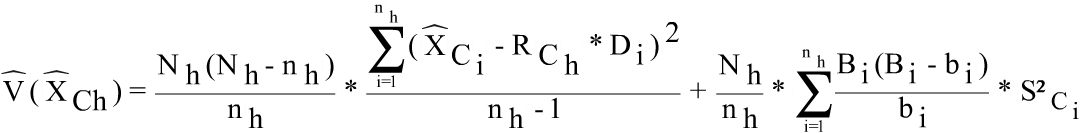
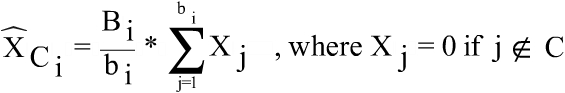
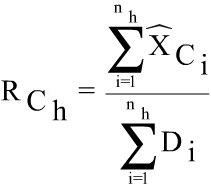
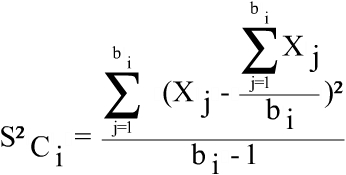
The estimators used for the survey are separate ratio estimators, the number of employees in the register being used as an auxiliary variable. The estimators for economic data of the employee j in the unit i classified in the activity r, size h and region t are formed. The grossing up factors of first and second stage are respectively:
where, Di is the number of employees in the register for the unit i, Bi is the number of employees registered during the whole month of October 2010 in the Social Security and bi is the number of employees in the sample.
Thus:
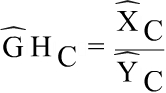
are the hourly earnings and the earnings per employee in any cell C of the table (by activity, occupation, sex and regions) Being:
j makes reference to the employees included in the cell C.
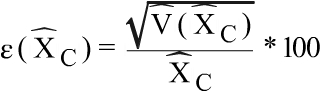
The coefficient of variation is defined:
where
(h is referred to the cross of variables region, activity and size) and
being
Please see the attached document Coefficients of variation.
The general rule to publish a cell in a multidimensional table used in the national publication is that, at least, 100 observations support the estimation. All figures estimated with less than 100 observations have been erased; cells estimated with a number of observations between 100 to 500 have been marked to indicate this situation. Annexes: Coefficients of variation |
||||||||||||||||||||||||||||||||||||||||||||||||||||||||||||||||||||||||||||||||||||||||||||||||||||||||||||||||||||||||||||||||||||||||||||||||||||||||||
| 6.3. Non-sampling error | ||||||||||||||||||||||||||||||||||||||||||||||||||||||||||||||||||||||||||||||||||||||||||||||||||||||||||||||||||||||||||||||||||||||||||||||||||||||||||
A control of non-sampling errors is performed in every statistical process. It also has specific information on the non-response rate. |
||||||||||||||||||||||||||||||||||||||||||||||||||||||||||||||||||||||||||||||||||||||||||||||||||||||||||||||||||||||||||||||||||||||||||||||||||||||||||
| 6.3.1. Coverage error | ||||||||||||||||||||||||||||||||||||||||||||||||||||||||||||||||||||||||||||||||||||||||||||||||||||||||||||||||||||||||||||||||||||||||||||||||||||||||||
The framework of the survey is obtained from the Social Security General Register of Contributions Accounts. Employers that hire employees for the first time should request their own registration as a company, at the Social Security General Treasury. They should do this before commencing work activities. Registration is an administrative act by which the Social Security General Treasury gives an identification and control number to the employer. This establishes what is known as the Account of Social Security Contribution. The list of Accounts is used as a business register in all the Labour Cost and Structure of Earnings Surveys performed. The procedure for random selection of units corresponds to a stratified sampling with optimal allocation, in which the sampling units are the accounts. The stratification criterion is accomplished using three variables: Autonomous Community, economic activity (NACE rev.2 from B to S) and unit size (in terms of number of employees). When the Register is received from the Social Security, a first debugging is made prior to the selection of the sample, which implies several stages:
Afterwards, the sample is drawn and the list of numbers of accounts of social security contributions selected is sent to the Social Security General Treasury again. It provides the list of all the employees, identified by their affiliation numbers, included in these units during the reference year. Specifically, the employees to be targeted for the SES are those employed in the observation unit during the whole reference month. A simple random sample of employees is taken within each of the selected local units according to the size of the unit. In SES-2010 the number of employees selected was:
The advantage of this method is that the respondent does not choose the employees, because the employees to be included in the questionnaire are identified by their affiliation number. The main difference between the reference population and the study population is that the first does not include the apprentices. The labour legislation on apprentices in Spain establishes very low labour costs (both wages and social contributions). As a consequence, the number of apprentices is very small. Thus, at the end of October of 2010 the number of apprentices was 57.581 from a total of 13.138.699 employees in the activities included in the survey (it represents 0,4% of the total). Moreover, the problem with apprentices is that, due to their particular type of contract, the Social Security General Treasury registers them, for control, in a different affiliation file, with different characteristics, that make difficult to use it jointly with the general file. On the other hand, because of it is such a small group, a random selection does not assure to obtain representative separate figures for this collective. This fact makes necessary a great effort carrying out a specific survey for the apprentices to assure the results. This effort is not corresponded with the small figures obtained as was showed in the experience from the 2002 SES and 2004 LCS. On the other hand, a significant proportion (one third approximately) of apprentices estimated by the 2004 LCS survey were, in practice, scholarship employees, circumstance not known before selecting the sample, and their inclusion in the final figures distorts the apprentices’ figures. Consequently the apprentices are not included since the SES 2006. Section O of NACE Rev.2. are partly covered. There are two kinds of employees working in public administration: The first group comes under the Social Security General Scheme and is subject to the general rules of employment law, just like all other employees in other NACE Rev 2 sections included in the SES 2010. The other group comes under the Special Scheme for civil and military public servants. Career civil servants in Central Government, armed forces personnel and justice and Parliament officials come under the State Employee Pension Scheme, whereby the State assures them protection against the risks of old age, disability, death and survival. For healthcare, temporary disability benefits, etc., such employees are covered by public-employee mutual societies. This group is not covered by the Social Security General Scheme, and therefore are excluded from the survey. Once the questionnaires are sent to the selected units, the data collection and debugging reveal the errors in the surveyed units. The sample was composed by 27.482 selected units. 26.912 units were surveyed: 25.104 units answered and 1.808 not. Data collection showed that 466 units were not located, 79 units were inactive or closed down in 2010 and 25 units were erroneously classified. |
||||||||||||||||||||||||||||||||||||||||||||||||||||||||||||||||||||||||||||||||||||||||||||||||||||||||||||||||||||||||||||||||||||||||||||||||||||||||||
| 6.3.1.1. Over-coverage - rate | ||||||||||||||||||||||||||||||||||||||||||||||||||||||||||||||||||||||||||||||||||||||||||||||||||||||||||||||||||||||||||||||||||||||||||||||||||||||||||
0,09% |
||||||||||||||||||||||||||||||||||||||||||||||||||||||||||||||||||||||||||||||||||||||||||||||||||||||||||||||||||||||||||||||||||||||||||||||||||||||||||
| 6.3.1.2. Common units - proportion | ||||||||||||||||||||||||||||||||||||||||||||||||||||||||||||||||||||||||||||||||||||||||||||||||||||||||||||||||||||||||||||||||||||||||||||||||||||||||||
[Not requested] |
||||||||||||||||||||||||||||||||||||||||||||||||||||||||||||||||||||||||||||||||||||||||||||||||||||||||||||||||||||||||||||||||||||||||||||||||||||||||||
| 6.3.2. Measurement error | ||||||||||||||||||||||||||||||||||||||||||||||||||||||||||||||||||||||||||||||||||||||||||||||||||||||||||||||||||||||||||||||||||||||||||||||||||||||||||
Before sending the questionnaires to the units, the telephone numbers and addresses for the units were checked and updated. The filled questionnaires were given back to the statistical office by mail, in the enclosed postage paid envelope, or electronically, to which purpose a registration and transmission format on Internet was designed. It was also possible to fill in the questionnaire by Internet using an identification number provided in the questionnaire.
Debugging errors After receiving the questionnaires, the statistical office recorded them, using an ad hoc computer application, which at the same time made a first debugging for the questionnaire’s internal consistency. This first debugging consists in using filters that allow to separate valid questionnaires from those with inconsistencies to be revised. The filters are of two kinds: those detecting type I and type II errors.
Type I errors: If they are not thoroughly corrected, the questionnaire cannot be considered as valid.
Type II errors: They involve norms regarding the coherence of the data. The non-satisfaction of these norms does not necessarily mean that the questionnaire is not valid, but the apparent incoherence must be explained. In case of doubt, a telephone call is made to the respondent to elucidate the question. The questionnaires are filtered a first time during the recording and a second time by the team responsible for the results of the survey (this team is different from the recording one).
There are more than four hundred rules checked in each employee data. They assure:
|
||||||||||||||||||||||||||||||||||||||||||||||||||||||||||||||||||||||||||||||||||||||||||||||||||||||||||||||||||||||||||||||||||||||||||||||||||||||||||
| 6.3.3. Non response error | ||||||||||||||||||||||||||||||||||||||||||||||||||||||||||||||||||||||||||||||||||||||||||||||||||||||||||||||||||||||||||||||||||||||||||||||||||||||||||
The following tables show the response rates by economic activity and Nuts.
Response rate by section of NACE Rev.2
Response rate by NUTS1
As it is said above, partial non-response is not allowed. When there was no response or an incidence in the sample, the value of the analysis variables for each ‘empty’ sampling unit or unit without information was imputed using the information obtained for the stratum to which the unit belonged. This form of imputation only requires replacing the raising factors obtained with the selected sample with the ones that result from the effective sample. There is only one exception in the item non-response: the level of education of the employee. It has been the most difficult variable to obtain, mainly in large units or groups of units, with a great number of employees selected in occupations where the level of education is not an important requirement in the job (eg.: Major Group 9 of ISCO-08). Most of this kind of units needed a lot of time to answer the questionnaire, because they had to ask to the employees their level of education. At the end, this item was empty for 3.321 employees (1,5% of the sample). The level of education of these employees was imputed using the software application IVEware (Imputation and Variance estimation Software). This software performs imputations of missing values using the Sequential Regression Imputation Method [1]. This method has two main advantages: it takes into account the structure of correlations of the whole set of variables in the sample and it is built on the SAS Macro Language, that is the software used for the rest of The effect in the final results of the imputation is negligible due to the small number of missing values imputed.
[1] This method is described in the article "A multivariate technique for multiply imputing missing values using a sequence of regression models" by Raghunthan, Lepkowski, Van Hoewyk and Solenberger (Survey Methodology, June 2001). |
||||||||||||||||||||||||||||||||||||||||||||||||||||||||||||||||||||||||||||||||||||||||||||||||||||||||||||||||||||||||||||||||||||||||||||||||||||||||||
| 6.3.3.1. Unit non-response - rate | ||||||||||||||||||||||||||||||||||||||||||||||||||||||||||||||||||||||||||||||||||||||||||||||||||||||||||||||||||||||||||||||||||||||||||||||||||||||||||
[Not requested] |
||||||||||||||||||||||||||||||||||||||||||||||||||||||||||||||||||||||||||||||||||||||||||||||||||||||||||||||||||||||||||||||||||||||||||||||||||||||||||
| 6.3.3.2. Item non-response - rate | ||||||||||||||||||||||||||||||||||||||||||||||||||||||||||||||||||||||||||||||||||||||||||||||||||||||||||||||||||||||||||||||||||||||||||||||||||||||||||
[Not requested] |
||||||||||||||||||||||||||||||||||||||||||||||||||||||||||||||||||||||||||||||||||||||||||||||||||||||||||||||||||||||||||||||||||||||||||||||||||||||||||
| 6.3.4. Processing error | ||||||||||||||||||||||||||||||||||||||||||||||||||||||||||||||||||||||||||||||||||||||||||||||||||||||||||||||||||||||||||||||||||||||||||||||||||||||||||
The variables ‘level of education’ and ‘occupation’ were codified at the time of recording the questionnaires. Rules to assure that the code assigned exists in the classification were established. Moreover, the sample was divided in portions. Random subsamples were selected from each portion and the codification in it was revised. If the errors in the codification were higher than the 3% of the total number of employees in the subsample, the whole portion was recodified. This process was repeated until this percentage of errors was achieved. The processing, grossing up and tabulation of the data have been programmed and supervised by two different teams. After the tabulation, the results obtained were analysed in order to know whether they were coherent with the available short-term statistics on labour and wage costs. |
||||||||||||||||||||||||||||||||||||||||||||||||||||||||||||||||||||||||||||||||||||||||||||||||||||||||||||||||||||||||||||||||||||||||||||||||||||||||||
| 6.3.4.1. Imputation - rate | ||||||||||||||||||||||||||||||||||||||||||||||||||||||||||||||||||||||||||||||||||||||||||||||||||||||||||||||||||||||||||||||||||||||||||||||||||||||||||
The imputation rate for level of education in 1.5% |
||||||||||||||||||||||||||||||||||||||||||||||||||||||||||||||||||||||||||||||||||||||||||||||||||||||||||||||||||||||||||||||||||||||||||||||||||||||||||
| 6.3.5. Model assumption error | ||||||||||||||||||||||||||||||||||||||||||||||||||||||||||||||||||||||||||||||||||||||||||||||||||||||||||||||||||||||||||||||||||||||||||||||||||||||||||
to ensure that a representative month is selected: The monthly questions have as reference October 2010 in the questionnaire. It is not possible to answer for other month. Practices in the companies in Spain suggest using October because it is a month without seasonal payments and absences (like Christmas pay or summer holidays). On the other hand, October was the month used in the previous SES, so it is the most suitable month to keep comparability over time.
to adjust the accounting or fiscal year to the calendar year The accounting or fiscal year coincides with the calendar year in Spain.
to ensure that NACE Rev.2 sections are fully covered The register used to select the sample has the economic activity as a variable of classification. The design of the sample takes into account this variable in the stratification process jointly with the unit size and the region. |
||||||||||||||||||||||||||||||||||||||||||||||||||||||||||||||||||||||||||||||||||||||||||||||||||||||||||||||||||||||||||||||||||||||||||||||||||||||||||
| 6.4. Seasonal adjustment | ||||||||||||||||||||||||||||||||||||||||||||||||||||||||||||||||||||||||||||||||||||||||||||||||||||||||||||||||||||||||||||||||||||||||||||||||||||||||||
[Not requested] |
||||||||||||||||||||||||||||||||||||||||||||||||||||||||||||||||||||||||||||||||||||||||||||||||||||||||||||||||||||||||||||||||||||||||||||||||||||||||||
| 6.5. Data revision - policy | ||||||||||||||||||||||||||||||||||||||||||||||||||||||||||||||||||||||||||||||||||||||||||||||||||||||||||||||||||||||||||||||||||||||||||||||||||||||||||
[Not requested] |
||||||||||||||||||||||||||||||||||||||||||||||||||||||||||||||||||||||||||||||||||||||||||||||||||||||||||||||||||||||||||||||||||||||||||||||||||||||||||
| 6.6. Data revision - practice | ||||||||||||||||||||||||||||||||||||||||||||||||||||||||||||||||||||||||||||||||||||||||||||||||||||||||||||||||||||||||||||||||||||||||||||||||||||||||||
[Not requested] |
||||||||||||||||||||||||||||||||||||||||||||||||||||||||||||||||||||||||||||||||||||||||||||||||||||||||||||||||||||||||||||||||||||||||||||||||||||||||||
| 6.6.1. Data revision - average size | ||||||||||||||||||||||||||||||||||||||||||||||||||||||||||||||||||||||||||||||||||||||||||||||||||||||||||||||||||||||||||||||||||||||||||||||||||||||||||
[Not requested] |
||||||||||||||||||||||||||||||||||||||||||||||||||||||||||||||||||||||||||||||||||||||||||||||||||||||||||||||||||||||||||||||||||||||||||||||||||||||||||
 and
and 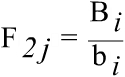
 and
and 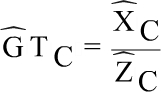
|
|||
| 7.1. Timeliness | |||
The Structural Earnings Surveys are published t+22 months after the reference year. |
|||
| 7.1.1. Time lag - first result | |||
[Not requested] |
|||
| 7.1.2. Time lag - final result | |||
[Not requested] |
|||
| 7.2. Punctuality | |||
Key data collection dates: The fieldwork took place between April - December 2011. The stages of the collection period are the following: Remittance of the material to the respondent units. This first stage took 3 days. In general terms, each mailing contains the following documents:
Location: The length of this stage depends on the number of respondent units to be located and lasted about one or two weeks. The work consisted in finding the telephone numbers and/or the addresses of those units for which no contact telephone number was available or whose envelopes with the documents were returned. The most frequent steps to locate a unit were the following:
Contacts and claims: This stage is essential for a fluent and efficient collection, to get a high percentage of success. At this point, the calls to enterprises were started and the questionnaires claimed. The most useful tool for this activity was the telephone. Telephone contacts may occur in both directions. To foster the respondents’ willingness to call the NSI, they are provided, whenever possible (in some of the documents forwarded to them), with a free telephone number. The calls are preferably answered by the interviewer in charge of obtaining their questionnaires. If this is not possible, any person tasked with the collection will resolve the respondent’s doubt or duly take the message (indicating the enterprise’s National Register Number, its address, name of the person who calls, contact telephone number, identification number in the survey and other comments). There is also a free fax number to receive questionnaires and written communications. This stage lasted approximately two or three weeks and each interviewer must contact the enterprises assigned to him and request their questionnaire.
Claim with acknowledgement of receipt: All the respondent units which had not remitted their filled in questionnaire by the end of the above stage, received by registered mail and with an acknowledgement of receipt, a second questionnaire with the mention “Claim of compulsory statistical data” (document PS2)
Location of non-found units: At the end of the first round of calls (to all the units in the survey), it turned out that a percentage of them could not be touched. They all belonged to a special queue of units: the QUEUE OF NON TOUCHED UNITS. Despite the implementation of all the available means, it was impossible to touch some of them. However, the above mentioned telephone information web pages continued to be looked through.
Stage following the collection of questionnaires One of the interviewer’s tasks is the recording and debugging of all the incoming questionnaires. After recording the questionnaires, they pass to the codification team. The occupation and the education level are codified at this point. To eliminate the errors, all computer applications classify the errors in two large blocks: type I or big errors and type II or small errors. Type I errors are so important that they invalidate the questionnaire. Type II errors may arise from specific circumstances of the enterprise’s activity, from its activity during the data reference period or from any specific event of the respondent unit. The first debugging should be carried out at the latest from 8 to 10 days after the recording, that is, 10-15 days after the questionnaires are received. The recording and the first debugging stage finished by the end of the year 2011. The second debugging of all the units was completed in March 2012. The tabulation was prepared at the end of May and in June. The first remittance of data to Eurostat was done at the 15 June 2012; several errors were found and corrected so the final version was sent on 26 October 2012. Publication dates: On 24 October 2012, the detailed results were disseminated. This publication is composed by a document with the comment of the main results and large set of tables. The information is available on INTERNET and on electronic support at request. |
|||
| 7.2.1. Punctuality - delivery and publication | |||
[Not requested] |
|||
|
||||||||||||||||||||||||||||||||||||||||||||||||||||||||||||||||||||||||||||||||
| 8.1. Comparability - geographical | ||||||||||||||||||||||||||||||||||||||||||||||||||||||||||||||||||||||||||||||||
There are no differences between national and European concepts regarding statistical units, definition of variables and classifications. The only difference in the reference population is that apprentices are not included since SES 2006 as explained above. Most of the effort made by the unit responsible for Labour Cost Statistics went on the detailed study of the variables contained in Commission Regulation No. 1738/2005 and its comparison with labour laws and forms of retribution in force in Spain in the year 2010. From this comparative study we obtained a version of the questionnaire adapted to the reality of the country, which allowed us to obtain the variables as defined in the above-mentioned regulation. |
||||||||||||||||||||||||||||||||||||||||||||||||||||||||||||||||||||||||||||||||
| 8.1.1. Asymmetry for mirror flow statistics - coefficient | ||||||||||||||||||||||||||||||||||||||||||||||||||||||||||||||||||||||||||||||||
[Not requested] |
||||||||||||||||||||||||||||||||||||||||||||||||||||||||||||||||||||||||||||||||
| 8.2. Comparability - over time | ||||||||||||||||||||||||||||||||||||||||||||||||||||||||||||||||||||||||||||||||
Since the first Structural Earnings Survey was conducted the coverage of the following surveys has been extended including different groups of units. Thus, in first SES 1995 units with ten or more employees in the activities of industry, building, commerce, hotels and restaurants, transport, communications, finance institutions and insurance were included. The second, which referred to the 2002, broadened the coverage to include the activities outlined in sections M, N and O of NACE Rev.1. The third with 2006 as a reference year, has as a main As a consequence of the inclusion of the small units since SES 2006, there is a decrease of the average earnings compared with the general SES 2002 results. It is necessary to eliminate the size 1-9 employees from SES 2006 to compare homogeneous results with SES 2002. The main difficulty to compare SES 2010 with the previous surveys is the change in the classifications used in last one. So, it is not possible to compare the results by economic activity or by occupation. |
||||||||||||||||||||||||||||||||||||||||||||||||||||||||||||||||||||||||||||||||
| 8.2.1. Length of comparable time series | ||||||||||||||||||||||||||||||||||||||||||||||||||||||||||||||||||||||||||||||||
[Not requested] |
||||||||||||||||||||||||||||||||||||||||||||||||||||||||||||||||||||||||||||||||
| 8.3. Coherence - cross domain | ||||||||||||||||||||||||||||||||||||||||||||||||||||||||||||||||||||||||||||||||
According with the Regulation a comparison should be made between the variable “gross annual earnings in the reference year”, expressed per employee, and the variable “wages and salaries”, per employee, of the National Accounts. The figures available from National Accounts correspond to the 2010 provisional data about Compensation of employees and the full-time equivalent employees from the “Series of Accounts 2000-2011. Base year 2008” published in December 2012. Wages and salaries are not available for 2010. Data from SES are the estimations on average gross annual earnings per employee (expressed in full time equivalents) that have worked 30 and more weeks. Data on gross annual earnings per employee from SES and compensation per employee
The figures from National Accounts are greater than those from SES in almost all sections (between 20 and 40 %), because of the variable compensation of employees includes the employers’ social contributions. Taking into account that the employers’ social contributions has a weight in the total labour costs that varies between 20%-35%, depending on the economic activity, the coherence between both sources seems to be achieved. |
||||||||||||||||||||||||||||||||||||||||||||||||||||||||||||||||||||||||||||||||
| 8.4. Coherence - sub annual and annual statistics | ||||||||||||||||||||||||||||||||||||||||||||||||||||||||||||||||||||||||||||||||
[Not requested] |
||||||||||||||||||||||||||||||||||||||||||||||||||||||||||||||||||||||||||||||||
| 8.5. Coherence - National Accounts | ||||||||||||||||||||||||||||||||||||||||||||||||||||||||||||||||||||||||||||||||
[Not requested] |
||||||||||||||||||||||||||||||||||||||||||||||||||||||||||||||||||||||||||||||||
| 8.6. Coherence - internal | ||||||||||||||||||||||||||||||||||||||||||||||||||||||||||||||||||||||||||||||||
[Not requested] |
||||||||||||||||||||||||||||||||||||||||||||||||||||||||||||||||||||||||||||||||
|
|||
| 9.1. Dissemination format - News release | |||
[Not requested] |
|||
| 9.2. Dissemination format - Publications | |||
The tables, the document on the results and the methodological document are available for free on the INE web site. The release was sent to the main official users. |
|||
| 9.3. Dissemination format - online database | |||
The tables, the document on the results and the methodological document are available for free on the INE web site. |
|||
| 9.3.1. Data tables - consultations | |||
[Not requested] |
|||
| 9.4. Dissemination format - microdata access | |||
A microdata standard anonymised file using a similar methodology as presented in the LAMAS Working Group on March 2008 is available for free at the web site. Moreover, it is possible to prepare customised anonymous survey files studying the variables requested and also, based on the basic statistical operations files, crosses other than those published may be carried out between variables, according to the needs of the user. |
|||
| 9.5. Dissemination format - other | |||
The results are not remitted to the respondents. |
|||
| 9.6. Documentation on methodology | |||
The tables, the document on the results and the methodological document are available for free on the INE web site. |
|||
| 9.7. Quality management - documentation | |||
[Not requested] |
|||
| 9.7.1. Metadata completeness - rate | |||
[Not requested] |
|||
| 9.7.2. Metadata - consultations | |||
[Not requested] |
|||
|
|||
[Not requested] |
|||
|
|||
| 11.1. Confidentiality - policy | |||
[Not requested] |
|||
| 11.2. Confidentiality - data treatment | |||
[Not requested] |
|||
|
|||
More information on Annexes: Methodoloy of SES 2010 |
|||
|
|||
|
|||