|
 |
|
| For any question on data and metadata, please contact: Eurostat user support |
|
|||
| 1.1. Contact organisation | German Federal Statistical Office |
||
| 1.2. Contact organisation unit | E109 "Structure of earnings survey, Labour cost survey" |
||
| 1.5. Contact mail address | Gustav-Stresemann-Ring 11 65189 Wiesbaden Germany |
||
|
|||
| 2.1. Data description | |||
[Not requested] |
|||
| 2.2. Classification system | |||
Not available. |
|||
| 2.3. Coverage - sector | |||
Not available. |
|||
| 2.4. Statistical concepts and definitions | |||
Not available. |
|||
| 2.5. Statistical unit | |||
Not available. |
|||
| 2.6. Statistical population | |||
Not available. |
|||
| 2.7. Reference area | |||
Not available. |
|||
| 2.8. Coverage - Time | |||
Not available. |
|||
| 2.9. Base period | |||
Not available. |
|||
|
|||
| 3.1. Source data | |||
[Not requested] |
|||
| 3.2. Frequency of data collection | |||
[Not requested] |
|||
| 3.3. Data collection | |||
[Not requested] |
|||
| 3.4. Data validation | |||
[Not requested] |
|||
| 3.5. Data compilation | |||
[Not requested] |
|||
| 3.6. Adjustment | |||
[Not requested] |
|||
|
|||
| 4.1. Quality assurance | |||
Not available. |
|||
| 4.2. Quality management - assessment | |||
[Not requested] |
|||
|
|||
| 5.1. Relevance - User Needs | |||
In Germany, the results of the survey are used by the federal government and the Land governments, employers' and workers' organisations, regional representative offices of industry, economic and social sciences research and insurance companies. These users are mainly concerned with the distribution of gross earnings, that is the proportion of employees above or below certain earnings thresholds or in earnings bands. Enquiries are most frequently from private individuals wishing to find out about the average earnings in a particular occupation. |
|||
| 5.2. Relevance - User Satisfaction | |||
No specific attempt has been made to collect information about the data requirement of the main users, their assessment of its completeness or redundancy or their satisfaction with the data they have been offered. |
|||
| 5.3. Completeness | |||
[Not requested] |
|||
| 5.3.1. Data completeness - rate | |||
[Not requested] |
|||
|
||||||||||||||||||||||||||||||||||||||||
- |
||||||||||||||||||||||||||||||||||||||||
| 6.1. Accuracy - overall | ||||||||||||||||||||||||||||||||||||||||
[Not requested] |
||||||||||||||||||||||||||||||||||||||||
| 6.2. Sampling error | ||||||||||||||||||||||||||||||||||||||||
[Not requested] |
||||||||||||||||||||||||||||||||||||||||
| 6.2.1. Sampling error - indicators | ||||||||||||||||||||||||||||||||||||||||
See the attached document Coefficients of variation. Annexes: Coefficients of variation |
||||||||||||||||||||||||||||||||||||||||
| 6.3. Non-sampling error | ||||||||||||||||||||||||||||||||||||||||
[Not requested] |
||||||||||||||||||||||||||||||||||||||||
| 6.3.1. Coverage error | ||||||||||||||||||||||||||||||||||||||||
The results for sections O (all) and P (most) of NACE Rev. 2 have been obtained not from a survey, but from model-based estimates. The results for section O were all and for section P nearly all based on data on public-sector workers covered by a specific national public-sector workforce statistics, the Personalstandstatistik. In comparison with the data of the national accounts for 2010, this has enabled the Structure of Earnings Survey to achieve a coverage of 89% of all workers in section O "Public administration, defence; compulsory social security" but only of 70% in section P "Education". While persons engaged in military or civilian service were not covered and persons in marginal part-time employment were under-represented in section O, in section P this applied to workers of non-state employers, mainly in nursery schools and schools providing general education in section P. A large proportion of the workers not covered in section P were presumably not part of the target population of the Structure of Earnings Survey because they worked for local units with fewer than ten workers. It can be assumed that employees with extremely high earnings have been under-represented: the sample for the 2010 Structure of Earnings Survey included 70 employees (grossed-up 561 employees) with gross annual earnings in excess of EUR 1 million. On the other hand, the official wage and income tax statistics for 2007 (more recent data not yet available) included 2 394 persons with an estimated gross salary in excess of EUR 1 million (not including persons with gross salary from pension payments). The under-representation might be due to the fact that company managing and other directors were paid separately from other staff in what were sometimes highly confidential payroll systems and were not included in reporting. Companies were not expressly requested in questionnaires either to include such persons or a sample of them in reporting, or to leave them out. There is no indication of under-representation or over-representation of employees with very low earnings. There was an over-representation rate of 6.3% for the sample of 33 333 local units taken from the companies register. This means that 63 out of 1 000 sample local units were not part of the target population, having for the most part ceased to operate by the time of the survey. |
||||||||||||||||||||||||||||||||||||||||
| 6.3.1.1. Over-coverage - rate | ||||||||||||||||||||||||||||||||||||||||
[Not requested] |
||||||||||||||||||||||||||||||||||||||||
| 6.3.1.2. Common units - proportion | ||||||||||||||||||||||||||||||||||||||||
[Not requested] |
||||||||||||||||||||||||||||||||||||||||
| 6.3.2. Measurement error | ||||||||||||||||||||||||||||||||||||||||
Errors in collecting the data were kept as few as possible through detailed questionnaires and explanations of all variables. Payroll accounting definitions were adhered to closely, which means that the respondents were able to take most variables directly from the payroll. This included, in particular, the use of the code indicating activities in statutory social security reporting. The code must be used and maintained by employers for social security purposes with regard to all workers covered by social security (Data recording and transfer ordinance – DEÜV). The code had to be entered to all five digits in the 2010 Structure of Earnings Survey, making it unnecessary to use plain text to indicate occupation and education. This arrangement has considerably simplified matters for the respondents and statistical offices, but has made the quality of the survey variables obtained from the survey dependent on the quality of the code and its conversion into international classifications of occupation (ISCO-08) and education (ISCED 97).
|
||||||||||||||||||||||||||||||||||||||||
| 6.3.3. Non response error | ||||||||||||||||||||||||||||||||||||||||
Unit response rate 99.0% = 30 924 / (30 924 + 314) (relating to the local units in the sample that belonged to the target population, i.e. "in-scope respondents"). 30 924 of the 33 333 local units in the sample submitted reports. 314 of the 2 409 non-reporting local units belonged to the target population and 2 095 did not (see under-representation rate under 6.3.1). |
||||||||||||||||||||||||||||||||||||||||
| 6.3.3.1. Unit non-response - rate | ||||||||||||||||||||||||||||||||||||||||
[Not requested] |
||||||||||||||||||||||||||||||||||||||||
| 6.3.3.2. Item non-response - rate | ||||||||||||||||||||||||||||||||||||||||
[Not requested] |
||||||||||||||||||||||||||||||||||||||||
| 6.3.4. Processing error | ||||||||||||||||||||||||||||||||||||||||
[Not requested] |
||||||||||||||||||||||||||||||||||||||||
| 6.3.4.1. Imputation - rate | ||||||||||||||||||||||||||||||||||||||||
Item imputation rate/population imputation rate No such rate could be calculated, as missing data had in all cases been supplemented by re-contacting the respondent local units, until the data set was complete. Only if this was impossible were implausible or missing data estimated from comparable values for similar workers or average values from other surveys concerning earnings statistics. These cases were not flagged, making it impossible to estimate distortions. Occupation (2.3) has been derived from the code for occupation from statutory social security reporting. This code has options for apprentices, trainees and unskilled workers, from which no activity under ISCO-08 can be derived. Data records with such options were automatically imputed a different value of the code, for which derivation was possible. This value corresponded to the most frequent valid code value in the dataset group contained in the 2006 Structure of Earnings Survey. Data records have been grouped according to branch (82 options), gender (2 options) and skill category (6 options). The code of variable 2.3 was then derived from the imputed value using the allocation paradigm (re-coding), as in the case of non-imputed data records. Variable 2.3 was imputed in this way for an estimated 4% of all employees. The Highest successfully completed level of education and training variable (2.5) was derived from the code for indicating education from statutory social security reporting. This code offers the option "Education unknown, no entry possible". Data records with this option were automatically imputed a valid code value. This value corresponded to the most frequent valid code value in the dataset group contained in the 2006 Structure of Earnings Survey. Data records were grouped according to branch (82 options), gender (2 options) and skill category (6 options). The code of variable 2.5 was then derived from the imputed value using the allocation paradigm (re-coding), as in the case of non-imputed data records. Variable 2.5 was imputed in this way for an estimated 15% of all employees. |
||||||||||||||||||||||||||||||||||||||||
| 6.3.5. Model assumption error | ||||||||||||||||||||||||||||||||||||||||
Correction of Unit-Nonresponse The 1.0% shortfall through Unit-Nonresponse was offset by giving the reporters belonging to the same sampling stratum a higher grossing-up factor. 0.7% of the grossed-up workers originate from this correction.
Data for sections O "Public administration, defence; compulsory social security (all) and P "Education" (most) The basic framework was provided by the data records available at almost individual level for 3.9 million public-sector employees from public-sector workforce statistics as at 30 June 2010. The public-sector workforce statistics are an annual survey of all employees of public-sector employers. Only a few variables of the public-sector workforce statistics could be directly transferred to the dataset of the Structure of Earnings Survey. They included gender (2.1), age (2.2), contractual working hours (2.7), the normal number of working hours of a full-time worker (2.7.1) and gross monthly earnings in June 2010 (in the case of collectively-agreed changes extrapolated to October 2010) for variable 4.2. Unlike in the case of other data items, June, not October, is considered to be the reference month, except for in the case of gross monthly earnings. Other variables could only be approximated from the public-sector workforce statistics variables by making plausible assumptions. For example, Occupation (2.3) and Highest successfully completed level of education and training (2.5) were entered using the remuneration group and employment area. In section O, there was insufficient information available for the Occupation (2.3) to be entered reliably; this variable was left blank for all the data records of this section. In the absence of data concerning taxes and social security contributions in the public-sector workforce statistics, they have been calculated using legal requirements (contribution rates, contribution ceilings, intermediate categories for midi-jobs, additional worker contribution rate, guidelines relating to the Income Tax Act). Wage tax category 1 has been assumed for all workers, since it was impossible to differentiate between wage tax categories. This means that the wage taxes (4.2.3.2) of women have been underestimated and those of men overestimated on average. The top-ups for part-time work for older employees are not taxed and no social security contributions are payable. Account has been taken of this in calculations based on the assumption of wage category 1. Seniority has been calculated on the basis of age and level of education. The following variables could not be derived and calculated and were entered as zero: Number of overtime hours paid in the reference month (3.2.1), Remuneration for overtime (4.2.1) and Special payments for shift work (4.2.2). The drops in quality are presumably very small in section P, where shift work and the payment of overtime are rare. This is not the case in section O, however, since unsocial working hours are common in certain occupations, for example in the police and fire service. According to the results of the Labour Force Survey, for example, about 11% of employees in section O worked in rotating shifts, compared with 17% for all sections. There is no information concerning enterprise size categories. Because the data relate exclusively to workers in the public sector, the biggest enterprise size category (1 000 or more workers ) was estimated in each case. |
||||||||||||||||||||||||||||||||||||||||
| 6.4. Seasonal adjustment | ||||||||||||||||||||||||||||||||||||||||
[Not requested] |
||||||||||||||||||||||||||||||||||||||||
| 6.5. Data revision - policy | ||||||||||||||||||||||||||||||||||||||||
[Not requested] |
||||||||||||||||||||||||||||||||||||||||
| 6.6. Data revision - practice | ||||||||||||||||||||||||||||||||||||||||
[Not requested] |
||||||||||||||||||||||||||||||||||||||||
| 6.6.1. Data revision - average size | ||||||||||||||||||||||||||||||||||||||||
[Not requested] |
||||||||||||||||||||||||||||||||||||||||
|
|||
| 7.1. Timeliness | |||
The initial results at national level were published with a press release on 26 July 2012. This means that there was a period of 19 months between the reference period and initial publication. |
|||
| 7.1.1. Time lag - first result | |||
[Not requested] |
|||
| 7.1.2. Time lag - final result | |||
[Not requested] |
|||
| 7.2. Punctuality | |||
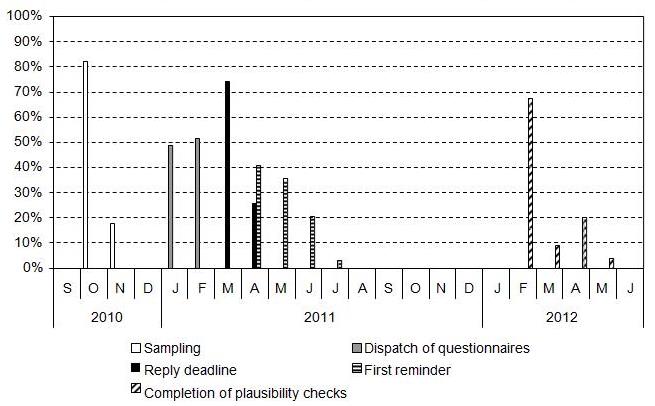
The field work was carried out by 14 Land statistical offices. The field work phases had different deadlines for different Land statistical offices. Figure 1 provides a breakdown of the most important deadlines for the Land statistical offices. The Land statistical offices have been weighted for this purpose on the basis of the number of local units they consulted. The selected local units received the survey questionnaire January 2011. The reply deadline was usually 31 March 2011. After that date, local units that had failed to replay were sent phased reminders, warnings and notices of administrative proceedings. The survey forms were collected and checked and any further questions were sent to the local units during this period. The plausibility checks were completed and the data collected sent to the Federal Statistical Office between February and May 2012, depending on the Land office (the planned deadline was 29.02.2012).
Proportion of Land statistical offices having particular field work deadlines
From January to June 2012, the Federal Statistical Office generated data for data items not covered by the survey in sections O and P, checked, returned and corrected the data collected and sent by the Land statistical offices using Eurostat’s and own checks and fulfilled its delivery obligations to Eurostat. The Federal Statistical Office delivered the final data to Eurostat on 14 June 2012. |
|||
| 7.2.1. Punctuality - delivery and publication | |||
[Not requested] |
|||
|
||||||||||||||||||||||||||||||||||||||||||||||||||||||||||||||||||||||||||||||||||
| 8.1. Comparability - geographical | ||||||||||||||||||||||||||||||||||||||||||||||||||||||||||||||||||||||||||||||||||
Results for section O "Public administration, defence; compulsory social security" (all) and section P "Education" (most) were determined not through the survey, but through model-based estimation procedures. The geographical comparability of the results of these sections with other EU States and also between German regions is limited by the estimation procedures. First of all, they under-represent certain private-sector local units (section P) to a different extent in different regions, causing earnings to be overestimated and, in some cases, underestimated in a way that is unquantifiable. Secondly, there was no information about enterprise size categories. Because all the workers were in the public sector, the biggest enterprise size category (1 000 or more workers) was always chosen and entered in variable 1.2. |
||||||||||||||||||||||||||||||||||||||||||||||||||||||||||||||||||||||||||||||||||
| 8.1.1. Asymmetry for mirror flow statistics - coefficient | ||||||||||||||||||||||||||||||||||||||||||||||||||||||||||||||||||||||||||||||||||
[Not requested] |
||||||||||||||||||||||||||||||||||||||||||||||||||||||||||||||||||||||||||||||||||
| 8.2. Comparability - over time | ||||||||||||||||||||||||||||||||||||||||||||||||||||||||||||||||||||||||||||||||||
There have been no changes in definitions in comparison with the 2006 Structure of Earnings Survey. The survey and processing method has also remained nearly identical in terms of the variables of Regulation (EC) No 1916/2000. Reference year 2010 is the first year for which section O "Public administration, defence; compulsory social security" of NACE Rev. 2 has been included, with the data being sent to Eurostat. Data for this section have also been generated retrospectively for reference year 2006, but these data have not been sent to Eurostat. |
||||||||||||||||||||||||||||||||||||||||||||||||||||||||||||||||||||||||||||||||||
| 8.2.1. Length of comparable time series | ||||||||||||||||||||||||||||||||||||||||||||||||||||||||||||||||||||||||||||||||||
[Not requested] |
||||||||||||||||||||||||||||||||||||||||||||||||||||||||||||||||||||||||||||||||||
| 8.3. Coherence - cross domain | ||||||||||||||||||||||||||||||||||||||||||||||||||||||||||||||||||||||||||||||||||
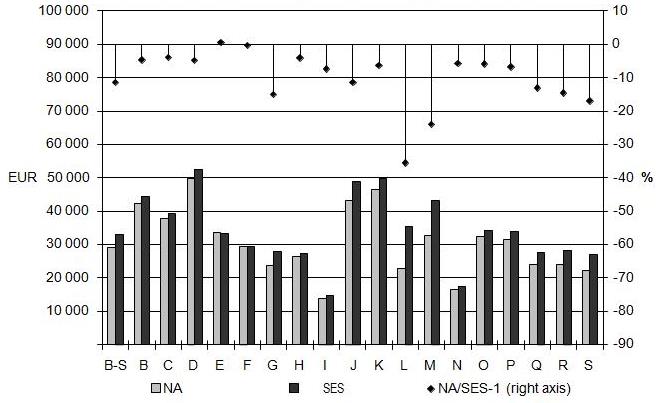
Comparison with national accounts Gross annual earnings per worker in the Structure of Earnings Survey (SES) and wages and salaries per worker in the national accounts (NA), 2010
Gross annual earnings per worker in the Structure of Earnings Survey (SES) and wages and salaries per worker in the national accounts (NA), 2010
The wages and salaries of the NA for sections B to S were about 11% lower than the SES value. The difference was presumably partly due to the exclusion of micro-local units with fewer than 10 workers from the SES. The wages and salaries per worker in micro-local units are lower than the SES average. |
||||||||||||||||||||||||||||||||||||||||||||||||||||||||||||||||||||||||||||||||||
| 8.4. Coherence - sub annual and annual statistics | ||||||||||||||||||||||||||||||||||||||||||||||||||||||||||||||||||||||||||||||||||
[Not requested] |
||||||||||||||||||||||||||||||||||||||||||||||||||||||||||||||||||||||||||||||||||
| 8.5. Coherence - National Accounts | ||||||||||||||||||||||||||||||||||||||||||||||||||||||||||||||||||||||||||||||||||
[Not requested] |
||||||||||||||||||||||||||||||||||||||||||||||||||||||||||||||||||||||||||||||||||
| 8.6. Coherence - internal | ||||||||||||||||||||||||||||||||||||||||||||||||||||||||||||||||||||||||||||||||||
[Not requested] |
||||||||||||||||||||||||||||||||||||||||||||||||||||||||||||||||||||||||||||||||||
|
|||
| 9.1. Dissemination format - News release | |||
[Not requested] |
|||
| 9.2. Dissemination format - Publications | |||
The most important results at national level were distributed in the following publications:
This publication is available free of charge as a PDF or Excel document on the webpages of the Federal Statistical Office (www.destatis.de/publikationen).
This publication is available free of charge as a PDF document: Internet list of press conferences and briefings (www.destatis.de).
This publication is available online in STATmagazin, the web magazine of the Federal Statistical Office, under Verdienste und Arbeitskosten [Earnings and labour costs] |
|||
| 9.3. Dissemination format - online database | |||
[Not requested] |
|||
| 9.3.1. Data tables - consultations | |||
[Not requested] |
|||
| 9.4. Dissemination format - microdata access | |||
The micro-data of the Structure of Earnings Surveys (or the former Surveys of Salary and Wage Structure) for 1990, 1992, 1995, 2001, 2006 and 2010 are provided by the research data centres of the Federal and Land statistical offices for academic research purposes. The surveys for all the years are available in-house the research data centres (visiting academics, remote data processing). A Public-Use-File is now available for survey years 2001 and 2006 and a Scientific-Use-File for survey years 2001, 2006 and 2010 (www.forschungsdatenzentrum.de). |
|||
| 9.5. Dissemination format - other | |||
The reporting local units were sent the results only on request. |
|||
| 9.6. Documentation on methodology | |||
A quality report prepared according to national requirements, the questionnaire and a detailed description of the publication features have been published together with the results:
This report has been included in the collection of all the quality reports of the Federal Statistical Office on the internet (www.destatis.de). The survey methodology has been described in detail in a specialist article:
A collection of the most important meta-data (e.g. descriptions of variables, classifications, questionnaires) of the Structure of Earnings Surveys (or the former Surveys of Salary and Wage Structure) for 1990, 1992, 1995, 2001 and 2006 are available on the internet in the meta-data system of the research data centres of the federal and Land statistical offices (www.forschungsdatenzentrum.de). |
|||
| 9.7. Quality management - documentation | |||
[Not requested] |
|||
| 9.7.1. Metadata completeness - rate | |||
[Not requested] |
|||
| 9.7.2. Metadata - consultations | |||
[Not requested] |
|||
|
|||
[Not requested] |
|||
|
|||
| 11.1. Confidentiality - policy | |||
[Not requested] |
|||
| 11.2. Confidentiality - data treatment | |||
[Not requested] |
|||
|
|||
[Not requested] |
|||
|
|||
|
|||