|
 |
|
| For any question on data and metadata, please contact: Eurostat user support |
|
|||
| 1.1. Contact organisation | REPUBLIC OF BULGARIA NATIONAL STATISTICAL INSTITUTE |
||
| 1.2. Contact organisation unit | Labour Statistics Unit Business Statistics Department |
||
| 1.5. Contact mail address | 2, P. Volov Str. 1038 Sofia Bulgaria |
||
|
|||
| 2.1. Data description | |||
The Structure of Earnings Survey 2010 (SES 2010) is the third of the series of four-yearly surveys carried out by the National Statistical Institute of Bulgaria under the Council Regulation (EC) No 530/1999, the Commission Regulation (EC) No 1916/2000 (amended) and the Commission Regulation (EC) No 1738/2005. This quality report is prepared in accordance with the Commission Regulation No 698/2006 of 5 May 2006 implementing Council Regulation (EC) No. 530/99 concerning quality evaluation of structural statistics on labour costs and earnings. Following the structure of the CR, the document provides information on the six dimensions of the European Statistical System quality definition, namely relevance, accuracy, timeliness and punctuality, accessibility and clarity, comparability, and coherence. |
|||
| 2.2. Classification system | |||
Not available. |
|||
| 2.3. Coverage - sector | |||
Not available. |
|||
| 2.4. Statistical concepts and definitions | |||
Not available. |
|||
| 2.5. Statistical unit | |||
Not available. |
|||
| 2.6. Statistical population | |||
Not available. |
|||
| 2.7. Reference area | |||
Not available. |
|||
| 2.8. Coverage - Time | |||
Not available. |
|||
| 2.9. Base period | |||
Not available. |
|||
|
||||||||||||||||||||||||||||||||||||||||||||||||||||||||
| 3.1. Source data | ||||||||||||||||||||||||||||||||||||||||||||||||||||||||
Sampling technique The sampling procedure used for the SES contains two stages. In the first stage, a stratified random sample of local units without replacement is drawn. Stratification criteria used include:
- 1 to 9 employees;
- BG3 - Severna i Yugoiztochna Bulgaria (North and South-East Bulgaria)
In the table below are presented sampling rates for local units and employees. To achieve certain predefined precision of the results it was estimated that 194044 employees (62132 in BG3, 131912 in BG4) or 8.2% of total population shall be observed. On base of average number of employees per local unit broken down by the stratification criteria (NUTS-NACE-size) it was calculated that approximately 9.5% of local units shall be selected in the sample to obtain data for the planned number of employees. All local units with 500 and more employees and these belonging to stratification cells with fewer than 5 local units are included exhaustively in the sample.
Sampling rates for local units and employees by size classes
At the second stage, a systematic sample of employees is taken within each of the selected local units. No stratification criteria are used at this second stage. For each size class were fixed different sampling rates (sampling steps) and a rotating random start digit for each local unit was allocated by computer so that the start digit is rotated continually over the economic activities.
Sampling rates for employees within local units by size classes
At the first sampling stage 19 220 local units were selected, of which 14 987 responded units provided data for approximately 205 000 employees. |
||||||||||||||||||||||||||||||||||||||||||||||||||||||||
| 3.2. Frequency of data collection | ||||||||||||||||||||||||||||||||||||||||||||||||||||||||
[Not requested] |
||||||||||||||||||||||||||||||||||||||||||||||||||||||||
| 3.3. Data collection | ||||||||||||||||||||||||||||||||||||||||||||||||||||||||
Survey tools used for purposes of data collection are as follows: 1. Dispatch note to each respondent about the purposes of the survey. 2. Statistical questionnaire: part A collecting information for sampled local units and part B collecting information for each sampled employee. 3. Explanatory notes for sampling of employees within the local units and instructions on information required.
The SES questionnaire was developed on paper and in electronic format, uploaded on the official web page of NSI. The electronic questionnaire was developed as a user-friendly Excel application SES_2010.xls. The outlook is completely the same as the paper version of the questionnaire. The main advantages of the programme are:
The outputs from the program are two files: (1) working - which is automatically generated by the system when the data entry begins in the same folder where the questionnaire is stored. This allows respondents to enter the files at different moments of time and to enter or edit the data. (2) final - which is generated by the system when data are completed and all validation checks are passed.
The electronic format of the SES2010 questionnaire was used by 45% of all responded units which is four times more compared to the SES2006 when only 10% of respondents made electronic data delivery. The survey covers all mandatory variables included in Commission Regulation N 1738/2005 and the following optional items: var. 1.6, var. 4.1.2, var. 4.3, var. 4.2.3.1, var. 4.2.3.2. Variables covered in the survey are obtained in different ways to achieve best possible results:
var. 1.1 Region;
var. 1.2 Size of the enterprise to which the local unit belongs;
var. 2.6 Length of service in enterprise (in complete years) is calculated as at October 2010. In the questionnaire we ask for the initial date of entry into the enterprise.
Var. 2.6 = 102010 - Month and year of entry in to service;
(Hours per day*Days per week)part-time employee / (Hours per day*Days per week)full-time employee;
(Number of days actually worked) / (Working days per week);
(Total gross earning, incl. irreg. bonuses and payments in kind) - (Irregular bonuses paid in reference month) - (Payments in kind paid in reference month);
Var. 4.3 = var. 4.2 / var. 3.2.;
|
||||||||||||||||||||||||||||||||||||||||||||||||||||||||
| 3.4. Data validation | ||||||||||||||||||||||||||||||||||||||||||||||||||||||||
All data have been validated at micro and macro level. Approximately 100 controls have been applied on micro data, including Eurostat’s checks listed in document “Eurostat’s arrangements for implementing CR 530/1999, the CRs 1916/2000 and 1738/2005”. When certain check was not satisfied after reference to the respondent or other available sources the data were either corrected or reasons for failure were recorded in a designated field by ROs and/or Head Office of NSI. In the next section are described Eurostat’s checks that have not been met, how many records failed the corresponding test and why NSI accepted data as valid.
(Variable 3.2) Number of hours actually paid during the reference month If var.2.7 = FT, then 130 hours < (var.3.2 – var.3.2.1) < 215 hours There were 182 records (1.2%) that do not satisfy the above check. Most of the records (161) are with normal working hours in October 2010 below 130 hours. This data relate to employees working 6 hours per day, 5 days per week who are declared by the local units like full-time workers. The rest of the records are with normal working hours above 214. This data relate to employees working 10 - 11 hours per day in NACE sections G and F where long working hours are plausible due nature of these economic activities.
If var.2.7 = PT, then 130 * (var.2.7.1/100)< (var.3.2 – var.3.2.1) < 215 * (var.2.7.1/100) There were 10 records that do not satisfy the above check. It is due to the denominator used for calculation of var. 2.7.1 for the part-timers, i.e. normal working hours of the corresponding full-time worker deviate from the conventional pattern 8 hours per day, 5 days per week.
(Variable 3.2.1) Number of overtime hours paid in the reference month var.3.2.1 < 0.65 * (var.3.2 – var.3.2.1) There were 4 records that do not satisfy the above check. Three of the employees work in NACE section Q where overtime hours often represent a high proportion from the working hours. The other employee works in section N - data are checked and confirmed with the enterprise and administrative source.
(Variable 4.1) Gross annual earnings in the reference year var.4.1 > (var.4.2 – var.4.2.1) * 0.70 * var.3.1 / (4.345238) There were 718 records (4.8%) that do not satisfy the above check. Main reasons are: significant increase in the monthly earnings confirmed by LU (promotion, improved economic situation for employer, etc.), change of the daily working hours, high regular bonuses depending on productivity and other regular payments which vary between pay periods.
(Variable 4.1.2) Optional: Annual payments in kind var.4.1.2 < 0.20 * var.4.1 There were 2989 records (20%) that do not satisfy the above check. For the most of the cases payments in kind are fixed amounts per day worked or per month and do not depend on the size of the employee’s earnings or on the employee’s presence in the enterprise during the reference period - most typical in NACE sections B, D, E and H.
(Variable 4.2.1) Earnings related to overtime If (var.3.2.1 > 0 and var.4.2.1 > 0), then (var.4.2.1 / var.3.2.1) ≥ (var.4.2 – var.4.2.1) / (var.3.2 - var.3.2.1) * 0.60 There were 230 records (1.5%) that do not satisfy the above check. These are such cases in which overtime payment of employees is determined on the base of:
|
||||||||||||||||||||||||||||||||||||||||||||||||||||||||
| 3.5. Data compilation | ||||||||||||||||||||||||||||||||||||||||||||||||||||||||
[Not requested] |
||||||||||||||||||||||||||||||||||||||||||||||||||||||||
| 3.6. Adjustment | ||||||||||||||||||||||||||||||||||||||||||||||||||||||||
[Not requested] |
||||||||||||||||||||||||||||||||||||||||||||||||||||||||
|
|||
| 4.1. Quality assurance | |||
Not available. |
|||
| 4.2. Quality management - assessment | |||
[Not requested] |
|||
|
|||
| 5.1. Relevance - User Needs | |||
The user groups are defined on the base of the data requests received by NSI. The customers of the SES results can be classified as follows:
- National - Ministries, Agencies, Councils, other governmental bodies and public institutions; - International - Eurostat, ILO, OECD, UNICEF, UNECE
NSI has not carried out a specific survey among users to know their needs of information concerning SES and whether they are satisfied with the published results. Users usually prefer more detailed data at the lowest levels of the classifications applied in the survey which is problematic due to the limited number of observations and correspondingly the lower level of precision. The most demanded data are earnings breakdowns by occupations, gender, level of education, working time conditions, existence of collective pay agreement, economic activity, public/ private control and different combinations between these variables. |
|||
| 5.2. Relevance - User Satisfaction | |||
NSI has not carried out a specific survey among users to know their needs of information concerning SES and whether they are satisfied with the published results. |
|||
| 5.3. Completeness | |||
The 2010 SES satisfies the needs of the main user – European Commission (Eurostat) in terms of:
|
|||
| 5.3.1. Data completeness - rate | |||
[Not requested] |
|||
|
||||||||||||||||||||||||||||||||||||||||||||||||||||||||||||||||||||||||||||||||||||||||||||||||||||||||||||||||||||||||||||||||||||||||||||||||||||||||||||||||||||||||||||||||||||||||||||||||||||||||||||||||||||||||||||||||||||||||||||||||||||||||||||||||||||||||||||||||||||||||||||||||||||||||||||||||||||||||||||||||||||||||||||||||||||||||||||||||||||||||||||||||||||||||||||||||||||||||||||||||||||||||||||||||||||||||||||||||||||||||||||||||||||||||||||||||||||||||||||||||||||||||||||||||||||||||||||||||||||||||||||||||||||||||||||||||||||||||||||||||||||||||||||||||||||||||||||||||||
- |
||||||||||||||||||||||||||||||||||||||||||||||||||||||||||||||||||||||||||||||||||||||||||||||||||||||||||||||||||||||||||||||||||||||||||||||||||||||||||||||||||||||||||||||||||||||||||||||||||||||||||||||||||||||||||||||||||||||||||||||||||||||||||||||||||||||||||||||||||||||||||||||||||||||||||||||||||||||||||||||||||||||||||||||||||||||||||||||||||||||||||||||||||||||||||||||||||||||||||||||||||||||||||||||||||||||||||||||||||||||||||||||||||||||||||||||||||||||||||||||||||||||||||||||||||||||||||||||||||||||||||||||||||||||||||||||||||||||||||||||||||||||||||||||||||||||||||||||||||
| 6.1. Accuracy - overall | ||||||||||||||||||||||||||||||||||||||||||||||||||||||||||||||||||||||||||||||||||||||||||||||||||||||||||||||||||||||||||||||||||||||||||||||||||||||||||||||||||||||||||||||||||||||||||||||||||||||||||||||||||||||||||||||||||||||||||||||||||||||||||||||||||||||||||||||||||||||||||||||||||||||||||||||||||||||||||||||||||||||||||||||||||||||||||||||||||||||||||||||||||||||||||||||||||||||||||||||||||||||||||||||||||||||||||||||||||||||||||||||||||||||||||||||||||||||||||||||||||||||||||||||||||||||||||||||||||||||||||||||||||||||||||||||||||||||||||||||||||||||||||||||||||||||||||||||||||
[Not requested] |
||||||||||||||||||||||||||||||||||||||||||||||||||||||||||||||||||||||||||||||||||||||||||||||||||||||||||||||||||||||||||||||||||||||||||||||||||||||||||||||||||||||||||||||||||||||||||||||||||||||||||||||||||||||||||||||||||||||||||||||||||||||||||||||||||||||||||||||||||||||||||||||||||||||||||||||||||||||||||||||||||||||||||||||||||||||||||||||||||||||||||||||||||||||||||||||||||||||||||||||||||||||||||||||||||||||||||||||||||||||||||||||||||||||||||||||||||||||||||||||||||||||||||||||||||||||||||||||||||||||||||||||||||||||||||||||||||||||||||||||||||||||||||||||||||||||||||||||||||
| 6.2. Sampling error | ||||||||||||||||||||||||||||||||||||||||||||||||||||||||||||||||||||||||||||||||||||||||||||||||||||||||||||||||||||||||||||||||||||||||||||||||||||||||||||||||||||||||||||||||||||||||||||||||||||||||||||||||||||||||||||||||||||||||||||||||||||||||||||||||||||||||||||||||||||||||||||||||||||||||||||||||||||||||||||||||||||||||||||||||||||||||||||||||||||||||||||||||||||||||||||||||||||||||||||||||||||||||||||||||||||||||||||||||||||||||||||||||||||||||||||||||||||||||||||||||||||||||||||||||||||||||||||||||||||||||||||||||||||||||||||||||||||||||||||||||||||||||||||||||||||||||||||||||||
- |
||||||||||||||||||||||||||||||||||||||||||||||||||||||||||||||||||||||||||||||||||||||||||||||||||||||||||||||||||||||||||||||||||||||||||||||||||||||||||||||||||||||||||||||||||||||||||||||||||||||||||||||||||||||||||||||||||||||||||||||||||||||||||||||||||||||||||||||||||||||||||||||||||||||||||||||||||||||||||||||||||||||||||||||||||||||||||||||||||||||||||||||||||||||||||||||||||||||||||||||||||||||||||||||||||||||||||||||||||||||||||||||||||||||||||||||||||||||||||||||||||||||||||||||||||||||||||||||||||||||||||||||||||||||||||||||||||||||||||||||||||||||||||||||||||||||||||||||||||
| 6.2.1. Sampling error - indicators | ||||||||||||||||||||||||||||||||||||||||||||||||||||||||||||||||||||||||||||||||||||||||||||||||||||||||||||||||||||||||||||||||||||||||||||||||||||||||||||||||||||||||||||||||||||||||||||||||||||||||||||||||||||||||||||||||||||||||||||||||||||||||||||||||||||||||||||||||||||||||||||||||||||||||||||||||||||||||||||||||||||||||||||||||||||||||||||||||||||||||||||||||||||||||||||||||||||||||||||||||||||||||||||||||||||||||||||||||||||||||||||||||||||||||||||||||||||||||||||||||||||||||||||||||||||||||||||||||||||||||||||||||||||||||||||||||||||||||||||||||||||||||||||||||||||||||||||||||||
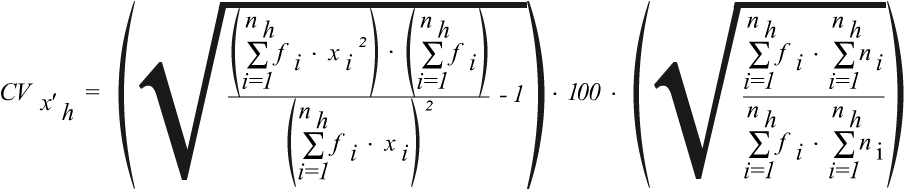
Coefficients of variation Coefficients of variaion are calculated by use of the H-T estimator:
where x′h is estimate of the total gross earnings:
xi - individual gross earnings of each sampled employee in strata h; ni - number of sampled employees in strata h; fi - individual grossing-up factor of each sampled employee in strata h:
Mh - total number of local units in the population in strata h; mh - number of sampled local units in strata h; Nkh - total number of employees in the k-th sampled local unit in strata h; nkh - number of sampled employees in the k-th local unit.
In the the attached document Coefficients of variation are presented coefficients of variations concerning variables ‘Gross earnings in the reference month’ and ‘Average gross hourly earnings’ as required in the Commission Regulation N 698/2006. CVs are low for most of the relevant items and important classification levels. The highest CVs appeared for small heterogeneous populations with low sampling probability, e.g. hourly earnings of part-time female workers with 40 and more years length of service show a CV of 77.1%). High values occurred also in cases of high unit non-response rate (small number of observations). The following criteria were agreed for data publishing:
Extreme values were removed from the dataset and grossing-up factors were recalculated. From calculations were excluded 0.1% of records with the highest and 0.1% of records with the lowest hourly earnings in each division from 05 to 96 of NACE Rev.2. As a total 389 records were deleted that is 0.2% of all cases. Annexes: Coefficients of variation |
||||||||||||||||||||||||||||||||||||||||||||||||||||||||||||||||||||||||||||||||||||||||||||||||||||||||||||||||||||||||||||||||||||||||||||||||||||||||||||||||||||||||||||||||||||||||||||||||||||||||||||||||||||||||||||||||||||||||||||||||||||||||||||||||||||||||||||||||||||||||||||||||||||||||||||||||||||||||||||||||||||||||||||||||||||||||||||||||||||||||||||||||||||||||||||||||||||||||||||||||||||||||||||||||||||||||||||||||||||||||||||||||||||||||||||||||||||||||||||||||||||||||||||||||||||||||||||||||||||||||||||||||||||||||||||||||||||||||||||||||||||||||||||||||||||||||||||||||||
| 6.3. Non-sampling error | ||||||||||||||||||||||||||||||||||||||||||||||||||||||||||||||||||||||||||||||||||||||||||||||||||||||||||||||||||||||||||||||||||||||||||||||||||||||||||||||||||||||||||||||||||||||||||||||||||||||||||||||||||||||||||||||||||||||||||||||||||||||||||||||||||||||||||||||||||||||||||||||||||||||||||||||||||||||||||||||||||||||||||||||||||||||||||||||||||||||||||||||||||||||||||||||||||||||||||||||||||||||||||||||||||||||||||||||||||||||||||||||||||||||||||||||||||||||||||||||||||||||||||||||||||||||||||||||||||||||||||||||||||||||||||||||||||||||||||||||||||||||||||||||||||||||||||||||||||
- |
||||||||||||||||||||||||||||||||||||||||||||||||||||||||||||||||||||||||||||||||||||||||||||||||||||||||||||||||||||||||||||||||||||||||||||||||||||||||||||||||||||||||||||||||||||||||||||||||||||||||||||||||||||||||||||||||||||||||||||||||||||||||||||||||||||||||||||||||||||||||||||||||||||||||||||||||||||||||||||||||||||||||||||||||||||||||||||||||||||||||||||||||||||||||||||||||||||||||||||||||||||||||||||||||||||||||||||||||||||||||||||||||||||||||||||||||||||||||||||||||||||||||||||||||||||||||||||||||||||||||||||||||||||||||||||||||||||||||||||||||||||||||||||||||||||||||||||||||||
| 6.3.1. Coverage error | ||||||||||||||||||||||||||||||||||||||||||||||||||||||||||||||||||||||||||||||||||||||||||||||||||||||||||||||||||||||||||||||||||||||||||||||||||||||||||||||||||||||||||||||||||||||||||||||||||||||||||||||||||||||||||||||||||||||||||||||||||||||||||||||||||||||||||||||||||||||||||||||||||||||||||||||||||||||||||||||||||||||||||||||||||||||||||||||||||||||||||||||||||||||||||||||||||||||||||||||||||||||||||||||||||||||||||||||||||||||||||||||||||||||||||||||||||||||||||||||||||||||||||||||||||||||||||||||||||||||||||||||||||||||||||||||||||||||||||||||||||||||||||||||||||||||||||||||||||
The sample of local units was taken from the local units’ population as of 31.12.2009. The sampling frame represented the most current situation of the Business Register available at the time of the sampling. In the sampling frame population were included all local units with 1 or more employees that belonged to enterprises with 1 or more employees within the NACE Rev. 2 sections B to S, including O. The under-coverage refers to the situation when newly emerged or units with renewed activity with 1 or more employees within NACE sections B to S were not included in the sampling frame. The under-coverage was not quantified. To offset the errors that might arise from under-coverage and for purposes of the weighting procedure the framework population was updated where appropriate with the most recent situation of Business Register in 2010 to reflect major changes and fluctuations between NACE divisions and size classes of enterprises. As over-coverage are referred sampled local units that during the reference period have been already closed-down, dormant units or units without employees. The overall over-coverage rate is 11.8%. Over-coverage rates by NACE divisions are presented in 6.3.1.1. When there have been cases of over-coverage, new units have not been sampled. |
||||||||||||||||||||||||||||||||||||||||||||||||||||||||||||||||||||||||||||||||||||||||||||||||||||||||||||||||||||||||||||||||||||||||||||||||||||||||||||||||||||||||||||||||||||||||||||||||||||||||||||||||||||||||||||||||||||||||||||||||||||||||||||||||||||||||||||||||||||||||||||||||||||||||||||||||||||||||||||||||||||||||||||||||||||||||||||||||||||||||||||||||||||||||||||||||||||||||||||||||||||||||||||||||||||||||||||||||||||||||||||||||||||||||||||||||||||||||||||||||||||||||||||||||||||||||||||||||||||||||||||||||||||||||||||||||||||||||||||||||||||||||||||||||||||||||||||||||||
| 6.3.1.1. Over-coverage - rate | ||||||||||||||||||||||||||||||||||||||||||||||||||||||||||||||||||||||||||||||||||||||||||||||||||||||||||||||||||||||||||||||||||||||||||||||||||||||||||||||||||||||||||||||||||||||||||||||||||||||||||||||||||||||||||||||||||||||||||||||||||||||||||||||||||||||||||||||||||||||||||||||||||||||||||||||||||||||||||||||||||||||||||||||||||||||||||||||||||||||||||||||||||||||||||||||||||||||||||||||||||||||||||||||||||||||||||||||||||||||||||||||||||||||||||||||||||||||||||||||||||||||||||||||||||||||||||||||||||||||||||||||||||||||||||||||||||||||||||||||||||||||||||||||||||||||||||||||||||
Over-coverage in the sample by NACE section
|
||||||||||||||||||||||||||||||||||||||||||||||||||||||||||||||||||||||||||||||||||||||||||||||||||||||||||||||||||||||||||||||||||||||||||||||||||||||||||||||||||||||||||||||||||||||||||||||||||||||||||||||||||||||||||||||||||||||||||||||||||||||||||||||||||||||||||||||||||||||||||||||||||||||||||||||||||||||||||||||||||||||||||||||||||||||||||||||||||||||||||||||||||||||||||||||||||||||||||||||||||||||||||||||||||||||||||||||||||||||||||||||||||||||||||||||||||||||||||||||||||||||||||||||||||||||||||||||||||||||||||||||||||||||||||||||||||||||||||||||||||||||||||||||||||||||||||||||||||
| 6.3.1.2. Common units - proportion | ||||||||||||||||||||||||||||||||||||||||||||||||||||||||||||||||||||||||||||||||||||||||||||||||||||||||||||||||||||||||||||||||||||||||||||||||||||||||||||||||||||||||||||||||||||||||||||||||||||||||||||||||||||||||||||||||||||||||||||||||||||||||||||||||||||||||||||||||||||||||||||||||||||||||||||||||||||||||||||||||||||||||||||||||||||||||||||||||||||||||||||||||||||||||||||||||||||||||||||||||||||||||||||||||||||||||||||||||||||||||||||||||||||||||||||||||||||||||||||||||||||||||||||||||||||||||||||||||||||||||||||||||||||||||||||||||||||||||||||||||||||||||||||||||||||||||||||||||||
[Not requested] |
||||||||||||||||||||||||||||||||||||||||||||||||||||||||||||||||||||||||||||||||||||||||||||||||||||||||||||||||||||||||||||||||||||||||||||||||||||||||||||||||||||||||||||||||||||||||||||||||||||||||||||||||||||||||||||||||||||||||||||||||||||||||||||||||||||||||||||||||||||||||||||||||||||||||||||||||||||||||||||||||||||||||||||||||||||||||||||||||||||||||||||||||||||||||||||||||||||||||||||||||||||||||||||||||||||||||||||||||||||||||||||||||||||||||||||||||||||||||||||||||||||||||||||||||||||||||||||||||||||||||||||||||||||||||||||||||||||||||||||||||||||||||||||||||||||||||||||||||||
| 6.3.2. Measurement error | ||||||||||||||||||||||||||||||||||||||||||||||||||||||||||||||||||||||||||||||||||||||||||||||||||||||||||||||||||||||||||||||||||||||||||||||||||||||||||||||||||||||||||||||||||||||||||||||||||||||||||||||||||||||||||||||||||||||||||||||||||||||||||||||||||||||||||||||||||||||||||||||||||||||||||||||||||||||||||||||||||||||||||||||||||||||||||||||||||||||||||||||||||||||||||||||||||||||||||||||||||||||||||||||||||||||||||||||||||||||||||||||||||||||||||||||||||||||||||||||||||||||||||||||||||||||||||||||||||||||||||||||||||||||||||||||||||||||||||||||||||||||||||||||||||||||||||||||||||
To avoid measurement errors detailed explanatory notes with illustrative examples were attached to the questionnaire. To further help the respondents a list with contact information was posted on Internet and telephone consultations on methodological and technical issues were provided. The Regional Offices were also provided by the Head office of NSI with written and telephone guidance how to process data and deal with arising problems.
Main sources of measurement and processing errors are:
|
||||||||||||||||||||||||||||||||||||||||||||||||||||||||||||||||||||||||||||||||||||||||||||||||||||||||||||||||||||||||||||||||||||||||||||||||||||||||||||||||||||||||||||||||||||||||||||||||||||||||||||||||||||||||||||||||||||||||||||||||||||||||||||||||||||||||||||||||||||||||||||||||||||||||||||||||||||||||||||||||||||||||||||||||||||||||||||||||||||||||||||||||||||||||||||||||||||||||||||||||||||||||||||||||||||||||||||||||||||||||||||||||||||||||||||||||||||||||||||||||||||||||||||||||||||||||||||||||||||||||||||||||||||||||||||||||||||||||||||||||||||||||||||||||||||||||||||||||||
| 6.3.3. Non response error | ||||||||||||||||||||||||||||||||||||||||||||||||||||||||||||||||||||||||||||||||||||||||||||||||||||||||||||||||||||||||||||||||||||||||||||||||||||||||||||||||||||||||||||||||||||||||||||||||||||||||||||||||||||||||||||||||||||||||||||||||||||||||||||||||||||||||||||||||||||||||||||||||||||||||||||||||||||||||||||||||||||||||||||||||||||||||||||||||||||||||||||||||||||||||||||||||||||||||||||||||||||||||||||||||||||||||||||||||||||||||||||||||||||||||||||||||||||||||||||||||||||||||||||||||||||||||||||||||||||||||||||||||||||||||||||||||||||||||||||||||||||||||||||||||||||||||||||||||||
In the table below are presented two types of unit response rates - the first one calculated to the total number of sampled units and the second one calculated to the total number of in-scope respondents (enterprises with one or more employees with earnings in October 2010). Rates are broken down by divisions of NACE Rev. 2 and by size classes - 1 or more employees, 1 to 9 employees (optional), 10 or more employees (mandatory). The overall unit response rate for in-scope respondents with 1 or more employees is 88.4% and for the mandatory size class of enterprises with 10 or more employees the response rate is 93.6%. The lowest is the unit response rate for small units with 1 to 9 employees - 85.8% and the rate to the total sample is even lower - 72.2%. The lower response rates for the enterprises with 1 to 9 employees could be explained with their dynamic nature featuring with frequent structural changes and instability as regards location, economic activity, financial status and employment - peculiarities for which it is difficult to maintain up to date information in the business register. The main reasons reported by the regional offices of NSI for the high non-response levels are rather “not found (out of date contact information)”, “closed down/sleeping”, “no employees in the reference period” than explicit refusals. While the total response rates are acceptable in some economic activities response levels are quite low (< 60 %) when going to the NUTS1 breakdown and more detailed size classes.
Unit response rate
Regional offices reported that nearly 44% of respondents were reminded for their duty to reply by phone calls, e-mail and follow-up letters. In the official period of data collection (April - May 2011) only 58% of responses were received. To improve response rate the deadline was prolonged three times. Two follow-up letters were signed by the President of NSI and send to non-respondents. Special attention was paid to cells (NUTSxNACExSize) with response rates between 0 and 60%. Unit non-response adjustment is done by means of the naive method of re-weighting - sample size is replaced with the number of the responded units in weighting:
Nh - total number of local units in strata h nh - number of sampled local units in strata h wh - weight of the sampled local units in strata h whfinal - adjusted weight of responded local units in strata h |
||||||||||||||||||||||||||||||||||||||||||||||||||||||||||||||||||||||||||||||||||||||||||||||||||||||||||||||||||||||||||||||||||||||||||||||||||||||||||||||||||||||||||||||||||||||||||||||||||||||||||||||||||||||||||||||||||||||||||||||||||||||||||||||||||||||||||||||||||||||||||||||||||||||||||||||||||||||||||||||||||||||||||||||||||||||||||||||||||||||||||||||||||||||||||||||||||||||||||||||||||||||||||||||||||||||||||||||||||||||||||||||||||||||||||||||||||||||||||||||||||||||||||||||||||||||||||||||||||||||||||||||||||||||||||||||||||||||||||||||||||||||||||||||||||||||||||||||||||
| 6.3.3.1. Unit non-response - rate | ||||||||||||||||||||||||||||||||||||||||||||||||||||||||||||||||||||||||||||||||||||||||||||||||||||||||||||||||||||||||||||||||||||||||||||||||||||||||||||||||||||||||||||||||||||||||||||||||||||||||||||||||||||||||||||||||||||||||||||||||||||||||||||||||||||||||||||||||||||||||||||||||||||||||||||||||||||||||||||||||||||||||||||||||||||||||||||||||||||||||||||||||||||||||||||||||||||||||||||||||||||||||||||||||||||||||||||||||||||||||||||||||||||||||||||||||||||||||||||||||||||||||||||||||||||||||||||||||||||||||||||||||||||||||||||||||||||||||||||||||||||||||||||||||||||||||||||||||||
[Not requested] |
||||||||||||||||||||||||||||||||||||||||||||||||||||||||||||||||||||||||||||||||||||||||||||||||||||||||||||||||||||||||||||||||||||||||||||||||||||||||||||||||||||||||||||||||||||||||||||||||||||||||||||||||||||||||||||||||||||||||||||||||||||||||||||||||||||||||||||||||||||||||||||||||||||||||||||||||||||||||||||||||||||||||||||||||||||||||||||||||||||||||||||||||||||||||||||||||||||||||||||||||||||||||||||||||||||||||||||||||||||||||||||||||||||||||||||||||||||||||||||||||||||||||||||||||||||||||||||||||||||||||||||||||||||||||||||||||||||||||||||||||||||||||||||||||||||||||||||||||||
| 6.3.3.2. Item non-response - rate | ||||||||||||||||||||||||||||||||||||||||||||||||||||||||||||||||||||||||||||||||||||||||||||||||||||||||||||||||||||||||||||||||||||||||||||||||||||||||||||||||||||||||||||||||||||||||||||||||||||||||||||||||||||||||||||||||||||||||||||||||||||||||||||||||||||||||||||||||||||||||||||||||||||||||||||||||||||||||||||||||||||||||||||||||||||||||||||||||||||||||||||||||||||||||||||||||||||||||||||||||||||||||||||||||||||||||||||||||||||||||||||||||||||||||||||||||||||||||||||||||||||||||||||||||||||||||||||||||||||||||||||||||||||||||||||||||||||||||||||||||||||||||||||||||||||||||||||||||||
[Not requested] |
||||||||||||||||||||||||||||||||||||||||||||||||||||||||||||||||||||||||||||||||||||||||||||||||||||||||||||||||||||||||||||||||||||||||||||||||||||||||||||||||||||||||||||||||||||||||||||||||||||||||||||||||||||||||||||||||||||||||||||||||||||||||||||||||||||||||||||||||||||||||||||||||||||||||||||||||||||||||||||||||||||||||||||||||||||||||||||||||||||||||||||||||||||||||||||||||||||||||||||||||||||||||||||||||||||||||||||||||||||||||||||||||||||||||||||||||||||||||||||||||||||||||||||||||||||||||||||||||||||||||||||||||||||||||||||||||||||||||||||||||||||||||||||||||||||||||||||||||||
| 6.3.4. Processing error | ||||||||||||||||||||||||||||||||||||||||||||||||||||||||||||||||||||||||||||||||||||||||||||||||||||||||||||||||||||||||||||||||||||||||||||||||||||||||||||||||||||||||||||||||||||||||||||||||||||||||||||||||||||||||||||||||||||||||||||||||||||||||||||||||||||||||||||||||||||||||||||||||||||||||||||||||||||||||||||||||||||||||||||||||||||||||||||||||||||||||||||||||||||||||||||||||||||||||||||||||||||||||||||||||||||||||||||||||||||||||||||||||||||||||||||||||||||||||||||||||||||||||||||||||||||||||||||||||||||||||||||||||||||||||||||||||||||||||||||||||||||||||||||||||||||||||||||||||||
The evaluation of quality at regional level was done by virtue of a questionnaire concerning number of issues. As regards measurement and processing errors Regional Offices were asked which variables have been most often corrected - wrong or missing. In the following table are listed variables that were reported by the 28 Regional offices (ROs) of NSI as being most problematic.
SES2010 variables most often corrected by the 28 Regional offices of NSI
In addition ROs reported that approximately 32% of responded units were contacted for reference on completeness, compliance and consistency of the data. Main sources of measurement and processing errors are:
Methods applied for correction of data that were identified as wrong (inconsistent, impossible values, missing values, not corresponding to definition, wrong format) differ depending on the type, seriousness of error and willingness of respondents to cooperate:
Methods applied for imputation of missing item are: logical imputation, mean imputation, hot deck method, cold deck method. |
||||||||||||||||||||||||||||||||||||||||||||||||||||||||||||||||||||||||||||||||||||||||||||||||||||||||||||||||||||||||||||||||||||||||||||||||||||||||||||||||||||||||||||||||||||||||||||||||||||||||||||||||||||||||||||||||||||||||||||||||||||||||||||||||||||||||||||||||||||||||||||||||||||||||||||||||||||||||||||||||||||||||||||||||||||||||||||||||||||||||||||||||||||||||||||||||||||||||||||||||||||||||||||||||||||||||||||||||||||||||||||||||||||||||||||||||||||||||||||||||||||||||||||||||||||||||||||||||||||||||||||||||||||||||||||||||||||||||||||||||||||||||||||||||||||||||||||||||||
| 6.3.4.1. Imputation - rate | ||||||||||||||||||||||||||||||||||||||||||||||||||||||||||||||||||||||||||||||||||||||||||||||||||||||||||||||||||||||||||||||||||||||||||||||||||||||||||||||||||||||||||||||||||||||||||||||||||||||||||||||||||||||||||||||||||||||||||||||||||||||||||||||||||||||||||||||||||||||||||||||||||||||||||||||||||||||||||||||||||||||||||||||||||||||||||||||||||||||||||||||||||||||||||||||||||||||||||||||||||||||||||||||||||||||||||||||||||||||||||||||||||||||||||||||||||||||||||||||||||||||||||||||||||||||||||||||||||||||||||||||||||||||||||||||||||||||||||||||||||||||||||||||||||||||||||||||||||
Rates of corrected cases (including imputations for item non-response) are calculated for each variable by comparing data received initially from ROs or from respondents with final values of variables after validation and editing at the Head Office of NSI. In the table below are presented both number of corrected cases and rates computed as percentage from total number of cases.
Rates of corrected variables in SES2010 at the Head office of NSI
Normally, no item non-response (blank or zero values) has been accepted for any of the key variables. Only eight[1] of the collected items could possibly be zero and therefore item non-response could be supposed. In the following table are presented number of imputed cases and rate of imputed item non-response for these variables.
Item imputation rates
Methods applied for imputation of missing item are: logical imputation, mean imputation, hot deck method, cold deck method. In addition, 520 employees’ records (0.3% of all cases) were imputed for some of the local units that provided data for significantly less employees than required or provided data were completely unreliable (e.g. one record duplicated number of times). As main data donor is used the Register of insured persons that contains many of key variables. Variables that were missing in the Register were imputed by any of the above-sited imputation techniques.
[1] Variables “Irregular bonuses paid in reference month” and “Payments in kind paid in reference month” are not part of CR 1738/2005 but has direct influence on var. 4.2 Monthly gross earnings which is derived variable (see item 6.3.2. and 6.3.4. Measurement and processing errors). |
||||||||||||||||||||||||||||||||||||||||||||||||||||||||||||||||||||||||||||||||||||||||||||||||||||||||||||||||||||||||||||||||||||||||||||||||||||||||||||||||||||||||||||||||||||||||||||||||||||||||||||||||||||||||||||||||||||||||||||||||||||||||||||||||||||||||||||||||||||||||||||||||||||||||||||||||||||||||||||||||||||||||||||||||||||||||||||||||||||||||||||||||||||||||||||||||||||||||||||||||||||||||||||||||||||||||||||||||||||||||||||||||||||||||||||||||||||||||||||||||||||||||||||||||||||||||||||||||||||||||||||||||||||||||||||||||||||||||||||||||||||||||||||||||||||||||||||||||||
| 6.3.5. Model assumption error | ||||||||||||||||||||||||||||||||||||||||||||||||||||||||||||||||||||||||||||||||||||||||||||||||||||||||||||||||||||||||||||||||||||||||||||||||||||||||||||||||||||||||||||||||||||||||||||||||||||||||||||||||||||||||||||||||||||||||||||||||||||||||||||||||||||||||||||||||||||||||||||||||||||||||||||||||||||||||||||||||||||||||||||||||||||||||||||||||||||||||||||||||||||||||||||||||||||||||||||||||||||||||||||||||||||||||||||||||||||||||||||||||||||||||||||||||||||||||||||||||||||||||||||||||||||||||||||||||||||||||||||||||||||||||||||||||||||||||||||||||||||||||||||||||||||||||||||||||||
The representative month of the Bulgarian SES is October. This month has been selected as least influenced by absences as public holidays and annual paid leave. There is no difference between fiscal and calendar year in Bulgaria. The Bulgarian SES 2010 covers the NACE Rev. 2 sections B to S. The full coverage of these activities depends on the ability of the register to reflect the changes of the target populations. Three variables (var. 1.1 Region, var. 1.3 Economic activity, var. 1.4 Economic and Financial control) were derived from Business register by linking of individual data trough unique identity number. |
||||||||||||||||||||||||||||||||||||||||||||||||||||||||||||||||||||||||||||||||||||||||||||||||||||||||||||||||||||||||||||||||||||||||||||||||||||||||||||||||||||||||||||||||||||||||||||||||||||||||||||||||||||||||||||||||||||||||||||||||||||||||||||||||||||||||||||||||||||||||||||||||||||||||||||||||||||||||||||||||||||||||||||||||||||||||||||||||||||||||||||||||||||||||||||||||||||||||||||||||||||||||||||||||||||||||||||||||||||||||||||||||||||||||||||||||||||||||||||||||||||||||||||||||||||||||||||||||||||||||||||||||||||||||||||||||||||||||||||||||||||||||||||||||||||||||||||||||||
| 6.4. Seasonal adjustment | ||||||||||||||||||||||||||||||||||||||||||||||||||||||||||||||||||||||||||||||||||||||||||||||||||||||||||||||||||||||||||||||||||||||||||||||||||||||||||||||||||||||||||||||||||||||||||||||||||||||||||||||||||||||||||||||||||||||||||||||||||||||||||||||||||||||||||||||||||||||||||||||||||||||||||||||||||||||||||||||||||||||||||||||||||||||||||||||||||||||||||||||||||||||||||||||||||||||||||||||||||||||||||||||||||||||||||||||||||||||||||||||||||||||||||||||||||||||||||||||||||||||||||||||||||||||||||||||||||||||||||||||||||||||||||||||||||||||||||||||||||||||||||||||||||||||||||||||||||
[Not requested] |
||||||||||||||||||||||||||||||||||||||||||||||||||||||||||||||||||||||||||||||||||||||||||||||||||||||||||||||||||||||||||||||||||||||||||||||||||||||||||||||||||||||||||||||||||||||||||||||||||||||||||||||||||||||||||||||||||||||||||||||||||||||||||||||||||||||||||||||||||||||||||||||||||||||||||||||||||||||||||||||||||||||||||||||||||||||||||||||||||||||||||||||||||||||||||||||||||||||||||||||||||||||||||||||||||||||||||||||||||||||||||||||||||||||||||||||||||||||||||||||||||||||||||||||||||||||||||||||||||||||||||||||||||||||||||||||||||||||||||||||||||||||||||||||||||||||||||||||||||
| 6.5. Data revision - policy | ||||||||||||||||||||||||||||||||||||||||||||||||||||||||||||||||||||||||||||||||||||||||||||||||||||||||||||||||||||||||||||||||||||||||||||||||||||||||||||||||||||||||||||||||||||||||||||||||||||||||||||||||||||||||||||||||||||||||||||||||||||||||||||||||||||||||||||||||||||||||||||||||||||||||||||||||||||||||||||||||||||||||||||||||||||||||||||||||||||||||||||||||||||||||||||||||||||||||||||||||||||||||||||||||||||||||||||||||||||||||||||||||||||||||||||||||||||||||||||||||||||||||||||||||||||||||||||||||||||||||||||||||||||||||||||||||||||||||||||||||||||||||||||||||||||||||||||||||||
[Not requested] |
||||||||||||||||||||||||||||||||||||||||||||||||||||||||||||||||||||||||||||||||||||||||||||||||||||||||||||||||||||||||||||||||||||||||||||||||||||||||||||||||||||||||||||||||||||||||||||||||||||||||||||||||||||||||||||||||||||||||||||||||||||||||||||||||||||||||||||||||||||||||||||||||||||||||||||||||||||||||||||||||||||||||||||||||||||||||||||||||||||||||||||||||||||||||||||||||||||||||||||||||||||||||||||||||||||||||||||||||||||||||||||||||||||||||||||||||||||||||||||||||||||||||||||||||||||||||||||||||||||||||||||||||||||||||||||||||||||||||||||||||||||||||||||||||||||||||||||||||||
| 6.6. Data revision - practice | ||||||||||||||||||||||||||||||||||||||||||||||||||||||||||||||||||||||||||||||||||||||||||||||||||||||||||||||||||||||||||||||||||||||||||||||||||||||||||||||||||||||||||||||||||||||||||||||||||||||||||||||||||||||||||||||||||||||||||||||||||||||||||||||||||||||||||||||||||||||||||||||||||||||||||||||||||||||||||||||||||||||||||||||||||||||||||||||||||||||||||||||||||||||||||||||||||||||||||||||||||||||||||||||||||||||||||||||||||||||||||||||||||||||||||||||||||||||||||||||||||||||||||||||||||||||||||||||||||||||||||||||||||||||||||||||||||||||||||||||||||||||||||||||||||||||||||||||||||
[Not requested] |
||||||||||||||||||||||||||||||||||||||||||||||||||||||||||||||||||||||||||||||||||||||||||||||||||||||||||||||||||||||||||||||||||||||||||||||||||||||||||||||||||||||||||||||||||||||||||||||||||||||||||||||||||||||||||||||||||||||||||||||||||||||||||||||||||||||||||||||||||||||||||||||||||||||||||||||||||||||||||||||||||||||||||||||||||||||||||||||||||||||||||||||||||||||||||||||||||||||||||||||||||||||||||||||||||||||||||||||||||||||||||||||||||||||||||||||||||||||||||||||||||||||||||||||||||||||||||||||||||||||||||||||||||||||||||||||||||||||||||||||||||||||||||||||||||||||||||||||||||
| 6.6.1. Data revision - average size | ||||||||||||||||||||||||||||||||||||||||||||||||||||||||||||||||||||||||||||||||||||||||||||||||||||||||||||||||||||||||||||||||||||||||||||||||||||||||||||||||||||||||||||||||||||||||||||||||||||||||||||||||||||||||||||||||||||||||||||||||||||||||||||||||||||||||||||||||||||||||||||||||||||||||||||||||||||||||||||||||||||||||||||||||||||||||||||||||||||||||||||||||||||||||||||||||||||||||||||||||||||||||||||||||||||||||||||||||||||||||||||||||||||||||||||||||||||||||||||||||||||||||||||||||||||||||||||||||||||||||||||||||||||||||||||||||||||||||||||||||||||||||||||||||||||||||||||||||||
[Not requested] |
||||||||||||||||||||||||||||||||||||||||||||||||||||||||||||||||||||||||||||||||||||||||||||||||||||||||||||||||||||||||||||||||||||||||||||||||||||||||||||||||||||||||||||||||||||||||||||||||||||||||||||||||||||||||||||||||||||||||||||||||||||||||||||||||||||||||||||||||||||||||||||||||||||||||||||||||||||||||||||||||||||||||||||||||||||||||||||||||||||||||||||||||||||||||||||||||||||||||||||||||||||||||||||||||||||||||||||||||||||||||||||||||||||||||||||||||||||||||||||||||||||||||||||||||||||||||||||||||||||||||||||||||||||||||||||||||||||||||||||||||||||||||||||||||||||||||||||||||||
|
||||||||||||||
| 7.1. Timeliness | ||||||||||||||
First survey results were published on 10 July 2012. Micro data were sent to Eurostat on 17 September 2012. The publication with detailed survey results was submitted to the printing unit at the end of November 2012 and will be printed out at the beginning of 2013. Quality report is sent to Eurostat within a 2-week delay. The reasons for the delays from the scheduled deadlines are complex:
|
||||||||||||||
| 7.1.1. Time lag - first result | ||||||||||||||
[Not requested] |
||||||||||||||
| 7.1.2. Time lag - final result | ||||||||||||||
[Not requested] |
||||||||||||||
| 7.2. Punctuality | ||||||||||||||
|
||||||||||||||
| 7.2.1. Punctuality - delivery and publication | ||||||||||||||
[Not requested] |
||||||||||||||
|
|||
| 8.1. Comparability - geographical | |||
There are not differences between national concepts and European concepts as regard the definition of statistical units, the reference population, classifications and definitions of variables in the transferred results. |
|||
| 8.1.1. Asymmetry for mirror flow statistics - coefficient | |||
[Not requested] |
|||
| 8.2. Comparability - over time | |||
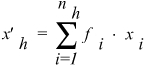
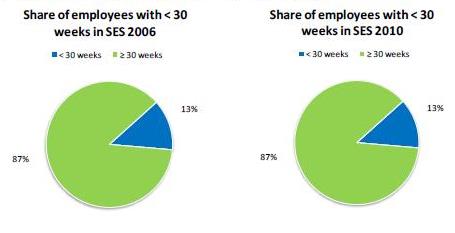
The comparability over time is influenced mainly by changes in definitions, coverage and methods as result of amendments of Community legislation. The only change undertaken by NSI after SES2002 that influence comparability between the three rounds of the SES is the extension of coverage of the survey to the enterprises with 1 or more employees. By recommendation of Eurostat NSI performed comparisons between SES2006 and SES2010 as regards three different structures: share of employees with less than 30 weeks during reference year; share of women; share of part-time employees.
Share of employees with < 30 weeks in reference year
Share of women
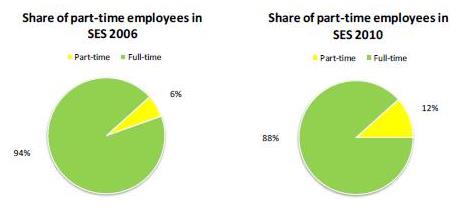
While the first two distributions remain the same, the proportion of part-time employees (see figure below) has risen twice in SES2010 compared to the SES2006. The main reason is that during the crisis many working places were transformed from full-time to part-time jobs to cut down labour costs.
Share of part-time employees
|
|||
| 8.2.1. Length of comparable time series | |||
[Not requested] |
|||
| 8.3. Coherence - cross domain | |||
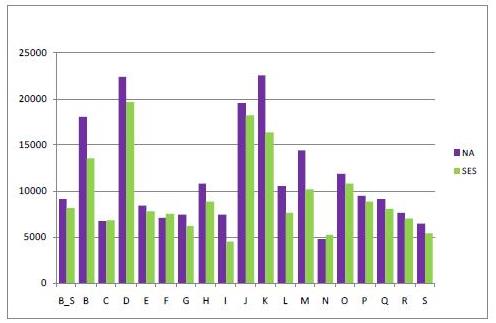
On the figure below is presented comparison between 'Average annual earnings' from SES and 'Wages and salaries' from National Accounts (NA) in 2010 by NACE Rev.2 sections. Values of annual earnings from SES for total B to S and in most of the NACE sections are lower than the corresponding values of wages and salaries from NA, except for sections C, F, N. Although the definitions of the compared variables are similar the two sources have many methodological and conceptual differences that explain the disparities in levels of earnings. Among the main reasons are:
'Average annual earnings' from SES and 'Wages and salaries' from NA in 2010 by NACE Rev.2 sections
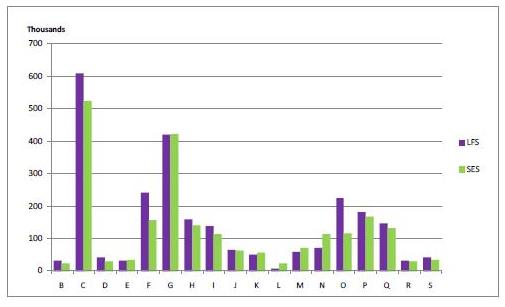
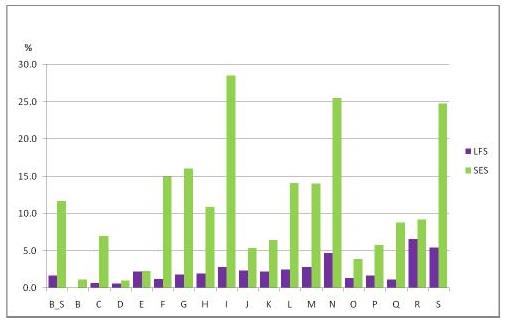
By recommendation of Eurostat NSI performed comparisons between the SES2010 data and annual data from LFS as regards three different dimensions: total number of employees (Figure "Number of employees in LFS and SES in 2010 by NACE Rev. 2 sections"); share of women (Figure "Share of women in LFS and SES in 2010 by NACE Rev. 2 sections"); share of part-time employees (Figure "Share of part-time employees in LFS and SES in 2010 by NACE Rev. 2 sections"). Comparisons are made for enterprises with 1 or more employees. The two sources have many methodological and conceptual differences that explain the disparities in levels and distributions of the compared variables. Some of the reasons for differences in total number of employees by NACE sections are:
Number of employees in LFS and SES in 2010 by NACE Rev. 2 sections
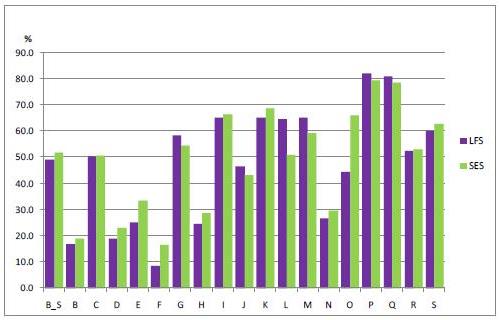
The differences in share of women between the two sources are larger for sections E, F, L and O (see Figure "Share of women in LFS and SES in 2010 by NACE Rev. 2 sections"). Sections E and L are small activities with small number of employees and differences might be a subject of a greater variance in LFS. In section F the absolute numbers of female employees in LFS and SES are similar but the total employment in LFS is considerably higher due to the high seasonality effect and informal employment present in this activity. The different share of women in section O is due to exclusion from SES of military forces and police which are male dominated activities. The relative share of part-timers in SES is significantly higher for the total B to S and all NACE sections, except section E (see Figure "Share of part-time employees in LFS and SES in 2010 by NACE Rev. 2 sections"). This might be explained partially by the fact that during the crisis many employers transformed only formally a lot of jobs from full-time to part-time to cut down labour costs on social security contributions but informally employees continued to work as full-timers. The LFS has captured this process where respondents are employees who report themselves their status as regards working time.
Share of women in LFS and SES in 2010 by NACE Rev. 2 sections
Share of part-time employees in LFS and SES in 2010 by NACE Rev. 2 sections
|
|||
| 8.4. Coherence - sub annual and annual statistics | |||
[Not requested] |
|||
| 8.5. Coherence - National Accounts | |||
[Not requested] |
|||
| 8.6. Coherence - internal | |||
[Not requested] |
|||
|
|||
| 9.1. Dissemination format - News release | |||
[Not requested] |
|||
| 9.2. Dissemination format - Publications | |||
Specialized publication “Structure of Earnings 2010” containing methodology, review of the main results, graphs and detailed table results was prepared for publishing on paper and CD-ROM. The publication is bilingual – in Bulgarian and English language. It is planned to upload the electronic publication on Internet. A copy of the publication will be send to Eurostat. |
|||
| 9.3. Dissemination format - online database | |||
On the internet site of NSI are uploaded most important table results together with detailed methodological notes in the Bulgarian and English languages - section “Labour market”, item 4.2 “Structure of Earnings”: http://www.nsi.bg/en/content/6520/structure-earnings-%E2%80%93-national-level-4-year-periodicity . |
|||
| 9.3.1. Data tables - consultations | |||
[Not requested] |
|||
| 9.4. Dissemination format - microdata access | |||
[Not requested] |
|||
| 9.5. Dissemination format - other | |||
Each of the respondents was informed in the dispatch note for the possibility to receive for free standard results from the SES. At about 30 sampled units expressed their will to receive results. The information was sent on a CD-ROM. |
|||
| 9.6. Documentation on methodology | |||
Detailed methodological notes are published on Internet in the Bulgarian and English languages - section “Labour market”, item 4.2 “Structure of Earnings”: http://www.nsi.bg/sites/default/files/files/metadata/Labour_Method_4.2_2010_EN.pdf . |
|||
| 9.7. Quality management - documentation | |||
[Not requested] |
|||
| 9.7.1. Metadata completeness - rate | |||
[Not requested] |
|||
| 9.7.2. Metadata - consultations | |||
[Not requested] |
|||
|
|||
[Not requested] |
|||
|
|||
| 11.1. Confidentiality - policy | |||
[Not requested] |
|||
| 11.2. Confidentiality - data treatment | |||
[Not requested] |
|||
|
|||
- |
|||
|
|||
|
|||