|
|
| For any question on data and metadata, please contact: Eurostat user support |
|
|||
| 1.1. Contact organisation | Eurostat (Statistical office of the European Union) |
||
| 1.2. Contact organisation unit | Unit E.1: Agriculture and fisheries |
||
| 1.5. Contact mail address | European Commission, Eurostat |
||
|
|||
Regulation (EC) No 543/2009 on crop statistics stipulates in Article 8 (2 and 3) that ‘Every three years, and for the first time by 1 October 2011, countries shall provide the Commission (Eurostat) with reports on the quality of the data transmitted. The Quality report, using the quality criteria referred to in paragraph 1, shall describe: (a) the organisation of the surveys covered by this Regulation and the methodology applied; (b) the level of precision achieved for the sample surveys referred to in this Regulation; and (c) the quality of sources other than surveys which are used.’ This report summarises the national quality reports (EU-countries, EEA countries and Switzerland) delivered for the deadline of 1st of October 2020. Quality reports are linked to the reference year 2019. National quality reports are also available for several candidate and potential candidate countries. |
|||
| 2.1. Data description | |||
The Annual crop statistics (ACS) data collection is based on Regulation (EC) No 543/2009 and Commission Delegated Regulation (EU) 2015/1557. In addition, a large number of countries delivers additional data voluntarily and/or based on the ESS Agreement on Annual Crop Statistics: Additional Crop Variables and Early Estimates. The ACS covers the data on main arable crops, vegetables and permanent crops. The data are collected for area, production, yield and main area, linked to 130 crop items and aggregates. Most of the data are collected at national level but some characteristics also at regional level (NUTS 1 and/or NUTS 2). In addition to the national figures Eurostat publishes EU-aggregates and standardized production and yield figures. |
|||
| 2.2. Classification system | |||
The crops are classified according to the Eurostat classification of all crop products, as presented in the Annual Crop Statistics Handbook, and to the NUTS regions (NUTS 2016). |
|||
| 2.3. Coverage - sector | |||
The Annual Crop Statistics cover the crop production on utilised agricultural area. |
|||
| 2.4. Statistical concepts and definitions | |||
Statistical concepts and definitions are presented in the Regulation (EC) No 543/2009 and in the Annual Crop Statistics Handbook.
Differences from definitions in Regulation/HandbookEleven countries stated that they deviate from some of the definitions in the Regulation (EC) No 543/2009, article 2. Most common were deviations from the area concept, mainly for arable crops (BE, CZ, DE, IE, PL, PT, SI, SE). According to Regulation (EC) No 543/2009 ‘area under cultivation’ means the area that corresponds to the total sown area, but after the harvest it excludes ruined areas (e.g. due to natural disasters). In most of the deviations, area under cultivation corresponds to sown area, though in case of major natural disasters or for certain crop items data might be adjusted to correspond to the harvested area. In Slovenia data on Permanent crop production area includes new plantations, and in Portugal in addition isolated/sparsed trees, linear-planted trees and trees not belonging to agricultural holdings. Hungary includes the production of Kitchen gardens to total production. For individual crop items 13 countries report that their national definition differs from the definitions in the Handbook (D-definition differs flag). The national quality report section 3.3 provides more information on deviations from the definitions in the Regulation/Handbook and on what is included/excluded in D flagged crop item data. |
|||
| 2.5. Statistical unit | |||
The areas are collected in 1 000 hectares (ha), the production figures in 1 000 tonnes (t) and the yields are recorded in t/ha. The humidity is expressed in % of moisture content. The production and yield is published both in EU-standard humidity and national humidity. |
|||
| 2.6. Statistical population | |||
The Annual Crop Statistics cover at least 95% of the following areas: a) total area under cultivation of crops from arable land, b) total harvested area of vegetables, melons and strawberries, c) total production area of permanent crops and d) total utilised agricultural area. |
|||
| 2.7. Reference area | |||
The reference area covers the EU27, Iceland, Norway and Switzerland. The statistics are also collected for several candidate and potential candidate countries. |
|||
| 2.8. Coverage - Time | |||
The data collection started in 1955 for a limited number of crops. The current legal basis entered into force in 2010 (Regulation (EC) No 543/2009) and was modified by Commission Delegated Regulation (EU) 2015/1557 in 2015. |
|||
| 2.9. Base period | |||
Not relevant |
|||
|
||||||||||||||||||||||||||||||||||||||||||||||||||
See points 3.1, 3.2, 3.3 and 3.4 |
||||||||||||||||||||||||||||||||||||||||||||||||||
| 3.1. Source data | ||||||||||||||||||||||||||||||||||||||||||||||||||
Compilation of Annual crop statistics data is based on multiple sources: surveys, administrative data, expert estimates, other sources and combination of these. Countries listed several types of data sources to fulfil the reporting obligations set by Regulation (EC) No 543/2009. The overview of the data sources can be seen in Figure 3.1.1. However, these shares should not be interpreted in relation with the final data values and type of sources behind these. For example expert estimates can be used for the early estimates only and/or complementing surveys. New data sources were reported by CZ, PT and IS.
Figure 3.1.1 - Overview of data sources
|
||||||||||||||||||||||||||||||||||||||||||||||||||
| 3.2. Frequency of data collection | ||||||||||||||||||||||||||||||||||||||||||||||||||
The national quality report section 3.2 provides information on the frequency and on the phases of national data collections. |
||||||||||||||||||||||||||||||||||||||||||||||||||
| 3.3. Data collection | ||||||||||||||||||||||||||||||||||||||||||||||||||
The data collection methods vary depending on the type of source data. The survey/census data are normally collected directly from farmers. When statistics are collected from an already existing administrative register, the contact to the farmer has already been established by the register holder. The expert estimates are collected from a limited number of experts, who are normally not farmers but experts working in the field of agriculture (in public administration, research institutes or companies). SurveysThe methods for collecting the data directly from farmers vary between countries. In most of the surveys, several data collection methods are in use. Electronic questionnaire filled in by the respondents is most widely used (36%), and together with telephone interview with electronic questionnaire (18%), on-line methods are used for 54% of surveys (52% in 2016). The share of postal questionnaires is 23%. Face-to-face interviews are used in 9% of the surveys/censuses.
Figure 3.3.1 - Data collection methods for surveys Administrative data sourcesAdministrative data is used in 24 countries. The most common administrative source, used in 16 countries, is IACS (Integrated Administration and Control System) linked to the Common Agricultural Policy. IACS is used directly for area estimates, for data validation or sampling frames. Vineyard registers are used in several wine growing countries. In addition, there are registers on specific crops (e.g. orchards, rice, sugar beet and hops).
Table 3.3.1: Administrative data sources
Expert estimatesExpert estimates are utilised as data sources for Annual crop statistics in 21 countries. They are especially used for producing early estimates and forecasts (area and yield/production). In most cases they complement other data sources such as surveys and/or administrative data. Estimates are produced by agronomical experts, often working in governmental agricultural/statistical organisations, industry and marketing associations or producer organisations. Reliability of estimates is checked by comparison to previous year’s data, survey data, administrative data, comparing forecasts to final results from other sources. Even though expert estimates in general are seen as being of good quality and important in complementing data from other sources, some countries mention as possible limitations subjectivity factor, low number of experts for certain crops/regions and less reliable information for minor crops. The national quality report section 3.3 provides more information on expert estimates. |
||||||||||||||||||||||||||||||||||||||||||||||||||
| 3.4. Data validation | ||||||||||||||||||||||||||||||||||||||||||||||||||
To ensure statistical data quality, data validation procedures are in place in all countries. Consistency, completeness and possible outliers are verified and consistency of aggregates is checked. 20 countries reported to proceed with both manual and automatic data validation; three countries (DE, MT, PL) mentioned they have fully automated validation in place. Six countries (BG, EL, IT, LU, SI, IS) stated that the data validation was manual. Eighty percent of the countries cross-validate the data against other datasets; mainly previous results, administrative sources, census or survey data. |
||||||||||||||||||||||||||||||||||||||||||||||||||
| 3.5. Data compilation | ||||||||||||||||||||||||||||||||||||||||||||||||||
Not relevant |
||||||||||||||||||||||||||||||||||||||||||||||||||
| 3.6. Adjustment | ||||||||||||||||||||||||||||||||||||||||||||||||||
Not relevant |
||||||||||||||||||||||||||||||||||||||||||||||||||


|
||||||||||||||||||||||||||||||||||||||||||||
| 4.1. Quality assurance | ||||||||||||||||||||||||||||||||||||||||||||
See point 4.2. |
||||||||||||||||||||||||||||||||||||||||||||
| 4.2. Quality management - assessment | ||||||||||||||||||||||||||||||||||||||||||||
Quality management covers systems and frameworks in place to manage the quality of statistical products and processes. Quality management process is in place for crop statistics in 60% of the countries, and one or several quality reports covering different data collections are available in half of the countries. Denmark and Austria have carried out a peer review on Crop statistics. Two thirds of the countries stated that the overall quality of the Annual crop statistics has remained stable since the 2016 quality report. Improvements are reported by one third of the countries.
Figure 4.2.1 - Quality developments since 2016
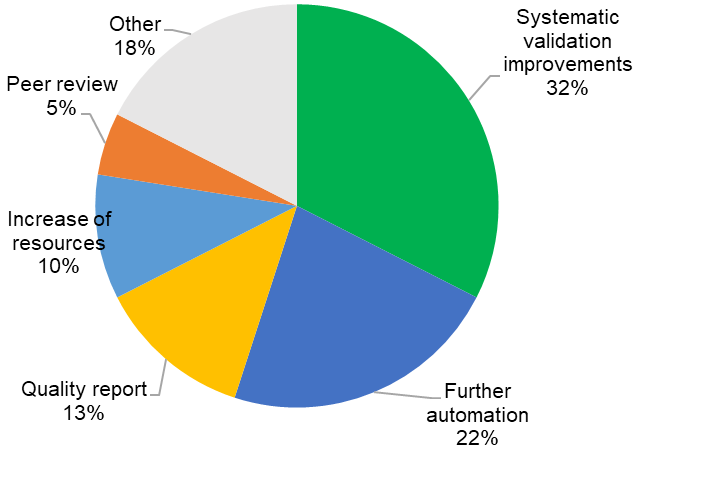
Quality improvement measures planned for the next three years include as main steps validation improvements and further automatisation. Five countries plan to produce quality reports.
Figure 4.2.2 - Quality measures planned for the next 3 years
Table 4.2.1 Quality improvement measures planned for the next 3 years
|
||||||||||||||||||||||||||||||||||||||||||||

|
||||||||||||||||||||||||||
See points 5.1, 5.2 and 5.3. |
||||||||||||||||||||||||||
| 5.1. Relevance - User Needs | ||||||||||||||||||||||||||
Regulation (EU) No 543/2009, as amended by Commission Delegated Regulation (EU) 2015/1557, and the ESS agreement on annual crop statistics (additional crop variables and early estimates) seem to meet relatively well the national needs. However, 12 countries pointed out that there are national needs for which some additional data are collected (Table 5.1.1).
Table 5.1.1: Additional data collected for Annual crop statistics
Six countries reported that they are aware of some user needs not met: for BG, AT and SE more regional data is asked, IT mentions demand for crops reported in aggregated items or crops not detected (eg. truffles), SI data on energy crops and IS more accurate area data. |
||||||||||||||||||||||||||
| 5.2. Relevance - User Satisfaction | ||||||||||||||||||||||||||
Forty percent of the countries have carried out a specific user satisfaction survey, and the results show that users are mostly satisfied with the available data. Regional data and earlier dissemination were mentioned as shortcomings of the current data availability. Several countries mentioned that even though no formal user satisfaction survey has been carried out, feedback from the key users is gathered through meetings and regular contacts. Positive feedback from experts, high visibility of the statistics in publications, studies and seminars were also mentioned as a proof of high satisfaction of users. |
||||||||||||||||||||||||||
| 5.3. Completeness | ||||||||||||||||||||||||||
The large majority of the countries delivered all requested data. In case values for a certain crop item are very small, countries are not obliged to deliver these data. In some countries data for a few crop items have not been collected. |
||||||||||||||||||||||||||
| 5.3.1. Data completeness - rate | ||||||||||||||||||||||||||
Not relevant |
||||||||||||||||||||||||||
|
||||||||||||||||||||||||||||||||||||||||||||||||||||||||||||||||||||||||||||||||||||||||||||||||||||||||||||||||||||||||||||||||||||||||||||||||||||||||||||||||||||||||||||||||||||||||||||||||||||||||||||||||||||||||||||||||||||||||||||||||||||||||||||||||||||||||||||||||||||||||||||||||||||||||||||||||||||||||||||||||||||||||||||||||||||||||||||||||||||||||||||||||||||||||||||||||||||||||||||||||||||||||||||||||||||||||||||||||||||||||||||||||||||||||||||||||||||||||||||||||||||||||||||||||
See points 6.2, 6.3.1, 6.3.2 and 6.3.3 |
||||||||||||||||||||||||||||||||||||||||||||||||||||||||||||||||||||||||||||||||||||||||||||||||||||||||||||||||||||||||||||||||||||||||||||||||||||||||||||||||||||||||||||||||||||||||||||||||||||||||||||||||||||||||||||||||||||||||||||||||||||||||||||||||||||||||||||||||||||||||||||||||||||||||||||||||||||||||||||||||||||||||||||||||||||||||||||||||||||||||||||||||||||||||||||||||||||||||||||||||||||||||||||||||||||||||||||||||||||||||||||||||||||||||||||||||||||||||||||||||||||||||||||||||
| 6.1. Accuracy - overall | ||||||||||||||||||||||||||||||||||||||||||||||||||||||||||||||||||||||||||||||||||||||||||||||||||||||||||||||||||||||||||||||||||||||||||||||||||||||||||||||||||||||||||||||||||||||||||||||||||||||||||||||||||||||||||||||||||||||||||||||||||||||||||||||||||||||||||||||||||||||||||||||||||||||||||||||||||||||||||||||||||||||||||||||||||||||||||||||||||||||||||||||||||||||||||||||||||||||||||||||||||||||||||||||||||||||||||||||||||||||||||||||||||||||||||||||||||||||||||||||||||||||||||||||||
The analysis of the accuracy and reliability takes into account the analysis of the sampling and non-sampling errors. Non-sampling errors are further broken down into coverage error, measurement error and non-response error. Regulation (EC) No 543/2009 sets two accuracy and reliability requirements. The precision requirement (Article 5) sets the 3% limit for the coefficient of variation (CV) for the final data for area under cultivation for each of the following groups of main crops: cereals for the production of grain, dry pulses and protein crops for the production of grain, root crops, industrial crops and plants harvested green. The representativeness requirement is put at 95% for each table of the Regulation (area of main arable crops, vegetables, melons and strawberries, permanent crops and total utilised agricultural area) (Article 3). |
||||||||||||||||||||||||||||||||||||||||||||||||||||||||||||||||||||||||||||||||||||||||||||||||||||||||||||||||||||||||||||||||||||||||||||||||||||||||||||||||||||||||||||||||||||||||||||||||||||||||||||||||||||||||||||||||||||||||||||||||||||||||||||||||||||||||||||||||||||||||||||||||||||||||||||||||||||||||||||||||||||||||||||||||||||||||||||||||||||||||||||||||||||||||||||||||||||||||||||||||||||||||||||||||||||||||||||||||||||||||||||||||||||||||||||||||||||||||||||||||||||||||||||||||
| 6.2. Sampling error | ||||||||||||||||||||||||||||||||||||||||||||||||||||||||||||||||||||||||||||||||||||||||||||||||||||||||||||||||||||||||||||||||||||||||||||||||||||||||||||||||||||||||||||||||||||||||||||||||||||||||||||||||||||||||||||||||||||||||||||||||||||||||||||||||||||||||||||||||||||||||||||||||||||||||||||||||||||||||||||||||||||||||||||||||||||||||||||||||||||||||||||||||||||||||||||||||||||||||||||||||||||||||||||||||||||||||||||||||||||||||||||||||||||||||||||||||||||||||||||||||||||||||||||||||
The countries reported the coefficient of variation for 45 surveys. The summary results for arable crop items are in Table 6.2.1. If several CVs were reported for the same crop, the lowest one is included. When interpreting the CVs in the table and in the national quality reports it should be noted be that the annual crop statistics are in most cases a combination of survey data, administrative data and expert estimates. Surveys might cover early estimates or final data and area, production and/or yield data. Therefore, the CVs give only a partial picture of the data quality and might not be fully comparable. Missing CVs for several countries are because area data comes from administrative sources (IACS).
Table 6.2.1: Lowest reported survey CV per crop aggregate
The national quality report section 6.2 provides more information on sampling errors. |
||||||||||||||||||||||||||||||||||||||||||||||||||||||||||||||||||||||||||||||||||||||||||||||||||||||||||||||||||||||||||||||||||||||||||||||||||||||||||||||||||||||||||||||||||||||||||||||||||||||||||||||||||||||||||||||||||||||||||||||||||||||||||||||||||||||||||||||||||||||||||||||||||||||||||||||||||||||||||||||||||||||||||||||||||||||||||||||||||||||||||||||||||||||||||||||||||||||||||||||||||||||||||||||||||||||||||||||||||||||||||||||||||||||||||||||||||||||||||||||||||||||||||||||||
| 6.2.1. Sampling error - indicators | ||||||||||||||||||||||||||||||||||||||||||||||||||||||||||||||||||||||||||||||||||||||||||||||||||||||||||||||||||||||||||||||||||||||||||||||||||||||||||||||||||||||||||||||||||||||||||||||||||||||||||||||||||||||||||||||||||||||||||||||||||||||||||||||||||||||||||||||||||||||||||||||||||||||||||||||||||||||||||||||||||||||||||||||||||||||||||||||||||||||||||||||||||||||||||||||||||||||||||||||||||||||||||||||||||||||||||||||||||||||||||||||||||||||||||||||||||||||||||||||||||||||||||||||||
Not relevant |
||||||||||||||||||||||||||||||||||||||||||||||||||||||||||||||||||||||||||||||||||||||||||||||||||||||||||||||||||||||||||||||||||||||||||||||||||||||||||||||||||||||||||||||||||||||||||||||||||||||||||||||||||||||||||||||||||||||||||||||||||||||||||||||||||||||||||||||||||||||||||||||||||||||||||||||||||||||||||||||||||||||||||||||||||||||||||||||||||||||||||||||||||||||||||||||||||||||||||||||||||||||||||||||||||||||||||||||||||||||||||||||||||||||||||||||||||||||||||||||||||||||||||||||||
| 6.3. Non-sampling error | ||||||||||||||||||||||||||||||||||||||||||||||||||||||||||||||||||||||||||||||||||||||||||||||||||||||||||||||||||||||||||||||||||||||||||||||||||||||||||||||||||||||||||||||||||||||||||||||||||||||||||||||||||||||||||||||||||||||||||||||||||||||||||||||||||||||||||||||||||||||||||||||||||||||||||||||||||||||||||||||||||||||||||||||||||||||||||||||||||||||||||||||||||||||||||||||||||||||||||||||||||||||||||||||||||||||||||||||||||||||||||||||||||||||||||||||||||||||||||||||||||||||||||||||||
See the sub-points. |
||||||||||||||||||||||||||||||||||||||||||||||||||||||||||||||||||||||||||||||||||||||||||||||||||||||||||||||||||||||||||||||||||||||||||||||||||||||||||||||||||||||||||||||||||||||||||||||||||||||||||||||||||||||||||||||||||||||||||||||||||||||||||||||||||||||||||||||||||||||||||||||||||||||||||||||||||||||||||||||||||||||||||||||||||||||||||||||||||||||||||||||||||||||||||||||||||||||||||||||||||||||||||||||||||||||||||||||||||||||||||||||||||||||||||||||||||||||||||||||||||||||||||||||||
| 6.3.1. Coverage error | ||||||||||||||||||||||||||||||||||||||||||||||||||||||||||||||||||||||||||||||||||||||||||||||||||||||||||||||||||||||||||||||||||||||||||||||||||||||||||||||||||||||||||||||||||||||||||||||||||||||||||||||||||||||||||||||||||||||||||||||||||||||||||||||||||||||||||||||||||||||||||||||||||||||||||||||||||||||||||||||||||||||||||||||||||||||||||||||||||||||||||||||||||||||||||||||||||||||||||||||||||||||||||||||||||||||||||||||||||||||||||||||||||||||||||||||||||||||||||||||||||||||||||||||||
A coverage error is due to a divergence between the survey population and the target population resulting from an imperfect frame. Target population units might not be accessible via the survey (under-coverage) or the frame includes units, which do not belong to the target population (over-coverage). In addition, misclassification and contact errors are possible reasons for coverage errors. In most cases, countries report that the degree of bias caused by coverage errors is low or negligible. Regular updates of registers, use of administrative data to identify unknown holdings, comparisons with other administrative sources and information received during survey interviews were used to tackle the coverage issues, and small biases were identified and treated. The national quality report section 6.3.1 provides more information on coverage errors. |
||||||||||||||||||||||||||||||||||||||||||||||||||||||||||||||||||||||||||||||||||||||||||||||||||||||||||||||||||||||||||||||||||||||||||||||||||||||||||||||||||||||||||||||||||||||||||||||||||||||||||||||||||||||||||||||||||||||||||||||||||||||||||||||||||||||||||||||||||||||||||||||||||||||||||||||||||||||||||||||||||||||||||||||||||||||||||||||||||||||||||||||||||||||||||||||||||||||||||||||||||||||||||||||||||||||||||||||||||||||||||||||||||||||||||||||||||||||||||||||||||||||||||||||||
| 6.3.1.1. Over-coverage - rate | ||||||||||||||||||||||||||||||||||||||||||||||||||||||||||||||||||||||||||||||||||||||||||||||||||||||||||||||||||||||||||||||||||||||||||||||||||||||||||||||||||||||||||||||||||||||||||||||||||||||||||||||||||||||||||||||||||||||||||||||||||||||||||||||||||||||||||||||||||||||||||||||||||||||||||||||||||||||||||||||||||||||||||||||||||||||||||||||||||||||||||||||||||||||||||||||||||||||||||||||||||||||||||||||||||||||||||||||||||||||||||||||||||||||||||||||||||||||||||||||||||||||||||||||||
Not relevant |
||||||||||||||||||||||||||||||||||||||||||||||||||||||||||||||||||||||||||||||||||||||||||||||||||||||||||||||||||||||||||||||||||||||||||||||||||||||||||||||||||||||||||||||||||||||||||||||||||||||||||||||||||||||||||||||||||||||||||||||||||||||||||||||||||||||||||||||||||||||||||||||||||||||||||||||||||||||||||||||||||||||||||||||||||||||||||||||||||||||||||||||||||||||||||||||||||||||||||||||||||||||||||||||||||||||||||||||||||||||||||||||||||||||||||||||||||||||||||||||||||||||||||||||||
| 6.3.1.2. Common units - proportion | ||||||||||||||||||||||||||||||||||||||||||||||||||||||||||||||||||||||||||||||||||||||||||||||||||||||||||||||||||||||||||||||||||||||||||||||||||||||||||||||||||||||||||||||||||||||||||||||||||||||||||||||||||||||||||||||||||||||||||||||||||||||||||||||||||||||||||||||||||||||||||||||||||||||||||||||||||||||||||||||||||||||||||||||||||||||||||||||||||||||||||||||||||||||||||||||||||||||||||||||||||||||||||||||||||||||||||||||||||||||||||||||||||||||||||||||||||||||||||||||||||||||||||||||||
Not relevant |
||||||||||||||||||||||||||||||||||||||||||||||||||||||||||||||||||||||||||||||||||||||||||||||||||||||||||||||||||||||||||||||||||||||||||||||||||||||||||||||||||||||||||||||||||||||||||||||||||||||||||||||||||||||||||||||||||||||||||||||||||||||||||||||||||||||||||||||||||||||||||||||||||||||||||||||||||||||||||||||||||||||||||||||||||||||||||||||||||||||||||||||||||||||||||||||||||||||||||||||||||||||||||||||||||||||||||||||||||||||||||||||||||||||||||||||||||||||||||||||||||||||||||||||||
| 6.3.2. Measurement error | ||||||||||||||||||||||||||||||||||||||||||||||||||||||||||||||||||||||||||||||||||||||||||||||||||||||||||||||||||||||||||||||||||||||||||||||||||||||||||||||||||||||||||||||||||||||||||||||||||||||||||||||||||||||||||||||||||||||||||||||||||||||||||||||||||||||||||||||||||||||||||||||||||||||||||||||||||||||||||||||||||||||||||||||||||||||||||||||||||||||||||||||||||||||||||||||||||||||||||||||||||||||||||||||||||||||||||||||||||||||||||||||||||||||||||||||||||||||||||||||||||||||||||||||||
The measurement error is an error that occurs during data collection and causes the recorded values of variables to be different from the true ones. Recording of wrong values can be linked to survey instruments (form, questionnaire), respondents or interviewer. Most of the annual crop statistics surveys have a long history with the same or slightly modified questionnaire and the questionnaires are based on usual concepts for respondents. The average number of years in questionnaires have been use is over 16 years (all surveys reported by all countries). In 75% of the surveys an electronic list of 'Frequently asked questions' and/or hotline is available for the respondents/surveyors. The use of prefilled questionnaires has increased and 11 countries use them for all or some of the surveys. Plausibility checks integrated in the questionnaires were used by several countries to reduce the measurement errors when respondents filled in the questionnaires. Other actions listed were comparison of data values with administrative sources, against results of previous years, training of interviewers, interview techniques, possible re-contacts of respondents and follow-up interviews. The national quality report section 6.3.2 provides more information on measurement errors. |
||||||||||||||||||||||||||||||||||||||||||||||||||||||||||||||||||||||||||||||||||||||||||||||||||||||||||||||||||||||||||||||||||||||||||||||||||||||||||||||||||||||||||||||||||||||||||||||||||||||||||||||||||||||||||||||||||||||||||||||||||||||||||||||||||||||||||||||||||||||||||||||||||||||||||||||||||||||||||||||||||||||||||||||||||||||||||||||||||||||||||||||||||||||||||||||||||||||||||||||||||||||||||||||||||||||||||||||||||||||||||||||||||||||||||||||||||||||||||||||||||||||||||||||||
| 6.3.3. Non response error | ||||||||||||||||||||||||||||||||||||||||||||||||||||||||||||||||||||||||||||||||||||||||||||||||||||||||||||||||||||||||||||||||||||||||||||||||||||||||||||||||||||||||||||||||||||||||||||||||||||||||||||||||||||||||||||||||||||||||||||||||||||||||||||||||||||||||||||||||||||||||||||||||||||||||||||||||||||||||||||||||||||||||||||||||||||||||||||||||||||||||||||||||||||||||||||||||||||||||||||||||||||||||||||||||||||||||||||||||||||||||||||||||||||||||||||||||||||||||||||||||||||||||||||||||
Non-response errors occur when the survey fails to get a response to one, or possibly all, of the questions. The unit level non-response rates vary between the countries and surveys (Table 6.3.3.1). The median non-response rate for all reported surveys is 2.7%, however, the variance is high; from 0% to 55% (one exceptionally high unit level non-response linked to COVID-19 situation).
Table 6.3.3.1: Unit level non-response rate for surveys (in %) (S1=Survey1 etc.)
Follow-up interviews and reminders are the most common measures utilised to reduce the unit non-response rate, followed by imputations and weighting.
Figure 6.3.3.1 - Actions taken to reduce the non-response rate/impact on data
|
||||||||||||||||||||||||||||||||||||||||||||||||||||||||||||||||||||||||||||||||||||||||||||||||||||||||||||||||||||||||||||||||||||||||||||||||||||||||||||||||||||||||||||||||||||||||||||||||||||||||||||||||||||||||||||||||||||||||||||||||||||||||||||||||||||||||||||||||||||||||||||||||||||||||||||||||||||||||||||||||||||||||||||||||||||||||||||||||||||||||||||||||||||||||||||||||||||||||||||||||||||||||||||||||||||||||||||||||||||||||||||||||||||||||||||||||||||||||||||||||||||||||||||||||
| 6.3.3.1. Unit non-response - rate | ||||||||||||||||||||||||||||||||||||||||||||||||||||||||||||||||||||||||||||||||||||||||||||||||||||||||||||||||||||||||||||||||||||||||||||||||||||||||||||||||||||||||||||||||||||||||||||||||||||||||||||||||||||||||||||||||||||||||||||||||||||||||||||||||||||||||||||||||||||||||||||||||||||||||||||||||||||||||||||||||||||||||||||||||||||||||||||||||||||||||||||||||||||||||||||||||||||||||||||||||||||||||||||||||||||||||||||||||||||||||||||||||||||||||||||||||||||||||||||||||||||||||||||||||
See 6.3.3 |
||||||||||||||||||||||||||||||||||||||||||||||||||||||||||||||||||||||||||||||||||||||||||||||||||||||||||||||||||||||||||||||||||||||||||||||||||||||||||||||||||||||||||||||||||||||||||||||||||||||||||||||||||||||||||||||||||||||||||||||||||||||||||||||||||||||||||||||||||||||||||||||||||||||||||||||||||||||||||||||||||||||||||||||||||||||||||||||||||||||||||||||||||||||||||||||||||||||||||||||||||||||||||||||||||||||||||||||||||||||||||||||||||||||||||||||||||||||||||||||||||||||||||||||||
| 6.3.3.2. Item non-response - rate | ||||||||||||||||||||||||||||||||||||||||||||||||||||||||||||||||||||||||||||||||||||||||||||||||||||||||||||||||||||||||||||||||||||||||||||||||||||||||||||||||||||||||||||||||||||||||||||||||||||||||||||||||||||||||||||||||||||||||||||||||||||||||||||||||||||||||||||||||||||||||||||||||||||||||||||||||||||||||||||||||||||||||||||||||||||||||||||||||||||||||||||||||||||||||||||||||||||||||||||||||||||||||||||||||||||||||||||||||||||||||||||||||||||||||||||||||||||||||||||||||||||||||||||||||
See 6.3.3 |
||||||||||||||||||||||||||||||||||||||||||||||||||||||||||||||||||||||||||||||||||||||||||||||||||||||||||||||||||||||||||||||||||||||||||||||||||||||||||||||||||||||||||||||||||||||||||||||||||||||||||||||||||||||||||||||||||||||||||||||||||||||||||||||||||||||||||||||||||||||||||||||||||||||||||||||||||||||||||||||||||||||||||||||||||||||||||||||||||||||||||||||||||||||||||||||||||||||||||||||||||||||||||||||||||||||||||||||||||||||||||||||||||||||||||||||||||||||||||||||||||||||||||||||||
| 6.3.4. Processing error | ||||||||||||||||||||||||||||||||||||||||||||||||||||||||||||||||||||||||||||||||||||||||||||||||||||||||||||||||||||||||||||||||||||||||||||||||||||||||||||||||||||||||||||||||||||||||||||||||||||||||||||||||||||||||||||||||||||||||||||||||||||||||||||||||||||||||||||||||||||||||||||||||||||||||||||||||||||||||||||||||||||||||||||||||||||||||||||||||||||||||||||||||||||||||||||||||||||||||||||||||||||||||||||||||||||||||||||||||||||||||||||||||||||||||||||||||||||||||||||||||||||||||||||||||
Not relevant |
||||||||||||||||||||||||||||||||||||||||||||||||||||||||||||||||||||||||||||||||||||||||||||||||||||||||||||||||||||||||||||||||||||||||||||||||||||||||||||||||||||||||||||||||||||||||||||||||||||||||||||||||||||||||||||||||||||||||||||||||||||||||||||||||||||||||||||||||||||||||||||||||||||||||||||||||||||||||||||||||||||||||||||||||||||||||||||||||||||||||||||||||||||||||||||||||||||||||||||||||||||||||||||||||||||||||||||||||||||||||||||||||||||||||||||||||||||||||||||||||||||||||||||||||
| 6.3.4.1. Imputation - rate | ||||||||||||||||||||||||||||||||||||||||||||||||||||||||||||||||||||||||||||||||||||||||||||||||||||||||||||||||||||||||||||||||||||||||||||||||||||||||||||||||||||||||||||||||||||||||||||||||||||||||||||||||||||||||||||||||||||||||||||||||||||||||||||||||||||||||||||||||||||||||||||||||||||||||||||||||||||||||||||||||||||||||||||||||||||||||||||||||||||||||||||||||||||||||||||||||||||||||||||||||||||||||||||||||||||||||||||||||||||||||||||||||||||||||||||||||||||||||||||||||||||||||||||||||
Not relevant |
||||||||||||||||||||||||||||||||||||||||||||||||||||||||||||||||||||||||||||||||||||||||||||||||||||||||||||||||||||||||||||||||||||||||||||||||||||||||||||||||||||||||||||||||||||||||||||||||||||||||||||||||||||||||||||||||||||||||||||||||||||||||||||||||||||||||||||||||||||||||||||||||||||||||||||||||||||||||||||||||||||||||||||||||||||||||||||||||||||||||||||||||||||||||||||||||||||||||||||||||||||||||||||||||||||||||||||||||||||||||||||||||||||||||||||||||||||||||||||||||||||||||||||||||
| 6.3.5. Model assumption error | ||||||||||||||||||||||||||||||||||||||||||||||||||||||||||||||||||||||||||||||||||||||||||||||||||||||||||||||||||||||||||||||||||||||||||||||||||||||||||||||||||||||||||||||||||||||||||||||||||||||||||||||||||||||||||||||||||||||||||||||||||||||||||||||||||||||||||||||||||||||||||||||||||||||||||||||||||||||||||||||||||||||||||||||||||||||||||||||||||||||||||||||||||||||||||||||||||||||||||||||||||||||||||||||||||||||||||||||||||||||||||||||||||||||||||||||||||||||||||||||||||||||||||||||||
Not relevant |
||||||||||||||||||||||||||||||||||||||||||||||||||||||||||||||||||||||||||||||||||||||||||||||||||||||||||||||||||||||||||||||||||||||||||||||||||||||||||||||||||||||||||||||||||||||||||||||||||||||||||||||||||||||||||||||||||||||||||||||||||||||||||||||||||||||||||||||||||||||||||||||||||||||||||||||||||||||||||||||||||||||||||||||||||||||||||||||||||||||||||||||||||||||||||||||||||||||||||||||||||||||||||||||||||||||||||||||||||||||||||||||||||||||||||||||||||||||||||||||||||||||||||||||||
| 6.4. Seasonal adjustment | ||||||||||||||||||||||||||||||||||||||||||||||||||||||||||||||||||||||||||||||||||||||||||||||||||||||||||||||||||||||||||||||||||||||||||||||||||||||||||||||||||||||||||||||||||||||||||||||||||||||||||||||||||||||||||||||||||||||||||||||||||||||||||||||||||||||||||||||||||||||||||||||||||||||||||||||||||||||||||||||||||||||||||||||||||||||||||||||||||||||||||||||||||||||||||||||||||||||||||||||||||||||||||||||||||||||||||||||||||||||||||||||||||||||||||||||||||||||||||||||||||||||||||||||||
Not relevant |
||||||||||||||||||||||||||||||||||||||||||||||||||||||||||||||||||||||||||||||||||||||||||||||||||||||||||||||||||||||||||||||||||||||||||||||||||||||||||||||||||||||||||||||||||||||||||||||||||||||||||||||||||||||||||||||||||||||||||||||||||||||||||||||||||||||||||||||||||||||||||||||||||||||||||||||||||||||||||||||||||||||||||||||||||||||||||||||||||||||||||||||||||||||||||||||||||||||||||||||||||||||||||||||||||||||||||||||||||||||||||||||||||||||||||||||||||||||||||||||||||||||||||||||||
| 6.5. Data revision - policy | ||||||||||||||||||||||||||||||||||||||||||||||||||||||||||||||||||||||||||||||||||||||||||||||||||||||||||||||||||||||||||||||||||||||||||||||||||||||||||||||||||||||||||||||||||||||||||||||||||||||||||||||||||||||||||||||||||||||||||||||||||||||||||||||||||||||||||||||||||||||||||||||||||||||||||||||||||||||||||||||||||||||||||||||||||||||||||||||||||||||||||||||||||||||||||||||||||||||||||||||||||||||||||||||||||||||||||||||||||||||||||||||||||||||||||||||||||||||||||||||||||||||||||||||||
Not relevant |
||||||||||||||||||||||||||||||||||||||||||||||||||||||||||||||||||||||||||||||||||||||||||||||||||||||||||||||||||||||||||||||||||||||||||||||||||||||||||||||||||||||||||||||||||||||||||||||||||||||||||||||||||||||||||||||||||||||||||||||||||||||||||||||||||||||||||||||||||||||||||||||||||||||||||||||||||||||||||||||||||||||||||||||||||||||||||||||||||||||||||||||||||||||||||||||||||||||||||||||||||||||||||||||||||||||||||||||||||||||||||||||||||||||||||||||||||||||||||||||||||||||||||||||||
| 6.6. Data revision - practice | ||||||||||||||||||||||||||||||||||||||||||||||||||||||||||||||||||||||||||||||||||||||||||||||||||||||||||||||||||||||||||||||||||||||||||||||||||||||||||||||||||||||||||||||||||||||||||||||||||||||||||||||||||||||||||||||||||||||||||||||||||||||||||||||||||||||||||||||||||||||||||||||||||||||||||||||||||||||||||||||||||||||||||||||||||||||||||||||||||||||||||||||||||||||||||||||||||||||||||||||||||||||||||||||||||||||||||||||||||||||||||||||||||||||||||||||||||||||||||||||||||||||||||||||||
Not relevant |
||||||||||||||||||||||||||||||||||||||||||||||||||||||||||||||||||||||||||||||||||||||||||||||||||||||||||||||||||||||||||||||||||||||||||||||||||||||||||||||||||||||||||||||||||||||||||||||||||||||||||||||||||||||||||||||||||||||||||||||||||||||||||||||||||||||||||||||||||||||||||||||||||||||||||||||||||||||||||||||||||||||||||||||||||||||||||||||||||||||||||||||||||||||||||||||||||||||||||||||||||||||||||||||||||||||||||||||||||||||||||||||||||||||||||||||||||||||||||||||||||||||||||||||||
| 6.6.1. Data revision - average size | ||||||||||||||||||||||||||||||||||||||||||||||||||||||||||||||||||||||||||||||||||||||||||||||||||||||||||||||||||||||||||||||||||||||||||||||||||||||||||||||||||||||||||||||||||||||||||||||||||||||||||||||||||||||||||||||||||||||||||||||||||||||||||||||||||||||||||||||||||||||||||||||||||||||||||||||||||||||||||||||||||||||||||||||||||||||||||||||||||||||||||||||||||||||||||||||||||||||||||||||||||||||||||||||||||||||||||||||||||||||||||||||||||||||||||||||||||||||||||||||||||||||||||||||||
Not relevant |
||||||||||||||||||||||||||||||||||||||||||||||||||||||||||||||||||||||||||||||||||||||||||||||||||||||||||||||||||||||||||||||||||||||||||||||||||||||||||||||||||||||||||||||||||||||||||||||||||||||||||||||||||||||||||||||||||||||||||||||||||||||||||||||||||||||||||||||||||||||||||||||||||||||||||||||||||||||||||||||||||||||||||||||||||||||||||||||||||||||||||||||||||||||||||||||||||||||||||||||||||||||||||||||||||||||||||||||||||||||||||||||||||||||||||||||||||||||||||||||||||||||||||||||||

|
|||
| 7.1. Timeliness | |||
Regulation (EC) No 543/2009, as amended by Commission Delegated Regulation (EU) 2015/1557, and ESS agreement on Annual crop statistics set up the data transmission calendar per year. The maximum number of required data transmissions for cereals and oilseeds is 10, for dry pulses, root crops, industrial crops and plants harvested green from arable land 8, for vegetables 3 and for permanent crops 4. Several of these data transmissions are forecasts, taking place during the reference year and before the harvest. For cereals, countries report between 0 and 15 data releases (4.7 in average), of which most are forecasts, i.e. releases during the crop year. The timeliness of first data publication varies between December 2018 (winter crop areas; ES, PT, LT) to February 2020 (for countries that only have one data release after the crop year). The final results for cereals for crop year 2019 were in most of the countries released before July 2020; however for some countries it will take until summer 2021 to publish the final data. |
|||
| 7.1.1. Time lag - first result | |||
Not relevant |
|||
| 7.1.2. Time lag - final result | |||
Not relevant |
|||
| 7.2. Punctuality | |||
The punctuality refers to the time lag between the actual delivery of the data and the target date when it should have been delivered (legal deadline). Punctuality of the data transmissions is assessed by Eurostat on the basis of received transmissions via EDAMIS. Overall punctuality has improved since 2016, and for reference year 2019 data delays occurred mainly within the year. At the final deadline (30 September 2020) almost all data had been delivered. |
|||
| 7.2.1. Punctuality - delivery and publication | |||
See 7.2 |
|||
|
|||
| 8.1. Comparability - geographical | |||
Not relevant |
|||
| 8.1.1. Asymmetry for mirror flow statistics - coefficient | |||
Not relevant |
|||
| 8.2. Comparability - over time | |||
The comparability of the Annual crop statistics data over time is relatively good, in particular from 2010 onwards with Regulation (EC) No 543/2009, and since 2015 when Commission Delegated Regulation (EU) 2015/1557 amending Regulation (EC) No 543/2009 have been in force. Only Spain and Czechia reported about high or moderate breaks in the time series since 2016. For Spain these included a few breaks for individual crop items, for Czechia mainly breaks in time series in some Vegetable and Permanent crops classes, related to new data collection since 2018, and in area definition for vegetables (harvested area since 2018). |
|||
| 8.2.1. Length of comparable time series | |||
NA |
|||
| 8.3. Coherence - cross domain | |||
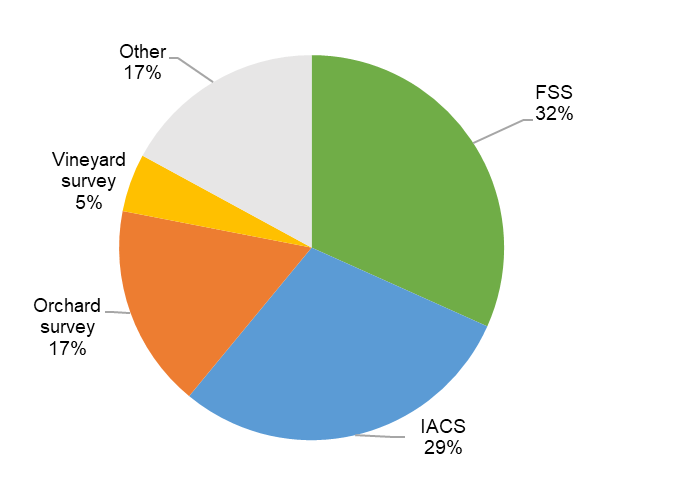
Cross-domain coherence refers to the consistency of outputs produced by different statistical processes within the country. Annual crop statistics can be compared with other relevant national data collections (FSS/IFS, Orchard survey, IACS, others). However, full comparison and consistency is in most cases not possible due to different reference periods and/or differences in methodology. Figure 8.3.1 shows the main statistical sources to which data has been compared.
Figure 8.3.1 - Cross-domain comparisons
Other data sources used for comparison were for example: DE: Employer's liability insurance coverage Several countries mentioned that data collections and sources are interconnected and already used as a basic source for annual crop statistics (for example IACS), and therefore no cross-domain comparisons were made. In addition, the lack of production data in other sources was mentioned as a limitation for comparisons. |
|||
| 8.4. Coherence - sub annual and annual statistics | |||
Not relevant |
|||
| 8.5. Coherence - National Accounts | |||
Not relevant |
|||
| 8.6. Coherence - internal | |||
Not relevant |
|||
|
|||||||||||||||
Accessibility and clarity cover the conditions and modalities by which users can access, use and interpret data. They are assessed by the dissemination formats (news releases, publications, online database) and documentation on methodology.
Table 9.1: Accessibility – dissemination formats
|
|||||||||||||||
| 9.1. Dissemination format - News release | |||||||||||||||
See point 9. |
|||||||||||||||
| 9.2. Dissemination format - Publications | |||||||||||||||
See point 9. |
|||||||||||||||
| 9.3. Dissemination format - online database | |||||||||||||||
See point 9. |
|||||||||||||||
| 9.3.1. Data tables - consultations | |||||||||||||||
Not relevant |
|||||||||||||||
| 9.4. Dissemination format - microdata access | |||||||||||||||
Not relevant |
|||||||||||||||
| 9.5. Dissemination format - other | |||||||||||||||
See point 9. |
|||||||||||||||
| 9.6. Documentation on methodology | |||||||||||||||
The availability of documentation on methodology has remained stable since the previous quality reporting round, and most countries make available to the data users metadata, quality reports, methodological report and/or information on definitions and classifications.
Table 9.6.1: Availability of documentation on methodology
|
|||||||||||||||
| 9.7. Quality management - documentation | |||||||||||||||
See point 9.6. |
|||||||||||||||
| 9.7.1. Metadata completeness - rate | |||||||||||||||
Not relevant |
|||||||||||||||
| 9.7.2. Metadata - consultations | |||||||||||||||
Not relevant |
|||||||||||||||
|
|||
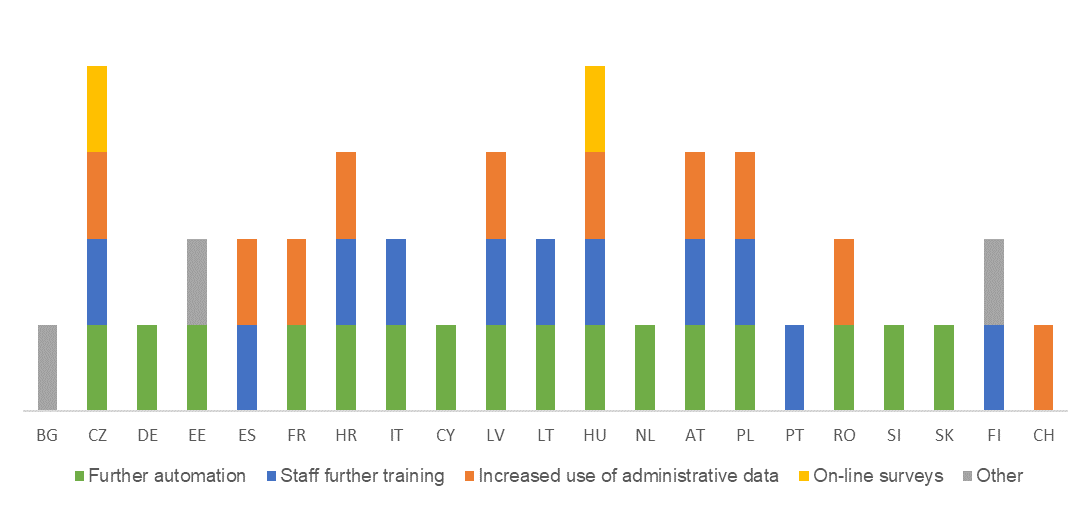
Most countries reported to have efficiency gains since 2016. Further automation and/or staff further training were mentioned by 19 countries as steps taken in order to increase the efficiency. Ten countries have increased the use of administrative data sources.
Figure 10.1 - Efficiency gains since 2016
Figure 10.2 - Efficiency gains by country
Several countries pointed out other/additional efficiency gains: DE: More efficient process of data acquisition
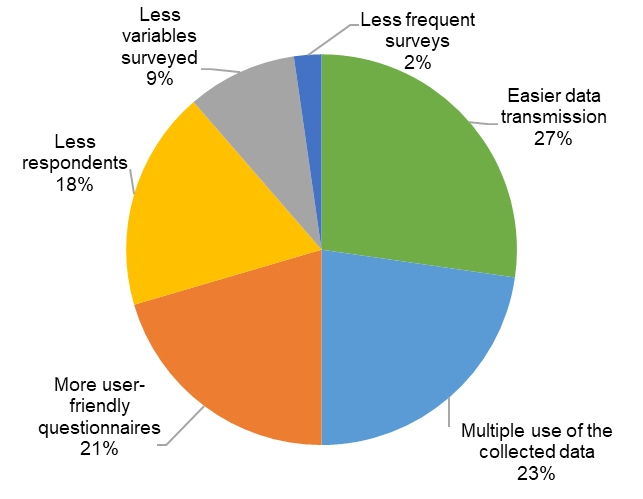
Measures taken to reduce the burden to respondents have been implemented by 19 countries since the previous quality reporting round. Easier data transmission, multiple use of the collected data and more user-friendly questionnaires were the most common measures taken. Some countries mentioned also reduction in sample size.
Figure 10.3 - Burden reduction measures
|
|||

|
|||
Normally crop statistics data are not confidential at national level as they are aggregated. |
|||
| 11.1. Confidentiality - policy | |||
Not relevant |
|||
| 11.2. Confidentiality - data treatment | |||
Not relevant |
|||
|
|||
Not applicable |
|||
|
|||
|
|||
| ACS handbook |
|||