Crop balance sheets (apro_cbs)

National Reference Metadata in ESS Standard for Crops Balance Sheet Quality Reports Structure (esqrsbs)

Compiling agency: Statistics Poland


Eurostat metadata
Reference metadata
1. Contact
2. Statistical presentation
3. Statistical processing
4. Quality management
5. Relevance
6. Accuracy and reliability
7. Timeliness and punctuality
8. Coherence and comparability
9. Accessibility and clarity
10. Cost and Burden
11. Confidentiality
12. Comment
Related Metadata
Annexes (including footnotes)


For any question on data and metadata, please contact: Eurostat user support

Download


1. Contact Top
1.1. Contact organisation

Statistics Poland

1.2. Contact organisation unit

Balances and Economic Accounts in Agriculture Unit

1.5. Contact mail address

00-925 Warszawa, Al. Niepodległości 208, Poland


2. Statistical presentation Top
2.1. Data description

Main characteristics

2.1.1. Describe shortly the main characteristics of the statistics  

Crop Balances for cereals cover supply and use of the main cereals (common wheat & spelt, durum wheat, barley and grain maize & corn-cob-mix) and main oilseeds.


Reference period

2.1.2. Reference period of the data collection 

2020

2.1.3. Is the reference period based on the calendar year starting January 1st and ending December 31st?

Yes

2.1.4. If No, please specify


National legislation

2.1.5. Is there a national legislation covering these statistics? 

Yes

If Yes, please answer all the following questions. 

2.1.6. Name of the national legislation 

Law of 29 June 1995 on Public Statistics

Statistical Surveys Program of Official Statistics for each following year introduced by Regulation of the Council of Ministers and published in Journal of Laws

2.1.7. Link to the national legislation 

The Law on public statistics:

https://bip.stat.gov.pl/en/law/law-on-public-statistics/

Regulation of the Council of Ministers concerning the Statistical Surveys Program for 2017

http://prawo.sejm.gov.pl/isap.nsf/DocDetails.xsp?id=WDU20160001426

Regulation of the Council of Ministers concerning the Statistical Surveys Program for 2018

http://prawo.sejm.gov.pl/isap.nsf/DocDetails.xsp?id=WDU20170002471

Regulation of the Council of Ministers concerning the Statistical Surveys Program for 2019

http://prawo.sejm.gov.pl/isap.nsf/DocDetails.xsp?id=WDU20180002103

Regulation of the Council of Ministers concerning the Statistical Surveys Program for 2020

http://isap.sejm.gov.pl/isap.nsf/DocDetails.xsp?id=WDU20190002366


2.1.8. Responsible organisation for the national legislation 

Polish Parliament

2.1.9. Year of entry into force of the national legislation 

The present statistical law on statistics came into force in 1995 (with further amendments).

2.1.10. Please indicate which variables required under EU legislation are not covered by national legislation, if any?

There is full coverage of variables required under EU regulation. In addition Poland is preparing balance sheets for national purposes for other crops and agricultural products.

2.1.11. Please indicate which national definitions differ from those in the EU legislation, if any?

There are no differences in definitions

2.1.12. Is there a legal obligation for respondents to reply?

Yes


Additional comments on data description

Statistical surveys involving natural persons, except for censuses, shall be conducted on a voluntary basis.  Conducting of a census which imposes the obligation to provide information on natural persons shall require a separate law.

The procedure for imposing responsibilities related to statistical surveys other than census, shall be determined by Law of Official Statistics.

2.2. Classification system

The classification system is described in the handbook.

For each agricultural commodity the final crop balance sheet has in principle the same structure.

Supply = Opening stock (1st January) + Usable Production + Imports

Use = Domestic + Exports + Closing stock (31st December)

Combined Nomenclature CN, Polish Classification of Activities (Polish abbreviation PKD), Polish Classification of Products and Services (Polish abbreviation PKWiU).

For a balance sheet 'supply' equals 'use'. Related to terminology it should be mentioned that in publications sometimes for 'use' also 'demand' is used. 'Change in stocks' corresponds to the difference between closing stocks and opening stocks.

2.3. Coverage - sector

Main cereals and oilseeds

2.4. Statistical concepts and definitions

Statistical concepts and definitions are described in the Eurostat handbook.

2.5. Statistical unit

The whole chain from farms to users (including traders, people in charge of stocks, a.s.o)

2.6. Statistical population

Whole country - Poland. Balances are made for the country level, based on the results of a number of statistical surveys.

2.7. Reference area

2.7.1 Geographical area covered

The entire territory of the country.

Total area of Poland (as of 31. XII. 2021)  is  312 696 km2

2.7.2 Which special Member State territories are included?

The entire territory of the country.

2.8. Coverage - Time

Calendar year 2019 and 2020

2.9. Base period

Not applicable


3. Statistical processing Top

Data from primary surveys (crops, sown area, stocks at producers, traders and in agriculture as well as data on industrial production and processing, feed production) are not subject to processing. However, foreign trade data is processed by conversion into grain using conversion factors.

3.1. Source data

Data source details


Crop statistics

Trade statistics

Stock estimates

Domestic use estimates

Census


Sample Survey

Sample Survey on land use, sown area and harvests

Sample Survey on yields of cereals and rape in private farms

Sample Survey on selected agricultural crops in private farms

Sample Survey on winter cereals in private farms


Household budgets surveys

Procurement of major agricultural products – volume and value (monthly and semi-annual reports)

On the basis of data on the procurement of seed and sale of feed, the amount of grain intended  for animals is estimated.

Losses in farms, seed are based on agriculture surveys and experts analysis. 

Administrive data source


Data on export/import of agricultural products from the Ministry of Finance 


Material reserves Agency - management of strategic reserves, among others grains and cereal products


Agro-economic model


Expert Estimates

Sample survey on yields and production of cereals and rape and turnip rape (August)

sample survey on selected crops (October)


Local experts estimates on crops’ stocks on farms aggregated and provided to statistics by voivodships


Other sources


Obligatory surveys = statistical reporting system

Monthly report on production and stocks - from entities conducting activities classified according to Polish Classification of Activities (PKD)

Yearly report on production  from entities employing 10 and more persons; producing products covered by the "PRODPOL"  list


Census

These questions only apply to censuses. If there is more than one census, please describe the main census below and the additional ones in table 3.1 of the annexed Excel file 

3.1.2 Name/Title

3.1.3 Name of Organisation responsible

3.1.4 Main scope

3.1.5 List used to build the frame

3.1.6 Any possible threshold values

3.1.7 Population size

3.1.8 Additional comments


Sample Survey

These questions only apply to surveys. If there is more than one survey, please describe the main survey below and the additional ones in table 3.1 of the annexed Excel file 

3.1.9    Name/Title

Sample Survey on land use, sown area and harvests

3.1.10  Name of Organisation responsible

Statistics Poland

3.1.11  Main scope

Land use, sown area and harvests

3.1.12  List used to build the frame

Farm list

3.1.13  Any possible threshold values

Area of agricultural land above 1 ha; economic size at least 250 thousand euro

3.1.14  Population size

c.a. 1 576  thousand agricultural holdings

3.1.15  Sample size

60 thousand agricultural farms

3.1.16  Sampling basis

Restricted from publication

3.1.17  If Other, please specify

-

3.1.18  Type of sample design

Stratified

3.1.19 If Other, please specify

3.1.20 If Stratified, number of strata

Sample drawing was done with stratified sampling scheme, in

 individual voivodships according to the stratified and optimal    sampling scheme of Neyman.

 Population in each voivodship was divided into 10 strata (h = 01, 02, 03, ...  , 10), and the sample was simultaneously allocated between these strata.

3.1.21 If Stratified, stratification criteria

Unit size

3.1.22 If Other, please specify

3.1.23 Additional comments

3.1.16

Statistical Farm Register created on the basis of the results of Agricultural Census 2010

3.1.18

Sample drawing was done with stratified sampling scheme, in

 individual voivodships according to the stratified and optimal    sampling scheme of Neyman

3.1.21

(1) Area of agricultural land in good agricultural and environmental conditions and (2) economic size


Administrative source

These questions only apply to administrative sources. If there is more than one administrative source, please describe the main source below and the additional ones in table 3.1

3.1.24 Name/Title

Implementation of international trade in goods in valuable quantities

3.1.25 Name of Organisation responsible

Statistics Poland

3.1.26 Contact information (email and phone)

Mrs Julita Kapsa

j.kapsa@stat.gov.pl

phone:

+48 22 608 3321

3.1.27 Main administrative scope

Data is collected by the National Tax Administration, which is a part of the structures of the Ministry of Finance.

Data on foreign trade come from:

• From customs declarations for goods traded between non-EU countries;

• From the Intrastat declaration for goods traded with EU countries

• From alternative data sources for specific goods (natural gas, electricity, purchase / sale of board fish, ships and planes


The material scope includes goods classified in accordance with the eight-digit Combined Nomenclature


The subjective scope includes entities performing foreign trade exchange. There are statistical thresholds in the Intrastat system that limit the number of reporting agents.


3.1.28 Geospatial Coverage

National

3.1.29 Update frequency

Monthly

3.1.30 Legal basis

Regulation of the Council of Ministers regarding the program of statistical surveys of official statistics

Regulation (EC) No 638/2004 of the European Parliament and of the Council of 31 March 2004 on Community statistics relating to the trading of goods between Member States and repealing Council Regulation (EEC) No 3330/91

Regulation (EC) No 471/2009 of the European Parliament and of the Council of 6 May 2009 on Community statistics relating to external trade with non-member countries and repealing Council Regulation (EC) No 1172/95

The Act of 19 March 2004 Customs Law

Regulation of the Minister of Development and Finance of 15 February 2017 amending the regulation on INTRASTAT declarations (Journal of Laws of 2017, item 312 of February 21, 2017)

3.1.31 Are you able to access directly to the micro data?

No

3.1.32 Are you able to check the plausibility of the data, namely by contacting directly the units?

No

3.1.33 How would you assess the proximity of the definitions and concepts (including statistical units) used in the administrative source with those required in the EU regulation?

Very good

3.1.34 Please list the main differences between the administrative source and the statistical definitions and concepts

3.1.35 Is a different threshold used in the administrative source and statistical data?

No

3.1.36 If Yes, please specify

3.1.37 Additional comments

3.1.28

EU + third countries

Geographical breakdown is presented for:

• individual countries in accordance with the EU 'geonomenclature',

• groups of countries (developed, EU, euro area, OECD, EFTA, CEFTA, developing, Central and Eastern Europe

• continents


In connect to 3.1.29

According to the provisions in PBSSP

The set of data on foreign trade is an "open" set. This means that when publishing data for the reporting month, all data for previous months is corrected.

Data from foreign trade are available 70 days after the reporting period.


3.1.32

There is no direct contact, only by insitutions gathering data. In the case of Poland Chamber of Tax Administration in Szczecin for Intrastat and Analytical Center of the Chamber of Tax Administration in Warsaw for customs declarations.


Agro-economic model

 If there are different models used, please describe the main one below and the additional ones in table 3.1 of the annexed Excel file

3.1.38 Name/Title

3.1.39 Primary purpose

3.1.40 Legal basis

3.1.41 Update frequency

3.1.42 Expert data supplier

3.1.43 If Other, please specify

3.1.44 How would you assess the quality of those data?

3.1.45 Additional comments

Experts

If there is more than one Expert source, please describe the main one below and the additional ones in table 3.1 of the annexed Excel file 

3.1.46 Name/Title

Local experts in every gmina (LAU 4), Voivodship expert (NUTS2), Central Level Expert (separate for cereals, for rape, for potatoes, for sugar-beets)

3.1.47 Primary purpose

Providing information on the area of crops, general conditions of crops, expected yields and harvests

3.1.48 Legal basis

 Statistical Surveys Programme

3.1.49 Update frequency

Quarterly

3.1.50 Expert data supplier

Producer organisation
Scientific organisation
Other

3.1.51 If Other, please specify

3.1.52 How would you assess the quality of those data?

Very good

3.1.53 Additional comments

In to connect to 3.1.50

Gmina and voivodship experts are recruited from among people who know agriculture and local conditions in farming in their area; Central level experts represents research institutes, farmers organizations, public administration connected with agriculture, agricultural advisory  centers.

In connect to 3.1.52

Experts information are analyzed and compared with various data from statistical surveys, administrative data, information from different sources


Other sources

If there is more than one other statistical activity, please describe the main one below and the additional ones in table 3.1 of the annexed Excel file 

3.1.54 Name/Title

Yearly report on production  from entities employing 10 and more persons

3.1.55 Name of Organisation

Statistics Poland

3.1.56 Primary purpose

 Information on production and stocks

3.1.57 Data type

Research data

3.1.58 If Other, please specify

3.1.59 How would you assess the quality of those data?

Good

3.1.60 Additional comments

3.1.57

Quntity data

3.1.59

Data obtained within the obligatory reporting system; good quality of data


3.2. Frequency of data collection

Every year – according to the provisions in the Statistical Surveys Programme

3.3. Data collection

Census

These questions only apply to censuses. If there is more than one census, please describe the main census below and the additional ones in table 3.3 of the annexed Excel file

3.3.1 Name/Title


3.3.2 Methods of data collection

3.3.3 If Other, please specify


3.3.4 If face-to-face or telephone interview, which method is used?

3.3.5 Data entry method, if paper questionnaires?

3.3.6 Please annex the questionnaire used (if very long: please provide the hyperlink)


3.3.7 Additional comments


Sample survey

These questions only apply to surveys. If there is more than one survey, please describe the main survey below and the additional ones in table 3.3 of the annexed Excel file

3.3.8 Name/Title

Sample Survey on land use, sown area and harvests

3.3.9 Methods of data collection

Electronic questionnaire

3.3.10 If Other, please specify

3.3.11 If face-to-face or telephone interview, which method is used?

Electronic questionnaire

3.3.12 Data entry method, if paper questionnaires?

3.3.13 Please annex the questionnaire used (if very long: please provide the hyperlink)

3.3.14 Additional comments

3.3.9

Electronic questionnaire,  CAPI, CATI, CAWI


Administrative source

 These questions only apply to administrative sources. If there is more than one administrative source, please describe the main source below and the additional ones in table 3.3 of the annexed Excel file 

3.3.15 Name/Title

Implementation of international trade in goods in valuable quantities

3.3.16 Extraction date

 For annual data, it is - T + 8

3.3.17 How easy is it to get access to the data?

Direct constant access

3.3.18 Data transfer method

Online

3.3.19 Additional comments

 No problem Because it is in the PBSSP


Comment

see  http://swaid.stat.gov.pl/EN/SitePagesDBW/HandelZagraniczny.aspx


Knowledge Database Foreign Trade provides information on international trade in goods broken down by countries and goods, based on the following commodity classifications: Combined Nomenclature (CN), Standard International Trade Classification (SITC), Classification by Broad Economic Categories (BEC), Polish Classification of Products and Services (PKWiU). It contains also data on international trade in services by trading partners.


Experts

If there is more than one other statistical activity, please describe the main one below and the additional ones in table 3.3 of the annexed Excel file 

3.3.20 Name/Title

Local experts in every gmina (LAU 4), Voivodship expert (NUTS2), Central Level Expert (separate for cereals, for rape, for potatoes, for sugar-beets)

3.3.21 Methods of data collection

Information from experts are collected in a paper form; dates – according to the provisions in the Statistical Surveys Programme

3.3.22 Additional comments

3.4. Data validation

3.4.1 Which kind of data validation measures are in place?

Manual

3.4.2 What do they target?

Other

3.4.3 If Other, please specify

3.4.1

In case of electronic questionnaires a number of validation measures are in place,  i.e.  logical and mathematical

3.4.2

Mathematical mistakes and logical consistency between subsequent units of a questionnaire


3.5. Data compilation

3.5.1 Describe the data compilation process

Not applicable.

3.5.2 Additional comments

3.6. Adjustment

Not applicable.


4. Quality management Top

To ensure the quality of processes and products, Statistics Poland applies the EFQM Excellence Model, the EU Statistical Practices Code and the ESS Quality Assurance Principles (QAF). Statistics Poland is also guided by the requirements provided for in § 7. "Principles and quality criteria for the creation of official statistics" of the Act on public statistics.

4.1. Quality assurance

4.1.1 Is there a quality management system used in the organisation?

Yes

4.1.2 If yes, how is it implemented?

Implementation of regulations No. 35 of the President of Statistics Poland of 28 December 2011 in case of measurement, evaluation and monitoring of the quality of statistical surveys in subordinated units ( Standards and Registers Department) with the participation of Statistical Office in Łódź (US Łódź) prepared: (only Statistical Office Łódź)

- for the plan in 2018, including the plan review of the quality of statistical surveys for 2018, which has been reviewed by Methodological Use on training on 09/02/2018,

- information on priorities implemented in 2017.

The basis for choosing tests for good quality in 2018. This is a sign of quality in the database http: //raportjakosci / and the accompanying metadata, as well as proposals reported by the Statistics Poland departments and statistical offices.


As a result of the conducted by the Standards and Registers Department and Statistical Office  Łódź, it is necessary to have a quality review goal statistical surveys in 2018 were:

- decision-making process organizational and cooperative;

-recognizing the possibilities of fast processing

- coverage and lack of answers in statistical surveys;

- evaluation of the selection of units for the file and methods of sample selection;

- cognitive assessment of the question on reporting forms;

- assessment which retains high time respondents;

- Function recognition;

 and punctuality analysis of statistical surveys and research based on them


4.1.3 Has a peer review been carried out?

Yes

4.1.4 If Yes, which were the main conclusions?

In connection with the conducted on 23-27.02.2015 in the Statistics Poland, a peer review in 2018 continued implementation of the recommendations formulated in its course.

Activities were concerned:

· Modernization of processes related to statistical production;

· Review of human resources including their optimization by delegating tasks and liquidation unoccupied work positions in order to use the potential of employees more effectively;

· Implementing a remuneration policy that would be competitive with other government agencies through obtaining funds from Operational Programs and applying to the Minister of Finance for additional remuneration funds;

· Conducting quality reviews of statistical surveys with the participation of external users;

· Preparation of IT tools supporting the user needs research system;

· Carrying out standardization work aimed at ensuring comparability and coherence, and integration of information in various metadata areas in the System of Statistical Metadata, including verification of metadata areas concerning variable descriptions and variable packages in terms of needs the program of public statistics research and the sharing of result data. Currently Research program statistical public statistics PBSSP is available in the interactive form on the website.

Starting work on the development of new metadata elements, eg data validation;

· Successive shortening of time between collecting data and making it available to users as a result of modernization of statistical methods, including the implementation of standard software in the System Statistical Data Processing (SPDS);

· Increasing the offer of unit data provided in a safe work environment.

Detailed information on the result of monitoring the implementation of improvement actions by the Statistics Poland after partner's review as at December 31, 2017 posted on the GUS website in the tab.

Metainformation / Quality in statistics / Partnership review:

The main document underlying the review is the European Statistics Code of Practice.

In addition, the quality criteria for European statistics are set out in European statistics regulations, primarily in Regulation 223/2009 on European Statistics.

A national coordinator of the peer review was appointed in the CSO, supported by the Team for the preparation and conduct of the peer review (appointed by the internal ordinance of the President of GUS No. 8 of February 14, 2014 on the organization of the peer review).

This team coordinated work related to the preparation and submission of documentation to auditors, which consisted of:

• self-assessment questionnaire on the implementation of the European Statistics Code of Practice;

• questionnaire regarding the performance of the coordinating function by the Statistics Polenad in the national statistical system (Questionnaire on the Coordination role of NSIs);

• questionnaire on cooperation and the degree of integration in the European Statistical System (Questionnaire on cooperation / level of integration achieved by the ESS);

• EKPS principles implementation questionnaire for other producers of European statistics (ONAs);

description of the national statistical system in the so-called "Core document".

4.1.5 What quality improvements are foreseen?

Other

4.1.6 If Other, please specify

4.1.5

 Timeliness

Among the activities aimed at improving the quality of official statistics, works are carried out in the field of:

  • improvement of data collection methods, including electronic data collection in economic research and CAII, CAPI, CATI, mixed method in social research;
  • building a new organization of statistical surveys;
  • the integration of economic and social research;
  • improving the quality of survey frames for statistical surveys;
  • increasing the use of administrative sources;
  • the development of work on public databases;
  • conducting standardization activities in the field of concepts, variables, classifications, code lists, units of measurement, methodology and quality as well as other metadata used in statistical surveys;
  • deepening knowledge in the field of quality through: conducting training, including e-learning, developing instructions and guidelines, and providing educational information;
  • improving the metadata system;
  • monitoring the quality of statistical processes through self-assessment and quality reviews;
  • developing activities to study the burden on respondents and user satisfaction; identifying and popularizing good practices in improving quality in the national statistical system.


4.1.7 Additional comments

4.2. Quality management - assessment

Development since the last quality report

4.2.1 Overall quality

Stable

4.2.2 Relevance

Stable

4.2.3 Accuracy and reliability

Stable

4.2.4 Timeliness and punctuality

Stable

4.2.5 Comparability

Stable

4.2.6 Coherence

Stable

4.2.7 Additional comments

ext-container hidden"> 


5. Relevance Top

-

5.1. Relevance - User Needs

5.1.1 If certain user needs are not met, please specify which and why


5.1.2 Please specify any plans to satisfy needs more completely in the future

Balances will be published according both to the farming year and to calendar year. For the domestic needs not only cereal and oilseeds balances are elaborated and published.

5.1.3 Additional comments

5.2. Relevance - User Satisfaction

5.2.1 Has a user satisfaction survey been conducted?

No

If Yes, please answer all the following questions 

5.2.2 Year of the user satisfaction survey

5.2.3 How satisfied were the users?

5.2.4 Additional comments

5.3. Completeness

5.3.1 Data completeness - rate

100 %

5.3.2 If not complete, which characteristics are missing?

5.3.3 Additional comments


6. Accuracy and reliability Top

Not applicable.

6.1. Accuracy - overall
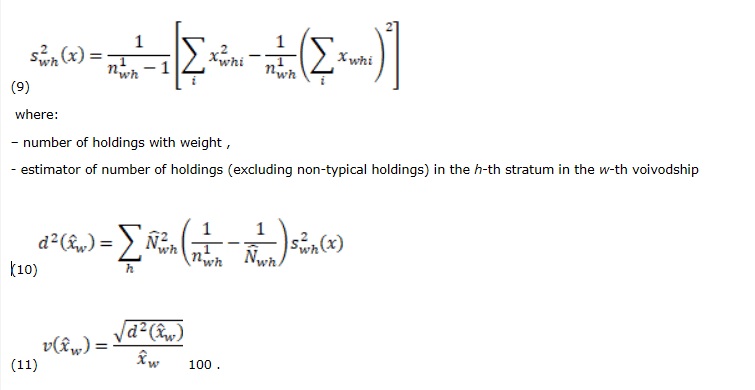
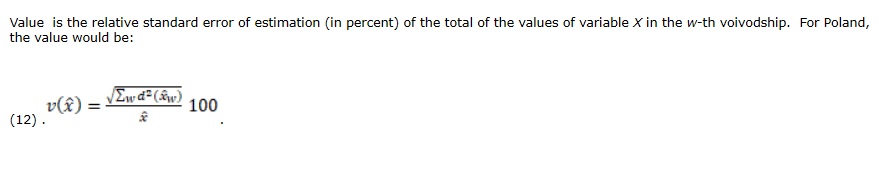
6.1.1 How good is the accuracy?

Very good

6.1.2 What are the main factors lowering the accuracy?

Other

6.1.3 If Other, please specify


Delays in obtaining data from administrative sources


6.1.4 Additional comments

6.2. Sampling error

 These questions only apply to surveys. If there is more than one survey, please describe the main survey below and the additional ones in table 6.2 of the annexed Excel file

6.2.1 Name/Title

The June farm sample survey

6.2.2 Methods used to assess the sampling error

Relative standard error

6.2.3 If Other, please specify

6.2.4 Methods used to derive the extrapolation factor

Basic weight

6.2.5 If Other, please specify

6.2.6 If coefficients of variation are calculated, please describe the calculation methods and formulas


6.2.7 Sampling error - indicators

Errors assesments are calculated for the country level as well as for voivodships in the Statistical Computing Centre and forwarded to the authors of surveys

Please provide the coefficients of variation in table 6.2 of the annexed Excel file

6.2.8 Additional comments

6.2.2

Calculation of precision involved formulas appropriate for stratified sampling scheme. Relative standard error is calculated for a number of characteristics.

6.2.4


Adjustment factor for non-response was applied to design weights in each stratum and it was an estimate of the proportion of the number of units, which should be enumerated to the number of enumerated units in a given stratum. Units that should be enumerated include all cases of refusals and an appropriate proportion of cases of lack of contact.

Non-typical cases (outliers) were also identified using distributions of main characteristics, and such holdings have weights trimmed to 1. 

6.3. Non-sampling error

See sections below.

6.3.1. Coverage error

Census

These questions only apply to censuses. If there is more than one census, please describe the main census below and the additional ones in table 6.3 of the annexed Excel file 

6.3.1.1 Name/Title

Over-coverage

6.3.1.2 Does the sample frame include wrongly classified units that are out of scope?

6.3.1.3 What methods are used to detect the out-of scope units?

6.3.1.4 Does the sample frame include units that do not exist in practice?

6.3.1.5 Over-coverage - rate

6.3.1.6 Impact on the data quality

Under-coverage

6.3.1.7 Does the sample frame include all units falling within the scope of this survey?

6.3.1.8 If Not, which units are not included?

6.3.1.9 How large do you estimate the proportion of those units? (%)

[0-100]

6.3.1.10 Impact on the data quality

Misclassification

6.3.1.11 Impact on the data quality

Common units

6.3.1.12 Common units - proportion

6.3.1.13 Additional comments


Sample survey

These questions only apply to surveys. If there is more than one survey, please describe the main survey below and the additional ones in table 6.3 of the annexed Excel file 

6.3.1.14 Name/Title

The June farm sample survey

Over-coverage

6.3.1.15 Does the sample frame include wrongly classified units that are out of scope?

Yes

6.3.1.16 What methods are used to detect the out-of scope units?

Over-coverage units were identified  during data collection and appropriately coded. They were eliminated from the central set of data and were used in correction of weights. 

6.3.1.17 Does the sample frame include units that do not exist in practice?

Yes

6.3.1.18 Over-coverage - rate

5.9%

Over-coverage rate was computed as the proportion of units from the sample which do not belong to the target population to the overall sample size.

6.3.1.19 Impact on the data quality

Low

Under-coverage 

6.3.1.20 Does the sample frame include all units falling within the scope of this survey?

No

6.3.1.21 If Not, which units are not included?

The under-coverage rate was estimated on the basis of an annual analysis of changes in the number of agricultural holdings in the frame. The analysis showed that every year about 3% of newly created agricultural holdings were not included in the surveys in given year.

6.3.1.22 How large do you estimate the proportion of those units? (%)

[0-100]

3%

6.3.1.23 Impact on the data quality

None

Misclassification

6.3.1.24 Impact on the data quality

None

Common units 

6.3.1.25 Common units - proportion

Not available

6.3.1.26 Additional comments

6.3.1.19

Small increase of sampling errors


Administrative data

These questions only apply to administrative sources. If there is more than one administrative source, please describe the main source below and the additional ones in table 6.3 of the annexed Excel file 

6.3.1.27 Name/Title of the administrative source

Implementation of international trade in goods in valuable quantities


Source data is customs declarations, Intrastat declarations and alternative data sources. The data is collected by the Ministry of Finance in accordance with the Program of statistical surveys of official statistics. Data are published from survey .

Over-coverage

6.3.1.28 Does the administrative source include wrongly classified units that are out of scope?

No

6.3.1.29 What methods are used to detect the out-of scope units?

6.3.1.30 Does the administrative source include units that do not exist in practice?

Yes

6.3.1.31 Over-coverage - rate

6.3.1.32 Impact on the data quality

None

Under-coverage

6.3.1.33 Does the administrative source include all units falling within the scope of this survey?

No

6.3.1.34 If Not, which units are not included?

There are statistical thresholds in the Intrastat system that exempt entities from reporting that did not achieve the required turnover value in a year. The amount of thresholds is annually announced by the President of the Statistics Poland (separately for each type of trading)

6.3.1.35 How large do you estimate the proportion of those units? (%)

[0-100]

Pursuant to the provisions, reporting must cover entities with a value of 97% of export turnover and 93% of import turnover.

Missing data is estimated based on data from the VAT system


6.3.1.36 Impact on the data quality

None

Misclassification 

6.3.1.37 Impact on the data quality

None

6.3.1.38 Additional comments

6.3.1.30

Data estimated for entities below the statistical threshold are added together and receive an artificial identification number.


6.3.1.32

There is a multi-stage data quality control. From the moment of acceptance of the customs declaration or declaration:

• minimal control - tests the correctness of identification data, XLM schemas

• formal - correctness of dictionary data

• logical - logical connections between fields, compliance with weight and price ranges

Logical control is carried out at every stage of creating statistical information

Data quality maintains certain standards

6.3.1.37

Classification errors happen. However, the sporadic phenomenon has no major impact on quality


6.3.2. Measurement error

Census

These questions only apply to censuses. If there is more than one census, please describe the main census below and the additional ones in table 6.3 of the annexed Excel file 

6.3.2.1 Name/Title

6.3.2.2 Is the questionnaire based on usual concepts for respondents?

6.3.2.3 Number of censuses already performed with the current questionnaire?

6.3.2.4 Preparatory testing of the questionnaire?

6.3.2.5 Number of units participating in the tests? 

6.3.2.6 Explanatory notes/handbook for surveyors/respondents? 

6.3.2.7 On-line FAQ or Hot-line support for surveyors/respondents?

6.3.2.8 Are there pre-filled questions?

6.3.2.9 Percentage of pre-filled questions out of total number of questions

[0-100]

6.3.2.10 Other actions taken for reducing the measurement error?

6.3.2.11 Additional comments


Sample survey

These questions only apply to surveys. If there is more than one survey, please describe the main survey below and the additional ones in table 6.3 of the annexed Excel file 

6.3.2.12 Name/Title

The June farm sample survey

6.3.2.13 Is the questionnaire based on usual concepts for respondents?

Yes

6.3.2.14 Number of surveys already performed with the current questionnaire?

42565

6.3.2.15 Preparatory testing of the questionnaire?

Yes

6.3.2.16 Number of units participating in the tests? 

16

6.3.2.17 Explanatory notes/handbook for surveyors/respondents? 

Yes

6.3.2.18 On-line FAQ or Hot-line support for surveyors/respondents?

No

6.3.2.19 Are there pre-filled questions?

No

6.3.2.20 Percentage of pre-filled questions out of total number of questions

[0-100]

6.3.2.21 Other actions taken for reducing the measurement error?

No

6.3.2.22 Additional comments

6.3.2.17

Definitions of terms,

Instructions for the interviewer on completing the June farm survey form in 2020 year.


6.3.3. Non response error

Census

These questions only apply to censuses. If there is more than one census, please describe the main census below and the additional ones in table 6.3 of the annexed Excel file

6.3.3.1 Name/Title of the survey

6.3.3.2 Unit non-response - rate

6.3.3.3 How do you evaluate the recorded unit non-response rate in the overall context?

6.3.3.4 Measures taken for minimising the unit non-response

6.3.3.5 If Other, please specify

6.3.3.6 Item non-response rate

6.3.3.7 Item non-response rate - Minimum

6.3.3.8 Item non-response rate - Maximum

6.3.3.9 Which items had a high item non-response rate? 

6.3.3.10 Additional comments


Sample survey

These questions only apply to surveys. If there is more than one survey, please describe the main survey below and the additional ones in table 6.3 of the annexed Excel file 

6.3.3.11 Name/Title of the survey

The June farm sample survey

6.3.3.12 Unit non-response - rate

25% 

6.3.3.13 How do you evaluate the recorded unit non-response rate in the overall context?

Moderate

6.3.3.14 Measures taken for minimising the unit non-response

Follow-up interviews
Reminders
Other

6.3.3.15 If Other, please specify

A series of actions were introduced to reduce the non-response rate.

An important part of those actions was the dissemination among farmers of information regarding the survey, its objectives and significance, as well as the obligation to participate in the survey. To every respondent participating in the survey a letter from the CSO President was sent. In commune offices the posters informing about the survey have been placed. After sending the Presidents letter a hotline for respondents and interviewers started to work – from the beginning to the end of the survey.

The proper training of interviewers also contributed to the reduction of the number of refusals. They were able to inspire a positive response to the survey and handle difficult respondents. If a holder was absent, the interviewers were able to conduct interviews with adult members of the holder's household.

The work of interviewers was monitored by regional Organizational Coordinator using the management application (CORstat).

If, during the online self-enumeration, a respondent completed only a part of the questionnaire, an interviewer called or visited that respondent to complete the form.

In cases of legal persons’ holdings, the reminders were sent by e-mail.

6.3.3.16 Item non-response rate

6.3.3.17 Item non-response rate - Minimum

6.3.3.18 Item non-response rate - Maximum

6.3.3.19 Which items had a high item non-response rate? 

6.3.3.20 Additional comments

6.3.3.13

Unit non-response rate is typical for this kind of surveys conducted by Statistics Poland 

6.3.3.14

A series of actions were introduced to reduce the non-response rate.

An important part of those actions was the dissemination among farmers of information regarding the survey, its objectives and significance, as well as the obligation to participate in the survey. To every respondent participating in the survey a letter from the CSO President was sent. In commune offices the posters informing about the survey have been placed. After sending the Presidents letter a hotline for respondents and interviewers started to work – from the beginning to the end of the survey.

The proper training of interviewers also contributed to the reduction of the number of refusals. They were able to inspire a positive response to the survey and handle difficult respondents. If a holder was absent, the interviewers were able to conduct interviews with adult members of the holder's household.

The work of interviewers was monitored by regional Organizational Coordinator using the management application (CORstat).

If, during the online self-enumeration, a respondent completed only a part of the questionnaire, an interviewer called or visited that respondent to complete the form.

In cases of legal persons’ holdings, the reminders were sent by e-mail.


6.3.4. Processing error

Census

These questions only apply to censuses. If there is more than one census, please describe the main census below and the additional ones in table 6.3 of the annexed Excel file 

6.3.4.1 Name/Title

6.3.4.2 Imputation - rate

6.3.4.3 Imputation - basis

6.3.4.4 If Other, please specify

6.3.4.5 Additional comments


Sample survey

These questions only apply to surveys. If there is more than one survey, please describe the main survey below and the additional ones in table 6.3 of the annexed Excel file 

6.3.4.6 Name/Title

The June farm sample survey

6.3.4.7 Imputation - rate

No imputation

6.3.4.8 Imputation - basis

6.3.4.9 If Other, please specify

6.3.4.10 How do you evaluate the impact of imputation on Coefficients of Variation?

6.3.4.11 Additional comments

Questions concerning imputation are not aplicable, due to there was no imputation.

6.3.5. Model assumption error

Not applicable.

6.4. Seasonal adjustment

Not applicable.

6.5. Data revision - policy

Not applicable.

6.6. Data revision - practice

6.6.1 Data revision - average size

Not applicable.

6.6.2 Were data revisions due to conceptual changes (e.g. new definitions) carried out since the last quality report?

Yes

6.6.3 What was the main reason for the revisions?

Updated information

6.6.4 How do you evaluate the impact of the revisions?

Important

6.6.5 Additional comments


7. Timeliness and punctuality Top
7.1. Timeliness

7.1.1 When were the first results for the reference period published?

All data including balances are published according to the Statistical Surveys Programme and to the editorial plan of the Office

7.1.2 When were the final results for the reference period published?

Crop and oilseeds balances are published just after their preparation and according to the editorial plan of the Office 

7.1.3 Reasons for possible long production times?

Data necessary for preparation of the balances comes from different surveys and different departments, including administrative sources. All these requires a special treatment to check the data, its cohesion etc.

7.2. Punctuality

7.2.1 Were data released nationally according to a pre-announced schedule (Release Calendar)?

Yes

7.2.2 If Yes, were data released on the target date?

Yes

7.2.3 If No, reasons for delays?

7.2.4 Number of days between the national release date of data and the target date

Balances are included among others in the Concise statistical yearbook and Statistical yearbook of Agriculture, which are published according to the editorial plan of the Office.


8. Coherence and comparability Top

Not applicable.

8.1. Comparability - geographical

To be assessed by Eurostat

8.1.1. Asymmetry for mirror flow statistics - coefficient

Not applicable

8.2. Comparability - over time

8.2.1 Length of comparable time series

Balances in relation to a calendar year – since 2020

8.2.2 Have there been major breaks in the time series? No
8.2.3 If Yes, please specify the year of break and the reason
8.2.4 Additional comments
8.3. Coherence - cross domain

8.3.1 With which other national data sources have the data been compared?

None

8.3.2 If Other, please specify

Balances are compared with those made by the Institute of Agriculture and Food Economy – National Research Institute 

8.3.3 Describe briefly the results of comparisons

Trends are comparable

8.3.4 If no comparisons have been made, explain why

8.3.5 Additional comments

-

8.4. Coherence - sub annual and annual statistics

Not applicable

8.5. Coherence - National Accounts

Not applicable

8.6. Coherence - internal

Not applicable


9. Accessibility and clarity Top

-

9.1. Dissemination format - News release

9.1.1 Do you publish a news release?

No

9.1.2 If Yes, please provide a link

9.2. Dissemination format - Publications

9.2.1 Do you produce a paper publication?

Yes

9.2.2 If Yes, is there an English version?

Yes

9.2.3 Do you produce an electronic publication?

Yes

9.2.4 If Yes, is there an English version?

Yes

9.2.5 Please provide a link

https://stat.gov.pl/obszary-tematyczne/roczniki-statystyczne/roczniki-statystyczne/rocznik-statystyczny-rolnictwa-2020,6,14.html


9.3. Dissemination format - online database

9.3.1 Data tables - consultations

No information

9.3.2 Is an on-line database accessible to users?

No

9.3.3 Please provide a link

https://stat.gov.pl/en/basic-data/

9.4. Dissemination format - microdata access

9.4.1 Are micro-data accessible to users?

No

9.4.2 Please provide a link

9.5. Dissemination format - other
9.6. Documentation on methodology

9.6.1 Are national reference metadata files available?

Yes

9.6.2 Please provide a link

https://stat.gov.pl/metainformacje/

9.6.3 Are methodological papers available?

Yes

9.6.4 Please provide a link

https://stat.gov.pl/obszary-tematyczne/rolnictwo-lesnictwo/rolnictwo/charakterystyka-gospodarstw-rolnych-w-2016-r-,5,5.html

9.6.5 Is a handbook available?

No

9.6.6 Please provide a link

Not published on a web.

9.7. Quality management - documentation

9.7.1 Metadata completeness - rate

Not applicable.

9.7.2 Metadata - consultations

Not applicable.

9.7.3 Is a quality report available? No
9.7.4 Please provide a link

Not applicable.


10. Cost and Burden Top

10.1 Efficiency gains if compared to the previous quality report

None

10.2 If Other, please specify

Not applicable.

10.3 Burden reduction measures since the previous quality report

Other

10.4 If Other, please specify

there is no possibility of comparison with the previous report


11. Confidentiality Top

-

11.1. Confidentiality - policy

11.1.1 Are confidential data transmitted to Eurostat?

No

11.1.2 If yes, are they confidential in the sense of Reg. (EC) 223/2009?

11.1.3 Describe the data confidentiality policy in place

11.2. Confidentiality - data treatment

11.2.1 Describe the procedures for ensuring confidentiality during dissemination

As described and regulated in the Law on Public Statistics

11.2.2 Additional comments


12. Comment Top

Completing such a Report is very complicated. Crop and oilseeds balances are made based on a number of primary statistical surveys, experts estimations as well as administrative data on export and import. To make a balance sheet it requires a lot of additional knowledge on general situation in agriculture both in the country and in the world.

A lot of questions in this report relates to statistical surveys in general but not specifically to balances, which are “secondary” activity.

In our opinion the quality report for such a task – balance calculations based on the results of sample surveys and other sources should be simplified and adjusted to the concrete undertaking.


Related metadata Top


Annexes Top
CropsBS-Annex