Reference metadata describe statistical concepts and methodologies used for the collection and generation of data. They provide information on data quality and, since they are strongly content-oriented, assist users in interpreting the data. Reference metadata, unlike structural metadata, can be decoupled from the data.
Wages, Labour Cost, Job Vacancies and Education Statistics
1.3. Contact name
Confidential because of GDPR
1.4. Contact person function
Confidential because of GDPR
1.5. Contact mail address
National Institute of Statistics (INS)
16 Libertăţii Avenue., Bucharest, District 5, ROMÂNIA
1.6. Contact email address
Confidential because of GDPR
1.7. Contact phone number
Confidential because of GDPR
1.8. Contact fax number
Confidential because of GDPR
2.1. Metadata last certified
7 February 2023
2.2. Metadata last posted
7 February 2023
2.3. Metadata last update
7 February 2023
3.1. Data description
The Continuing Vocational Training Survey (CVTS) collects information on enterprises’ investment in the continuing vocational training of their staff. Continuing vocational training (CVT) refers to the education or training measures or activities which are financed in total or at least partly by the enterprise (directly or indirectly). Part financing could include the use of work-time for the training activity as well as financing of training equipment.
The information available from the CVTS is grouped around the following topics:
- Provision of CVT courses and other forms of CVT (training/non-training enterprises)
- CVT strategies
- Participants in CVT courses
- Costs of CVT courses
- Time spent in CVT courses
- Characteristics of CVT courses
- Assessment of CVT activities
The CVTS also collects certain information on initial vocational training (IVT).
The main objective of the Romanian Continuing Vocational Training Survey (CVTS) is to provide information on:
- enterprises’ programs on continuous vocational training (CVT) for their employees;
- the continuous vocational training (CVT) volume and characteristics.
The survey provides information on all types of vocational training provided by the enterprises for their employees.
The design of the survey tools is done in accordance with the recommendations and standards of the European Union under the
- European Parliament and Council Regulation no. 1552/2005 on statistics relating to vocational training in enterprises, implementing Commission Regulation no. 1153/2014 amending Regulation (EC) no. 198/2006 as regards the data to be collected, and the sampling, precision and quality requirements,
- CVTS 6 implementation manual,
- national characteristics.
The Continuing Vocational Training Survey results, in relation with the information provided by other surveys are used by policy makers in establishing the actions and measures for economic and social development strategies as well for implementing the programs on active measures for improving the labour force skills and qualification for increasing the employability.
3.2. Classification system
Standard classification used:
Classification of Activities in the National Economy (CANE Rev. 2), harmonized with the European classification in the field (NACE Rev. 2).
3.3. Coverage - sector
CVTS 6 covers all economic activities defined in sections B to N and R to S of NACE Rev. 2.
The main groupings for enterprises are by economic activity (NACE Rev. 2), size group and training/non-training enterprises.
3 enterprise size categories, according to the number of persons employed: (10-49), (50-249) and 250 and more.
3.4. Statistical concepts and definitions
The definitions as well as the list of variables for the Continuing Vocational Training Survey variables were developed and adopted in accordance with European standards (http://ec.europa.eu/eurostat/web/education-and-training/methodology): CR no. 1552/2005 on statistics relating to vocational training in enterprises and the implementing CR no. 1153/2014 amending Regulation (EC) no. 198/2006 as regards the data to be collected, and the sampling, precision and quality requirements; CVTS 6 implementation manual but also taking into account the national characteristics.
3.5. Statistical unit
Enterprise definition is compliant with Council Regulation (EEC) No 696/93.
The unit of selection was the enterprise defined according to the communitarian rules for enterprises statistics as: “the smallest combination of legal units that is an organisational unit producing goods or services, which benefits from a certain degree of autonomy in decision-making, especially for the allocation of its current resources. An enterprise carries out one or more activities at one or more locations. An enterprise may be a sole legal unit”.
The survey provided data for each enterprise, thus the observation unit, in accordance with the requirements of Council Regulation no. 1552/2005 on statistics relating to vocational training in enterprises.
3.6. Statistical population
The Romanian Business Register (REGIS) is used as a sampling frame. The Business Register is designed and implemented having as a main data sources the administrative files and statistical sources. The main administrative source of data for REGIS is the Fiscal Register. The Trade Register is used as a consultation data source in order to improve the quality of the register. Other files used as source of data for the REGIS in Romania are: Balance Sheet files, VAT files, REGIS survey for the new enterprises regarding their main activity and size and so on, feedback from other surveys, used as consultation data sources for improving the quality of the register data.
According to the Council Regulations, REGIS contains the following types of statistical units: legal unit, enterprise, and local unit. All the enterprises having the main activity in the section A to S of NACE Rev. 2, whatever their size (number of employees or turnover) are covered.
The Romanian Business Register contains all enterprises, authorities and organisations as well as their local units in Romania that carry out any economic activity irrespective of their size or if they belong to the private or public sector.
In Romania, the CVTS sampling frame is selected from the REGIS and comprises all enterprises created before the reference year, which were still active and belonging to the statistical population of interest, all new enterprises created during the reference year, which were still active and belonging to the statistical population of interest.
There are 52 332 enterprises in the target population.
Variable A2tot (persons employed) refers to the annual average 2020.
3.7. Reference area
The whole territory of the country is covered. Data are available and published at the national level (NUTS0).
3.8. Coverage - Time
Continuing Vocational Training Survey data are available starting with the reference year 1999 and from 2005 every five years, for the reference years 2005, 2010, 2015 and 2020.
3.9. Base period
Not applicable.
Number, EUR (at Eurostat level); RON (at national level).
The reference year for CVTS 6 is the calendar year 2020.
6.1. Institutional Mandate - legal acts and other agreements
At European level:
Basic legal act: Regulation (EC) No 1552/2005 of the European Parliament and the Council
Implementing act: Commission Regulation (EU) No 1153/2014, amending Commission Regulation (EC) No 198/2006
At national level:
The statistical Law no. 226/2009 regarding the organisation of official statistics
6.2. Institutional Mandate - data sharing
Not applicable.
7.1. Confidentiality - policy
All statistics collected and published by INS are governed by the statistical Law no. 226/2009 regarding the organisation of official statistics, published in Romania's Official Journal First part, no. 397/11.06.2009, with further amendments. The Law specifies that: the official statistical services are authorized to ask for and receive free of charge statistical data and information from all natural and legal persons who are located on the Romanian territory, hold any kind of capital or carry out any type of activity.
Also, under the provision of this law, INS cannot publish, or otherwise make available to one individual or organisation, statistics that could enable the identification of data for any individual person or entity.
INS has been officially recognised by the government as fully independent organisation: it decides by itself which data to collect, which methodology to use, and which results, methodological notes and commentaries are published.
The most important aspects on the organisation of the official statistics in Romanian are posted on the National Institute of Statistics Internet website (http://www.insse.ro).
7.2. Confidentiality - data treatment
According to the Eurostat confidentiality criteria.
8.1. Release calendar
All the activities carried out by INS during a year are scheduled through the Activity Plan with several months earlier. Annually, INS issues for the users a press release calendar and a catalogue of statistical products and services containing the names, periodicity, short descriptions and release dates for all publications.
At national level, CVTS results are available to all users simultaneously at the time of release first through the press release and after two weeks through a detailed publication and online Tempo database.
Identification of internal government access to data before release
No government official outside the National Institute of Statistics has access to the data before release to the public.
Transmission to Eurostat and further use of the statistics
Data are transmitted to Eurostat by e-DAMIS using SDMX application in XML format.
Every 5 years.
10.1. Dissemination format - News release
The Continuing Vocational Training Survey 2020 data are disseminated through a press release, containing the survey main results and methodological explanations.
The press release is available on INS web-site (both in Romanian and English languages) for all interested users:
Based on the Continuing Vocational Training Survey (CVTS 6) results a detailed publication (available only in Romanian language) is prepared and disseminated to the main users:
Romanian Presidential Administration;
Romanian Parliament (including several Commissions oriented on labour, education, social protection policies);
governmental bodies: Ministry of Labour and Social Solidarity, Ministry of Economy, Ministry of Finance, National Commission for Strategy and Prognosis, National Agency for Employment, Ministry of Education, Ministry of Culture, Ministry of Foreign Affairs, National Council for Adult Education and Training, Institute of Educational Sciences and others;
employers and employers' associations;
trade unions;
professional associations;
research institutes and universities: Research Institute of National Economy, National Scientific Research Institute in the field of Labour and Social Protection, Research Institute for Education, Research Institute for Quality of Life, Romanian Academy, Academy for Economic Studies and others.
The publication is entitled "Characteristics of vocational training provided by enterprises in Romania in 2020" and is structured as follows:
Survey methodology and organization: presents information on the survey objectives, coverage, unit of selection/observation, periodicity and reference period, sampling design, concepts and definitions of the collected and derived indicators, classifications used;
Data analysis: contains tables, graphs and analysis of the main indicators obtained - the average number of persons employed, labour cost, share of enterprises providing CVT (courses, other forms, both), number of participants in CVT, participation rates, time spent in CVT courses, costs of CVT courses, share of enterprises providing IVT, share of non-training enterprises etc. - by different breakdowns (economic activities, size classes of the enterprises, sex, age groups);
Tables with survey results: contains detailed tables (in Excel format) of the main indicators broken-down by different variables (depending on the indicator): gender, economic activities, size classes of the enterprises.
It is also available at the INS library in printed format.
10.3. Dissemination format - online database
The main results of the Continuing Vocational Training Survey (CVTS 6) were available on September 30, 2022 on INS website (www.insse.ro), through online statistical database (TEMPO), in both Romanian and English languages.
Detailed metadata for each indicator is also included. The TEMPO database contains the entire time series.
10.3.1. Data tables - consultations
Not available.
10.4. Dissemination format - microdata access
According to the Eurostat dissemination rules.
10.5. Dissemination format - other
Not the case.
10.5.1. Metadata - consultations
Not available.
10.6. Documentation on methodology
Metadata are included in all Continuing Vocational Training Survey releases (press release, publication, ad hoc data requests).
The quality report on Continuing Vocational Training Survey 2020 will be available on INS web-site (both in Romanian and English languages) and contains the same information as in the ESS MH.
The quality of the Continuing Vocational Training Survey data is guaranteed in accordance with the ESS Code of Practice for each stage of the survey organisation and carrying out.
The questionnaire design, the detailed explanatory notes and the IT solutions developed had as result complete and of good quality data.
11.2. Quality management - assessment
The variables regarding the Continuing Vocational Training Survey cost by components created problems in answering by the enterprises. The enterprises provided the answers but they considered the cost variables very complex and time consuming.
All the standard statistical quality criteria are met (i.e. users’ needs satisfied based on data usefulness and timeliness; various dissemination formats and breakdowns; national and Eurostat dissemination timetable respected).
12.1. Relevance - User Needs
The Continuing Vocational Training Survey (CVTS 6) results, in relation with the information provided by previous survey (CVTS 5) and other surveys (such as Labour Cost Survey), are used by policy makers in establishing the actions and measures for economic and social development strategies as well as for implementing the programs on active measures for improving the labour force skills and qualification for increasing the employability.
Ministry of Labour and Social Solidarity are interested in the employers' programs and strategies for increasing the competitiveness in relation to the education and qualification of persons employed. The information is used to measure the inputs and outputs development among different economic activities.
National Council for Adult Education and Training has a high interest on the employers' expenses for vocational training as share of labour costs, in order to improve the programs in this area. The aim is to reach a higher qualification of the existing labour force (instead of employing directly high educated staff), adequate to the high technologies and innovations.
12.2. Relevance - User Satisfaction
(i) Internal users:
In Romania, the official statistics is under the responsibility of National Institute of Statistics (INS) but, in order to ensure the objective, transparent and scientific, character of the methodologies, indicators and classifications used in statistics, the Council of Co-ordinating the Statistical Activity is established.
The Council is composed by representatives of:
Romanian Academy,
specialised higher education system and research,
ministries and other specialised bodies sub-ordinate to the Government,
Romanian National Bank,
trade unions,
employers' associations,
mass-media,
professional associations.
The Council representatives meet in working groups by statistical fields quarterly or more frequently when necessary. During these meetings, the National Institute of Statistics receives strong feed-back from the users in terms of results already disseminated (including the level of details, breakdowns etc.) and requests for further needed information to be included in next statistical inquiries.
(ii) External users:
Eurostat;
Foreign research institutes;
Foreign employers (investors).
The below publication presents the way in which the statistical data produced and the methodological information of the INS meet the information needs of the various user categories.
The sample of enterprises has been taken according to stratification sampling design (stratification with simple random sampling within strata). The samples within strata have been taken without replacements. Strata were constructed by dividing the sampling frame by the main economic activity coded by NACE Rev. 2 and size class by number of employees. According to Eurostat recommendations, the sample stratification must follow a minimum specification:
3 enterprise size categories, according to the number of persons employed: (10-49), (50-249) and 250 and more.
The strata are defined by the cross-classification of NACE categories with 3 size classes. The sample size for each stratum was determined by using the Neyman allocation.
where:
h=index of strata
nh=the number of units in the sample, in the stratum h
n=the number of units in the sample
Nh =the number of units in the sampling frame, in the stratum h
σh=the standard deviation (computed by using the number of employees) in the stratum h
The overall sample of enterprises was designed in a way that leads to representative results for the national economy. The sample size was computed under the premise of the estimated error (computed by using the number of employees) equal to 0.02 and a confidence level of 95%.
It was also necessary to ensure that there are sufficient responses to obtain enough detail for cross-classifications. In order to achieve this goal, a minimum 270 units were selected from each stratum. This condition was fulfilled for the strata where the sampling frame exceeded 270 units. Enterprises with 250 employees and over were exhaustively included in the sample.
The gross sample size for CVTS 6 was about 9.000 enterprises.
The computation of the final weights was performed according to the following steps:
1. Calculation of a selection weight for each unit. The selection weight is a Horvitz-Thompson weight and is computed as the inverse of the selection probability.
where:
pih = the selection probability of unit i for stratum h
Nh=the number of units in the sampling frame, in the stratum h
nh= the number of units in the sample, in the stratum h
2. Calculation of a non-response weight – adjustment. The non-response weight is computed at each stratum level, as the inverse of the response probability. The purpose of this coefficient is to compensate the non-respondent units, under the assumption that these non-respondent units have the same training patterns compared with the respondent units in the same stratum. Another considered premise is the fact that answering and non-answering is a random variable.
where:
nh= the number of units in the sample, in the stratum h
mh = the number of respondent units selected in the sample, in the stratum h
3. Calculation of the weight coefficient:
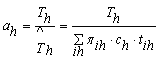
The auxiliary variable used is the average number of employees. The final weights were adjusted on the basis of the comparison between the estimated average number of persons employed in CVTS survey and the estimated average number of employees from other administrative and statistical sources. The adjustment was made at cell level, checking then the estimates at NACE category level, at enterprise size class level and at the overall level.
where:
ah =the adjustment coefficient
Th = the average number of employees in other surveys, in the stratum h
= the estimated average number of persons employed computed by applying the final weight to the average number of employees for the units in the sample, in the stratum h
4. Calculation of the final weight in the stratum h :
The coefficients of variation for the key variables for the total population are:
total number of persons employed: 0.02168
total number of enterprises that provided any form of CVT: 0
ratio of the total number of enterprises that provided any form of CVT to the total number of enterprises: 0.222040
total number of enterprises that provided CVT courses: 0
ratio of the total number of enterprises that provided CVT courses to the total number of enterprises: 0.272436
total number of persons employed in enterprises that provided any form of CVT: 0.046314
total number of participants in CVT courses: 0.068422
ratio of the total number of participants in CVT courses to the total number of persons employed:0.154161
ratio of the total number of participants in CVT courses to the total number of persons employed in enterprises that provided CVT courses: 0.097220
total costs of CVT courses: 0.086666
total number of enterprises providing IVT: 0
ratio of the total number of enterprises providing IVT to the total number of enterprises: 0
13.2.1. Sampling error - indicators
The coefficients of variation requested through the Commission Regulation No. 1153/2014 are presented in table 13.2.1 "Sampling errors - indicators" in annex "RO - QR tables CVTS 2020 (excel)".
The computations of CVs were produced using the variance programme CLAN, a SAS macro provided by Swedish statistics. Except for the setting-up of the frame population, no data from registers were used.
13.3. Non-sampling error
Detailed description in the following items.
13.3.1. Coverage error
The sampling frame used to draw the sample was built using the Romanian Business Register and contained the statistical information related to the reference period, namely the calendar year of 2020.
The Business Register was designed and implemented having as main data sources the administrative files and statistical sources. The main administrative source of data for REGIS is the Fiscal Register. The Trade Register is used as a consultation data source in order to improve the quality of the register. Other files used as source of data for the REGIS in Romania are: Balance Sheet files; VAT files; an exclusively REGIS survey for the new enterprises regarding their main activity and size and so on. The information received from different data sources (surveys carried out by INS in Romania) is also complemented.
As consequence the main over/under coverage problems are related to the information quality concerning size class of enterprises by number of employees.
In the weighting and adjustment process the unidentified units were assimilated to that of the non-respondent units. The weighting procedures applied at enterprise level were done in order to compensate the total non-response, together with the calibration procedures applied at NACE Rev. 2 division and with information on active enterprise in 2020. The auxiliary variable used for calibration was the average number of employees (according to Labour Cost Survey). The calibration was produced also with the routine of the CLAN programme provided by Swedish statistics.
See table 13.3.1 "Coverage error" in annex "RO - QR tables CVTS 2020 (excel)".
13.3.1.1. Over-coverage - rate
A percentage of 0.65% of surveyed enterprises reported an average number of persons employed less than the limit threshold for including criteria in the reference population (at least an average number of 10 persons employed) but the stability of activity is at high level.
In the observed sample there are 99 unidentified enterprises. These units are not counted in response set. In the adjustment procedure the unidentified enterprises were assimilated to the non-response units.
The extend of under-coverage, that is enterprises within the scope of the survey but which were not included in the sampling frame cannot be known but given the efforts made to keep the sampling frame up-to-date it is unlikely to be significant.
To perform the adjustments of the over- and under-coverage by weighting procedure a model assumption was used. These assumptions were made for each stratum and were the following:
the over-coverage rate among the respondents is the same as among the non-respondents;
the number of over-coverage enterprises in the frame is the same as the number of under-coverage enterprises.
the mean value of any variable of interest is the same in the accessible part of the target population as in the under-coverage part.
The over-coverage rate was 1.8%.
See table 13.3.1.1 "Over-coverage - rate" in annex "RO - QR tables CVTS 2020 (excel)".
13.3.1.2. Common units - proportion
Not applicable.
13.3.2. Measurement error
The information below is an estimation of errors rates at central level, after the data files were received from all over the country. Statistics on the first level of checking (local level) are not available. Errors rates were computed as ratio between cases appeared over number of eligible units for the given variable/relation.
Most frequent errors that occurred during data checking period:
9.45% for error coded S10: checking that if the enterprise provided CVT (courses or/and other forms) then the module E on reasons for non-provision of CVT courses or other forms of CVT during 2020 had to be empty (skipped);
8.50% error D10: checking if enterprises that provide CVT have answered to the question related to the effects of the COVID-19 pandemic on the CVT activities;
5.38% for error C139: checking if the CVT courses per hour of training the limits took values between nationally specific values (min and max);
5.10% for error S9: checking if enterprises that did not provide CVT courses but did provide other forms of CVT have answered to module D on training policy of the enterprise;
3.57% for error S10: checking the relation between the number of participants to CVT courses broken down by age groups and the average number of persons employed of same age;
2.78% for error C44: checking the relation between the hours spent on CVT courses within the working program and online;
2.35% for error A10: checking if monthly labour cost took values between nationally specific values (min and max);
2.13% error A8: checking if number of hours worked took values between nationally specific values (min and max);
0.30% error: checking the relation between D6 - a written training plan or program and D7 - annual training budget, this included provision for CVT.
Micro-data files (before and after data imputation) were sent via eDAMIS to Eurostat in accordance to the standard format and requested logical checks. Where the case, different inconsistencies were explained for the data checking and missing values (sent by email to Eurostat).
13.3.3. Non response error
The treatment of non-response is performed for the sampling phase and is regarding to the survey status of enterprises and its response.
The non-response is presented in table 13.3.3.1 "Unit non-response - rate" in annex "RO - QR tables CVTS 2020 (excel)".
The enterprises that reported an average number of persons employed of 9 or less were considered out of scope units. To perform the adjustments of out of scope units by weighting procedure a model assumption was used. These assumptions are made for each stratum (to first sampling phase level) and are:
the out of scope units’ rate among the respondents is the same as among the non-respondents.
the number of out of scope enterprises in the frame is the same as the number of in scope units but not included in the sampling frame.
the mean value of any variable of interest is the same in the accessible part of the target population as in the inaccessible part.
In order to reduce the unit non-response, the statisticians from the local statistical offices contact or re-contact the units/respondents who did not sent the data, irrespective of their size classes, but especially the ones with more than 250 employees, who are exhaustively surveyed. In the data collection phase, the on-line system automatically transmitted reminders to all enterprises in the survey sample.
13.3.3.1. Unit non-response - rate
The treatment of non-response concerns the survey status of enterprises and its response.
The estimation method involves multiplying the value for each sampled business by a combination of weights, one being outlier weight, one resulting from the sample design. An outlier weight is computed as a Windsor weight. The units having the normal score (z score) out of interval [-3, 3] are outlier units. The normal score, which determines the outlier units, is computed taking into account the stratification used in sample design. In order to perform the adjustment of non-response is computed a weight resulting from the sample design, as the sample weight adjusted by the inverse of response probability (described in item 13.2).
See table 13.3.3.1 "Unit non-response - rate" in annex "RO - QR tables CVTS 2020 (excel)".
13.3.3.2. Item non-response - rate
The item non-response was not accepted in the data collection phase. That is why enterprises were re-contacted and the missing variables were completed. Thus, all key variables were collected from the respondent units.
A not significant number of cases of item non-response were registered at the end of data collection: only 8 enterprises, for 2 variables (A4 Total number of hours worked, A5 Total labour costs).
These variables were imputed from the Labour cost survey (LCS) for the same reference year (2020), for which the respective enterprises responded.
The following method was applied:
for variable A4 Total number of hours worked: the average number of hours annually worked by all employees in LCS was applied to the number of persons employed from CVTS 6;
for variable A5 Total labour costs: the corresponding labour cost from LCS was taken for these common enterprises, in CVTS 6.
See table 13.3.3.2 "Item non-response - rate" in annex "RO - QR tables CVTS 2020 (excel)".
13.3.4. Processing error
In total, about 320 logical tests were performed for data checking and correlation, focussing on key variables, such as: average number of persons employed, hours worked, labour cost, number of participants to CVT courses, number of hours spent in courses, costs of CVT courses etc.
Since the same tests were conducted at local level as well as at central level, the largest part of the errors found was solved from the beginning (at local level). The figures were corrected after re-contacting the corresponding enterprises.
The IT solution contained the following categories oflogical teststhat check:
the primary data from the questionnaires;
the logical flows among the questionnaire chapters;
the data integrity and correctness;
the logical checks inside the tables (for those with numerical data).
The logical tests have the scope:
to follow and check the logical flows of the questionnaire;
to correlate the data from related chapters of the questionnaire;
to correlate the answers between different questions within same chapter and between chapters of the questionnaire;
to check the correlation of data from different questions (for the quantitative ones);
to define and check certain limits to which different indicators must belong;
to check the level of totals with the sum of the breakdowns (by rows and columns) within same table for quantitative data;
to find out the outliers or non-logical values.
The tests for data integrity check the identification information from the sample of units with the information from respondent files.
At central level - more accurate and detailed procedures were created for:
integrity checking (identification data of the selected units and of the respondent units were checked – unique code of the respondent unit, fiscal code, address, NACE activity, etc.),
data accuracy and correlation,
adjustment and weighting procedures,
imputation methods,
non-weighted and weighted data tabulation.
Further activities for solving the errors or diminishing the number of errors were carried out at central level:
data comparability with the previous survey (CVTS 5) for the main and common variables,
data comparability with other data sources (i.e. 2020 Labour Cost Survey for the common indicators),
codification of the national variables in accordance with the variables stipulated in the regulation,
automatic completion of final results into the standard format designed by Eurostat for micro data transmission.
The questionnaire design, detailed explanatory notes provided through the survey manual and the IT solutions developed had as result a complete and of good quality data set.
After validation, CVTS data were analysed and corrected where necessary. In order to provide more accurate and reliable data comparisons among variables and/or with other data sources were made.
At national level CVTS data were tabulated by different variables and breakdowns (NACE sections and divisions, size classes, sex or age groups). For micro data transmission to Eurostat automatic codification of the national variables into the standard format was performed.
13.3.5. Model assumption error
In Romania, fiscal year fully corresponds to the calendar year. Thus, no adjustment is necessary. Romanian CVTS 6 covered enterprises performing economic activity B to N and R to S of NACE Rev. 2 and having the average number of persons employed of 10 and over.
According to the CR no. 1552/2005 on statistics relating to vocational training in enterprises and the implementing CR no. 1153/2014, Romania provided data for all requested variables, broken down by:
No administrative data were used. All data were exclusively obtained from CVTS 6.
14.1. Timeliness
The reference period for CVTS 6 is the calendar year 2020.
All the activities carried out by INS during a year are scheduled through the Activity Plan with several months in advance. Annually, INS issues for the users a catalogue of statistical products and services containing the names, periodicity, short descriptions and release dates for all publications.
The length period of preparing, carrying out and publishing of the final results for CVTS 6 lasted about 22 months (from November 2020 to September 2022).
14.1.1. Time lag - first result
It was only one transmission of the Continuing Vocational Training Survey results, that of the final results on 30.06.2022.
14.1.2. Time lag - final result
Transmission of the Continuing Vocational Training Survey 2020 final results: 30.06.2022
14.2. Punctuality
The initialdata collection period for Continuing Vocational Training Survey (CVTS 6) lasted about 3 months: from 15 February to 5 May 2021.
Since not all enterprises respected the deadline requested, a high proportion of questionnaires were received with delay by the territorial statistical offices. Furthermore, due to the recalls necessary for additional information and corrections of the variables filled in by the enterprises, delays occurred in fully completing the data collection.
In the same time the activities related to data checking, validation and correction were performed at local and central level, until 21.01.2022.
The last months of the survey processing were dedicated to weighting data, validation of weighted data, tabulation and final analysis.
See table 14.2 "Project phases - dates" in annex "RO - QR tables CVTS 2020 (excel)".
14.2.1. Punctuality - delivery and publication
No transmission or dissemination delays were recorded.
15.1. Comparability - geographical
There is no deviation between national and European concepts and definition. The national version of the questionnaire was design based on the master EU questionnaire. Starting with the reference year 2020 the variables A2tot, A2m and A2f refers to the average number of persons employed, as Eurostat recommended.
Some additional variables/information related to COVID-19 were collected.
For further information see table 15.1 "Comparability - geographical" in annex "RO - QR tables CVTS 2020 (excel)".
15.1.1. Asymmetry for mirror flow statistics - coefficient
Not applicable.
15.2. Comparability - over time
The Continuing Vocational Training Survey data are comparable over time, except the indicators A2tot, A2m and A2f which, starting with 2020 refers to the average number of persons employed, as Eurostat recommended.
See table 15.2 "Comparability - over time" in annex "RO - QR tables CVTS 2020 (excel)".
15.2.1. Length of comparable time series
The indicators did not have significant changes in definitions, coverage or classifications since the previous survey, except the indicators A2tot, A2m and A2f which, starting with 2020 refer to the average number of persons employed, as Eurostat recommended.
15.3. Coherence - cross domain
Considering the differences of the two surveys coverage, the figures on number of persons employed follows the same trends. SBS does not cover the section financial intermediation (section K), arts, entertainment and recreation (section R) and section S (excluding division 94). The number of persons employed is extracted based on the active units existing in year 2020 and in accordance with EU requirements the weights coefficients are computed based on turnover at main economic activity and size classes.
See table 15.3 "Coherence - cross-domain" in annex "RO - QR tables CVTS 2020 (excel)".
15.3.1. Coherence - sub annual and annual statistics
Not applicable.
15.3.2. Coherence - National Accounts
Not applicable.
15.4. Coherence - internal
CVTS results for a given reference year are based on the same microdata and results are calculated using the same estimation methods, therefore the data are internally coherent.
Not requested by the CR (EU) no. 1153/2014 amending Regulation (EC) no. 198/2006 as regards the data to be collected, and the sampling, precision and quality requirements.
No information is available.
17.1. Data revision - policy
Not applicable.
17.2. Data revision - practice
Not applicable.
17.2.1. Data revision - average size
Not applicable.
18.1. Source data
Continuing Vocational Training Survey (CVTS) is a business statistical survey.
See table 18.1 "Source data and data collection" in annex "RO - QR tables CVTS 2020 (excel)".
18.2. Frequency of data collection
CVTS is carried out every 5 years starting with the reference year 2005.
18.3. Data collection
Self-registration was the method used. The variables were collected online using a web-based application (http://www.insse.ro/cms/files/Site_eSOP_v2/index.html) or collected on paper questionnaires (posted on the INS website) and transmitted by post to territorial statistical offices.
If completed online, the data were collected until 05.05.2021.
If completed on paper, the data were collected until 15.04.2021.
The survey questionnaire is divided into six modules:
A. STRUCTURE AND STRATEGY OF THE ENTERPRISE - questions for all enterprises
B. CONTINUING VOCATIONAL TRAINING - questions for all enterprises
C. CONTINUING VOCATIONAL TRAINING COURSES – questions for the enterprises that provided continuing vocational training courses in year 2020
D. QUALITY, OUTCOMES AND LIMITS IN PROVIDING CONTINUING VOCATIONAL TRAINING - questions for the enterprises that provided continuing vocational training in year 2020
E. REASONS OF ENTERPRISE FOR NOT PROVIDING CONTINUING VOCATIONAL TRAINING - questions for enterprises that didn’t provide continuing vocational training in year 2020
F. INITIAL VOCATIONAL TRAINING - questions for all enterprises
See also table 18.1 "Source data and data collection" in annex "RO - QR tables CVTS 2020 (excel)".
18.4. Data validation
The IT solution for the Continuing Vocational Training Survey (CVTS) was developed for the web portal to find out the measurement and processing errors occurred in different stages of the survey. The application was designed for online data collection and validation.
The IT solution allowed performing online data entry and validation at unit level. Also, the IT solution allowed to perform data entry and validation for questionnaires received on paper by post/email at county level (42 counties in total – NUTS3 level).
18.5. Data compilation
The estimator used for computing the estimated data and the estimated variance is Horvitz-Thomson estimator, as the fraction between the number of units in the sampling frame in the stratum h and the number of respondent units in the sample in the same stratum (Nh/mh).
The estimation is based on the next assumptions:
the response is stochastic and there is a response distribution;
all units within a stratum respond with the same probability.
18.5.1. Imputation - rate
The number of cases imputed was not significant (only 8 enterprises, 2 variables).
The imputations done contributed to a further improvement of the overall estimations.
See table 18.5.1 "Imputation - rate" in annex "RO - QR tables CVTS 2020 (excel)".
The Continuing Vocational Training Survey (CVTS) collects information on enterprises’ investment in the continuing vocational training of their staff. Continuing vocational training (CVT) refers to the education or training measures or activities which are financed in total or at least partly by the enterprise (directly or indirectly). Part financing could include the use of work-time for the training activity as well as financing of training equipment.
The information available from the CVTS is grouped around the following topics:
- Provision of CVT courses and other forms of CVT (training/non-training enterprises)
- CVT strategies
- Participants in CVT courses
- Costs of CVT courses
- Time spent in CVT courses
- Characteristics of CVT courses
- Assessment of CVT activities
The CVTS also collects certain information on initial vocational training (IVT).
The main objective of the Romanian Continuing Vocational Training Survey (CVTS) is to provide information on:
- enterprises’ programs on continuous vocational training (CVT) for their employees;
- the continuous vocational training (CVT) volume and characteristics.
The survey provides information on all types of vocational training provided by the enterprises for their employees.
The design of the survey tools is done in accordance with the recommendations and standards of the European Union under the
- European Parliament and Council Regulation no. 1552/2005 on statistics relating to vocational training in enterprises, implementing Commission Regulation no. 1153/2014 amending Regulation (EC) no. 198/2006 as regards the data to be collected, and the sampling, precision and quality requirements,
- CVTS 6 implementation manual,
- national characteristics.
The Continuing Vocational Training Survey results, in relation with the information provided by other surveys are used by policy makers in establishing the actions and measures for economic and social development strategies as well for implementing the programs on active measures for improving the labour force skills and qualification for increasing the employability.
7 February 2023
The definitions as well as the list of variables for the Continuing Vocational Training Survey variables were developed and adopted in accordance with European standards (http://ec.europa.eu/eurostat/web/education-and-training/methodology): CR no. 1552/2005 on statistics relating to vocational training in enterprises and the implementing CR no. 1153/2014 amending Regulation (EC) no. 198/2006 as regards the data to be collected, and the sampling, precision and quality requirements; CVTS 6 implementation manual but also taking into account the national characteristics.
Enterprise definition is compliant with Council Regulation (EEC) No 696/93.
The unit of selection was the enterprise defined according to the communitarian rules for enterprises statistics as: “the smallest combination of legal units that is an organisational unit producing goods or services, which benefits from a certain degree of autonomy in decision-making, especially for the allocation of its current resources. An enterprise carries out one or more activities at one or more locations. An enterprise may be a sole legal unit”.
The survey provided data for each enterprise, thus the observation unit, in accordance with the requirements of Council Regulation no. 1552/2005 on statistics relating to vocational training in enterprises.
The Romanian Business Register (REGIS) is used as a sampling frame. The Business Register is designed and implemented having as a main data sources the administrative files and statistical sources. The main administrative source of data for REGIS is the Fiscal Register. The Trade Register is used as a consultation data source in order to improve the quality of the register. Other files used as source of data for the REGIS in Romania are: Balance Sheet files, VAT files, REGIS survey for the new enterprises regarding their main activity and size and so on, feedback from other surveys, used as consultation data sources for improving the quality of the register data.
According to the Council Regulations, REGIS contains the following types of statistical units: legal unit, enterprise, and local unit. All the enterprises having the main activity in the section A to S of NACE Rev. 2, whatever their size (number of employees or turnover) are covered.
The Romanian Business Register contains all enterprises, authorities and organisations as well as their local units in Romania that carry out any economic activity irrespective of their size or if they belong to the private or public sector.
In Romania, the CVTS sampling frame is selected from the REGIS and comprises all enterprises created before the reference year, which were still active and belonging to the statistical population of interest, all new enterprises created during the reference year, which were still active and belonging to the statistical population of interest.
There are 52 332 enterprises in the target population.
Variable A2tot (persons employed) refers to the annual average 2020.
The whole territory of the country is covered. Data are available and published at the national level (NUTS0).
The reference year for CVTS 6 is the calendar year 2020.
Detailed description in the following items.
Number, EUR (at Eurostat level); RON (at national level).
The estimator used for computing the estimated data and the estimated variance is Horvitz-Thomson estimator, as the fraction between the number of units in the sampling frame in the stratum h and the number of respondent units in the sample in the same stratum (Nh/mh).
The estimation is based on the next assumptions:
the response is stochastic and there is a response distribution;
all units within a stratum respond with the same probability.
Continuing Vocational Training Survey (CVTS) is a business statistical survey.
See table 18.1 "Source data and data collection" in annex "RO - QR tables CVTS 2020 (excel)".
Every 5 years.
The reference period for CVTS 6 is the calendar year 2020.
All the activities carried out by INS during a year are scheduled through the Activity Plan with several months in advance. Annually, INS issues for the users a catalogue of statistical products and services containing the names, periodicity, short descriptions and release dates for all publications.
The length period of preparing, carrying out and publishing of the final results for CVTS 6 lasted about 22 months (from November 2020 to September 2022).
There is no deviation between national and European concepts and definition. The national version of the questionnaire was design based on the master EU questionnaire. Starting with the reference year 2020 the variables A2tot, A2m and A2f refers to the average number of persons employed, as Eurostat recommended.
Some additional variables/information related to COVID-19 were collected.
For further information see table 15.1 "Comparability - geographical" in annex "RO - QR tables CVTS 2020 (excel)".
The Continuing Vocational Training Survey data are comparable over time, except the indicators A2tot, A2m and A2f which, starting with 2020 refers to the average number of persons employed, as Eurostat recommended.
See table 15.2 "Comparability - over time" in annex "RO - QR tables CVTS 2020 (excel)".