Reference metadata describe statistical concepts and methodologies used for the collection and generation of data. They provide information on data quality and, since they are strongly content-oriented, assist users in interpreting the data. Reference metadata, unlike structural metadata, can be decoupled from the data.
The Continuing Vocational Training Survey (CVTS) collects information on enterprises’ investment in the continuing vocational training of their staff. Continuing vocational training (CVT) refers to education or training measures or activities which are financed in total or at least partly by the enterprise (directly or indirectly). Part financing could include the use of work-time for the training activity as well as financing of training equipment.
Information available from the CVTS is grouped around the following topics:
- Provision of CVT courses and other forms of CVT (training/non-training enterprises)
- CVT strategies
- Participants in CVT courses
- Costs of CVT courses
- Time spent in CVT courses
- Characteristics of CVT courses
- Assessment of CVT activities
The CVTS also collects some information on initial vocational training (IVT).
The Social Security contribution account file was used to obtain the sampling frame, grouping account numbers by the Tax ID Number (NIF) held by the enterprises. The contribution account consists of a homogenous group of workers in the same enterprise, with regard to their Social Security contributions and providing their labour activity is performed in the same province.
The sampling frame does not include the persons that were in the Special Scheme for Self-employed workers. For example:
Self-employed workers who normally, personally and directly, perform an economic activity with lucrative aim, without being subject to a work contract and although they use the remunerative services of other persons.
The spouse and relatives up to the second generation through a blood relationship, friendship and adoption, who collaborate with the autonomous worker on a habitual and direct basis and are not paid.
Professional workers who carry out an activity in self-employment and whose activity requires a membership of a Professional Body.
The members of normal collective associations and the collective members of associations of partners.
Working members of working co-operative societies, when these bodies opt for the Special Scheme for Self-employed workers.
Those who carry out the functions of management, which involve the responsibilities of consultant or administrator, or provide other services for a mercantile company, being paid for the job directly on a permanent basis, provided that they control either directly or indirectly the above mentioned company.
Therefore, our sampling frame refers to employees rather than to persons employed, but we decided to keep comparability with CVTS 5.
Besides, Social Security contribution accounts only include workers covered by the Social Security regime. Workers under the Special Regime for Civil Servants are not included but the majority work in agencies with NACE 84 and 85 and would therefore not be included in the target population.
3.5. Statistical unit
The enterprise, defined as a legal unit with a Tax ID Number.
3.6. Statistical population
Enterprises with 10 or more employees (with 5 or more employees in the national survey), belonging to certain NACE categories.
The total number of enterprises in the target population with 10 or more average number of employees in 2020 is 136 062 (308 934 enterprises with 5 or more average number of employees in 2020 in the national survey).
Variable A2tot (persons employed) refers to 31 December 2020.
3.7. Reference area
The two Autonomous Cities (Ceuta and Melilla), amounting for approximately 0.2% of the enterprises, are not included in the frame.
3.8. Coverage - Time
Data are available at national level for 1993 (CVTS 1) (only paper publication), 1999 (CVTS 2), 2005 (CVTS 3), 2010 (CVTS 4), 2015 (CVTS 5) and 2020 (CVTS 6).
3.9. Base period
Not applicable.
Number, EUR.
The reference year for CVTS 6 is the calendar year 2020.
6.1. Institutional Mandate - legal acts and other agreements
At European level
Basic legal act: Regulation (EC) No 1552/2005 of the European Parliament and the Council
Implementing act: Commission Regulation (EU) No 1153/2014, amending Commission Regulation (EC) No 198/2006
At national level
Programa Anual 2021 del Plan Estadístico Nacional 2021-2024
6.2. Institutional Mandate - data sharing
Not applicable.
7.1. Confidentiality - policy
The Statistical Law 11/1989 specifies that the Statistical Organizations cannot publish, or make otherwise available individual data or statistics that would enable the identification of data for any individual person or entity.
Regulation (EC) 223/2009 on European statistics stipulates the need to establish common principles and guidelines ensuring the confidentiality of data used for the production of European statistics and the access to those confidential data.
7.2. Confidentiality - data treatment
The questionnaire includes information of the legislative measures which prevent unauthorised disclosure of data that identify a person or economic entity.
Persons outside the Ministry of Employment and Social Economy that work on the survey must sign a document on compliance with the duty of statistical confidentiality.
8.1. Release calendar
For the publication of the data of the national survey there is a release calendar that indicates: disseminatetheinformationnolaterthanDecember31,2022.
The scope of dissemination is to the public. The release policy determines the dissemination of statistical data to all users at the same time.
Users know the publication date in advance by checking the release calendar. As this calendar indicates the dissemination of information no later than day ---, if it is disseminated earlier, a notice is inserted on the website of the Ministry's statistics informing of this publication.
Every 5 years.
10.1. Dissemination format - News release
Press release has been released with the Spanish survey results.
A notice of the publication of the Spanish survey results has been included in the Ministry of Employment and Social Economy web page.
10.2. Dissemination format - Publications
Data is available in the Ministry of Employment and Social Economy Statistics web page. The data is provided in an excel file. In addition, a summary is published with graphics in pdf.
10.3. Dissemination format - online database
No on-line databases.
10.3.1. Data tables - consultations
Not applicable.
10.4. Dissemination format - microdata access
It is planned to provide anonymised microdata files on request.
10.5. Dissemination format - other
No other data dissemination is done.
10.5.1. Metadata - consultations
Not applicable.
10.6. Documentation on methodology
The methodology of the survey is available on the statistics website of the Ministry of Employment and Social Economy with the tables with results.
10.6.1. Metadata completeness - rate
Not applicable.
10.7. Quality management - documentation
It is mentioned briefly in the methodology.
11.1. Quality assurance
The sample size allows for offering indicators to economic activity and size levels, within reasonable sampling errors.
There are established controls for detecting and correcting errors, for the purpose of guaranteeing the quality of all the statistical process.
11.2. Quality management - assessment
The internet questionnaire and the application for recording questionnaires included validation controls: inconsistency controls (values recorded should correspond to the parameters specified for each variable and should be mutually coherent) and atypical value controls (detection of possible but anomalous values and detection of possible values but outside certain margins of control). In the case of the internet questionnaire, error messages flashed up on the screen so that errors could be corrected, as well as messages to confirm the validity of values detected as atypical. In the case of the recording application and for certain atypical elements not included on the internet questionnaire but validated subsequently, a validation team called respondents to establish the correct values.
All the questionnaires received on paper format (completed on paper format and received via mail, fax, or email) were recorded, and this recording was supervised in 100% of the cases.
All the corrected questionnaires were reviewed by the team of supervisors and coordinators. The control checks in this stage focused on the following aspects:
Verification of the process followed throughout the data cleaning process to ensure it was suitably conducted. Thus, it was verified whether the agent had analysed the information in the questionnaire. Contacts made with the respondent were also reviewed. And the existence of a detailed registry regarding the collection of the entire process carried out during the questionnaire data cleaning was also confirmed.
Specifically in relation with the data cleaning process, the data corrections that were made and the rationale behind these corrections were analysed, as well as whether these were correctly reflected in the questionnaire.
Once the data cleaning process had been completed, in the cases where there were still atypical values in the questionnaire, each one was analysed to check that the observations indicated by the agent justifying it were appropriate and comprehensible.
12.1. Relevance - User Needs
The main users are policy makers at European and national level, enterprises, international organisations, researchers and students.
12.2. Relevance - User Satisfaction
There is not a user satisfaction survey for CVTS. Data and survey methodology are published on Internet. Anonymised microdata will be provided on request, on signature of a document containing the conditions for it.
12.3. Completeness
The final dataset covers all NACE sectors, enterprise size groups and variables as requested in the CVTS 6 legislation.
12.3.1. Data completeness - rate
Not applicable.
13.1. Accuracy - overall
The sample design tries to minimise the sampling errors, and the different survey processes are aimed at eliminating, or reducing as much as possible, the errors thereof, both in the collection phase (response rate and filtering control) and in the subsequent editing and imputation phases.
13.2. Sampling error
Stratified sampling was used, and the sampling units were enterprises comprised under the scope of the survey.
The sample was designed using stratified sampling. Strata were defined by economic activity, enterprise size (average number of employees in 2020) and Autonomous Community as follows:
Size: 10-49 employees, 50-249 employees, 250-499 employees and 500 or more employees (in the national survey, a 5-9 employees stratum was also included)
17 Autonomous Communities
The research is exhaustive on enterprises with 500 or more employees.
In strata where the investigation is not exhaustive, the sample has been distributed on the basis of the following criteria:
A maximum relative error of 20% is ensured for a proportion in each stratum.
A maximum relative error of 5% is ensured for an absolute value variable in each stratum.
A possible response rate of 85% has been taken into account for enterprises in each stratum.
In the stratum 250-499 employees, while not all units were investigated, the sample size given by the initial assignation has been increased notably.
The elevation factor for each unit j of the stratum corresponding to the sample design of the survey is:
This factor was corrected to take non-response into account, being multiplied by the inverse of the response rate for the stratum to give the final elevation factor:
where is the effective sample size for the stratum.
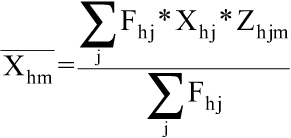
We thereby obtain the following estimator of a characteristic X for domain m:
where
j = questionnaire
h = initial stratum
F = weighting factor
Z = random variable that takes the values: 1, if j Є m, and zero otherwise
The estimated variance is:
Where
The variation coefficient (in %) is:
The software employed to calculate the estimated variance is the SAS programming language.
13.2.1. Sampling error - indicators
See table 13.2.1 "Sampling errors - indicators" in annex "ES - QR tables CVTS 2020 (excel)".
13.3. Non-sampling error
See items 13.3.1 - 13.3.4 below.
13.3.1. Coverage error
The Social Security contribution account file was used to obtain the frame, grouping account numbers by the Tax ID Number (NIF) held by the enterprises. The contribution account consists of a homogenous group of workers in the same enterprise with regard to their Social Security contributions.
The sampling frame did not include the persons that were in the Special Scheme for Self-employed workers. For example:
Self-employed workers who normally, personally and directly, perform an economic activity with lucrative aim, without being subject to a work contract and although they use the remunerative services of other persons.
The spouse and relatives up to the second generation through a blood relationship, friendship and adoption, who collaborate with the autonomous worker on a habitual and direct basis and are not paid.
Professional workers who carry out an activity in self-employment and whose activity requires a membership of a Professional Body.
The members of normal collective associations and the collective members of associations of partners.
Working members of working co-operative societies, when these bodies opt for the Special Scheme for Self-employed workers.
Those who carry out the functions of management, which involve the responsibilities of consultant or administrator, or provide other services for a mercantile company, being paid for the job directly on a permanent basis, provided that they control either directly or indirectly the above mentioned company.
Besides, Social Security contribution accounts only include workers covered by the Social Security regime. Workers under the Special Regime for Civil Servants are not included but the majority work in agencies with NACE 84 and 85 and would therefore not be included in the target population.
See table 13.3.1 "Coverage error" in annex "ES - QR tables CVTS 2020 (excel)".
13.3.1.1. Over-coverage - rate
In the Spanish survey the release’s scope includes enterprises with 5 or more employees in annual average, so the enterprises with 5 or more employees in annual average but less than 10 employees at 12/31/2020 are ineligible for the CVTS 6 but not for the Spanish survey.
See table 13.3.1.1 "Over-coverage - rate" in annex "ES - QR tables CVTS 2020 (excel)".
13.3.1.2. Common units - proportion
Not applicable.
13.3.2. Measurement error
Questionnaires were collected via web portal (97%), as well as via paper format (3%), a category that includes respondents who completed the questionnaire on paper format and then scanned it and emailed or faxed it.
In relation with the online questionnaire, several tests oriented at checking the correct formulation and presentation of the different questionnaire sections and subsections were conducted to ensure there were no errors, and that everything could be correctly viewed.
Similarly, both all the norms and inconsistencies that had to be applied when completing the questionnaire as well as the multiple questionnaire flows and implemented screens were reviewed and tested. The correct writing and recording of the data on the database was also verified.
All the questionnaires received on paper format (completed on paper format and received via mail, fax, or email) were recorded, and this recording was supervised in 100% of the cases.
The web questionnaire and the application for recording questionnaires included: validation controls (values recorded should correspond to the parameters specified for each variable), inconsistency controls (questionnaire variables should be mutually coherent) and atypical value controls (detection of possible but anomalous values and detection of possible values but outside certain margins of control). In the case of the web questionnaire, error messages flashed up on the screen so that errors could be corrected, as well as messages to confirm the validity of values detected as atypical. In the case of the recording application and for certain atypical elements not included on the internet questionnaire but validated subsequently, a validation team called respondents to establish the correct values.
Examples of correction of measurement errors:
Total number of hours employed in training courses for employees: some respondents include the number of hours of one employee and not the total number of employees’ hours, thus this had to be modified by respondents in the data cleaning process.
Costs incurred by the company to provide training courses to its workers. Companies had difficulty excluding VAT although they were asked to enter the cost without VAT and in another column the VAT. This had to be modified by respondents in the data cleaning process.
13.3.3. Non response error
The variable D2a had a very high non-response rate.
Also, other variables more subject to item non-response are: C4, C7bFLAG, C7cFLAG and C7dFLAG.
Some enterprises have made an estimation of the value of this variables because they insisted that they did not have the exact information.
All enterprises were sent a cover letter by mail. The cover letter sent to enterprises contained instructions on how to complete the survey over the Internet.
Afterwards, a first telephone call was made to all enterprises, to confirm that the letter was received, localise personnel responsible for filling out the survey, to give information on deadlines for its completion and to remind enterprises that the survey is mandatory.
More calls were made to units who delayed returning the survey as deadlines approached. Without these calls and visits to remind enterprises of deadlines and ask them to return the surveys, it would not have been possible to meet coverage targets.
13.3.3.1. Unit non-response - rate
Enterprises returning incidents were substituted by a reserve sample unit from the same stratum. It was tried to replace all the enterprises that did not answer.
The elevation factor was corrected to take final non response into account. It was multiplied by the inverse of the response rate for the stratum, to give the following final elevation factor, where is the effective sample size for the stratum:
See table 13.3.3.1 "Unit non-response - rate" in annex "ES - QR tables CVTS 2020 (excel)".
13.3.3.2. Item non-response - rate
See table 13.3.3.2 "Item non-response - rate" in annex "ES - QR tables CVTS 2020 (excel)".
13.3.4. Processing error
The web questionnaire and the application for recording questionnaires included: validation controls (values recorded should correspond to the parameters specified for each variable), inconsistency controls (questionnaire variables should be mutually coherent) and atypical value controls (detection of possible but anomalous values and detection of possible values but outside certain margins of control). In the case of the web questionnaire, error messages flashed up on the screen so that errors could be corrected, as well as messages to confirm the validity of values detected as atypical. In the case of the recording application, and for certain atypical elements not included on the internet questionnaire but validated subsequently, a validation team called respondents to establish the correct values.
13.3.5. Model assumption error
None.
14.1. Timeliness
The reference period for the Spanish survey is 2020.
14.1.1. Time lag - first result
Data was published in October 2022.
14.1.2. Time lag - final result
Data was published in October 2022.
14.2. Punctuality
Countries should transmit data to Eurostat no later than 18 months after the end of the reference year.
See table 14.2 "Project phases - dates" in annex "ES - QR tables CVTS 2020 (excel)".
14.2.1. Punctuality - delivery and publication
Not applicable.
15.1. Comparability - geographical
See table 15.1 "Comparability - geographical" in annex "ES - QR tables CVTS 2020 (excel)".
No additional variables related to COVID-19 were collected.
15.1.1. Asymmetry for mirror flow statistics - coefficient
Not applicable.
15.2. Comparability - over time
See table 15.2 "Comparability - over time" in annex "ES - QR tables CVTS 2020 (excel)".
15.2.1. Length of comparable time series
Not applicable.
15.3. Coherence - cross domain
See table 15.3 "Coherence - cross-domain" in annex "ES - QR tables CVTS 2020 (excel)".
Some differences between Structural Business Statistics and CVTS 6:
1) Framework
Structural Business Statistics: Central Business Register of the National Institute of Statistic of Spain.
CVTS 6: The Social Security contribution account file was used to obtain the frame, grouping account numbers by the Tax ID Number (NIF) held by the enterprises.
2) Enterprise
Structural Business Statistics: an organisation unit that produces goods and services, and that enjoys a certain autonomy in decision-making, mainly at the time of using the available current resources. The enterprise carries out one or more economic activities in one or more places.
CVTS 6: a legal unit with a Tax ID Number
3) Economic activity
Structural Business Statistics: the main activity is that which generates the greatest added value. If there are difficulties in calculating added value when various activities are carried out, the activity which generates the greatest turnover is considered the main activity or, failing that, that which employs the greatest number of persons.
CVTS 6: the main activity is that which employs the greatest number of persons according to the information of Social Security.
4) Persons employed / employees
Structural Business Statistics: average number of persons employed in 2020
CVTS 6: employees on December 31, 2020. Excluded are self-employed workers, unpaid family workers, persons with training contract, apprentices, etc.
15.3.1. Coherence - sub annual and annual statistics
Not applicable.
15.3.2. Coherence - National Accounts
Not applicable.
15.4. Coherence - internal
CVTS results for a given reference year are based on the same microdata and results are calculated using the same estimation methods, therefore the data are internally coherent.
In order to reduce the response burden of the respondent and the costs, the Spanish CVTS has been collected together in a single questionnaire with the Annual Labour Survey.
The estimation of the budgetary credit necessary to finance CVTS 6 comes to a total of 350 000 euros but the cost was of 238 695 euros.
The time taken to complete the questionnaire on average in enterprises with 10 or more employees is estimated in 49 minutes.
17.1. Data revision - policy
Not applicable.
17.2. Data revision - practice
Not applicable.
17.2.1. Data revision - average size
Not applicable.
18.1. Source data
See table 18.1 "Source data and data collection" in annex "ES - QR tables CVTS 2020 (excel)".
18.2. Frequency of data collection
Every 5 years.
18.3. Data collection
See also table 18.1 "Source data and data collection" in annex "ES - QR tables CVTS 2020 (excel)".
18.4. Data validation
Questionnaires were received mainly via internet (97%). The rest were received by email, fax or mail. The internet questionnaire and the application for recording questionnaires included validation controls: inconsistency controls (values recorded should correspond to the parameters specified for each variable and should be mutually coherent) and atypical value controls (detection of possible but anomalous values and detection of possible values but outside certain margins of control). In the case of the internet questionnaire, error messages flashed up on the screen so that errors could be corrected, as well as messages to confirm the validity of values detected as atypical. In the case of the recording application and for certain atypical elements not included on the internet questionnaire but validated subsequently, a validation team called respondents to establish the correct values.
The main error responses detected were:
The enterprises had difficulties to fill the total number of hours worked and the total labour cost.
Data of costs for the provision of CVT courses and its breakdown were initially badly answered in many cases. Besides, the enterprises had difficulty excluding VAT.
The enterprise provides internal CVT courses but does not fill labour costs of internal trainers for CVT courses in question C7, or otherwise, the enterprise does not provide internal CVT courses but fills labour costs of internal trainers.
The enterprise provides external CVT courses but does not fill fees and payments of courses for persons employed, or otherwise the enterprise does not provide external CVT courses but fills fees and payments of courses.
Other problem was caused with the no active companies in 2020 because of COVID-19 pandemic.
18.5. Data compilation
Not applicable.
18.5.1. Imputation - rate
See table 18.5.1 "Imputation - rate" in annex "ES - QR tables CVTS 2020 (excel)".
The Continuing Vocational Training Survey (CVTS) collects information on enterprises’ investment in the continuing vocational training of their staff. Continuing vocational training (CVT) refers to education or training measures or activities which are financed in total or at least partly by the enterprise (directly or indirectly). Part financing could include the use of work-time for the training activity as well as financing of training equipment.
Information available from the CVTS is grouped around the following topics:
- Provision of CVT courses and other forms of CVT (training/non-training enterprises)
- CVT strategies
- Participants in CVT courses
- Costs of CVT courses
- Time spent in CVT courses
- Characteristics of CVT courses
- Assessment of CVT activities
The CVTS also collects some information on initial vocational training (IVT).
The Social Security contribution account file was used to obtain the sampling frame, grouping account numbers by the Tax ID Number (NIF) held by the enterprises. The contribution account consists of a homogenous group of workers in the same enterprise, with regard to their Social Security contributions and providing their labour activity is performed in the same province.
The sampling frame does not include the persons that were in the Special Scheme for Self-employed workers. For example:
Self-employed workers who normally, personally and directly, perform an economic activity with lucrative aim, without being subject to a work contract and although they use the remunerative services of other persons.
The spouse and relatives up to the second generation through a blood relationship, friendship and adoption, who collaborate with the autonomous worker on a habitual and direct basis and are not paid.
Professional workers who carry out an activity in self-employment and whose activity requires a membership of a Professional Body.
The members of normal collective associations and the collective members of associations of partners.
Working members of working co-operative societies, when these bodies opt for the Special Scheme for Self-employed workers.
Those who carry out the functions of management, which involve the responsibilities of consultant or administrator, or provide other services for a mercantile company, being paid for the job directly on a permanent basis, provided that they control either directly or indirectly the above mentioned company.
Therefore, our sampling frame refers to employees rather than to persons employed, but we decided to keep comparability with CVTS 5.
Besides, Social Security contribution accounts only include workers covered by the Social Security regime. Workers under the Special Regime for Civil Servants are not included but the majority work in agencies with NACE 84 and 85 and would therefore not be included in the target population.
The enterprise, defined as a legal unit with a Tax ID Number.
Enterprises with 10 or more employees (with 5 or more employees in the national survey), belonging to certain NACE categories.
The total number of enterprises in the target population with 10 or more average number of employees in 2020 is 136 062 (308 934 enterprises with 5 or more average number of employees in 2020 in the national survey).
Variable A2tot (persons employed) refers to 31 December 2020.
The two Autonomous Cities (Ceuta and Melilla), amounting for approximately 0.2% of the enterprises, are not included in the frame.
The reference year for CVTS 6 is the calendar year 2020.
The sample design tries to minimise the sampling errors, and the different survey processes are aimed at eliminating, or reducing as much as possible, the errors thereof, both in the collection phase (response rate and filtering control) and in the subsequent editing and imputation phases.
Number, EUR.
Not applicable.
See table 18.1 "Source data and data collection" in annex "ES - QR tables CVTS 2020 (excel)".
Every 5 years.
The reference period for the Spanish survey is 2020.
See table 15.1 "Comparability - geographical" in annex "ES - QR tables CVTS 2020 (excel)".
No additional variables related to COVID-19 were collected.
See table 15.2 "Comparability - over time" in annex "ES - QR tables CVTS 2020 (excel)".