 |
|
 |
| For any question on data and metadata, please contact: Eurostat user support |
|
|||
| 1.1. Contact organisation | INE Spain |
||
| 1.2. Contact organisation unit | S.G. Short-Term Statistics |
||
| 1.5. Contact mail address | Paseo de la Castellana, 183 28071 Madrid Spain |
||
|
|||
| 2.1. Metadata last certified | 14/03/2023 | ||
| 2.2. Metadata last posted | 14/03/2023 | ||
| 2.3. Metadata last update | 14/03/2023 | ||
|
|||
| 3.1. Data description | |||
The objective of the Industrial Turnover Indices (ITI, in Spanish Índices de Cifras de Negocios-ICN) is to show the monthly evolution of the activity of the companies that are part of the industrial sector in Spain, measuring this evolution through its turnover. This survey is aimed at industrial local units that report their turnover. The results of this statistical operation are presented as indices that allow to measure variations taking as reference the base year 2015. Indices and variation rates (monthly, annual, year-to-date average) are published monthly for the following breakdown: - Different levels of disaggregation for activities classified using the National Classification of Economic Activities (CNAE-2009): sections, divisions and certain sets of groups. CNAE-2009 is the Spanish version of the Statistical Classification of Economic Activities in the European Community (NACE Rev.2) and has been compiled according to the conditions set out in the Regulation establishing NACE Rev.2. - Main Industrial Groupings (MIGs): consumer goods (total and broken down in durable consumer goods and non-durable consumer goods), capital goods, intermediate goods and energy. - Autonomous Communities (NUTS2 except ES63 and ES64) - Markets: domestic and non-domestic, and within it Euro and non-Euro. Most of the information previously mentioned is published, not only unadjusted, but also calendar adjusted and seasonally and calendar adjusted. |
|||
| 3.2. Classification system | |||
Activities of local units are codified using four digits of the CNAE-2009, which is the national version of NACE Rev. 2.0. The geographical classification used is NUTS, at NUTS 2 level, for stratification and dissemination. The Main Industrial Groupings classification (MIGs) is also used for dissemination purposes. |
|||
| 3.3. Coverage - sector | |||
Activities covered: The Industrial Turnover Indices covers the following sections of the CNAE-2009: B: Mining and quarrying, with the exception of division 09 (Mining support service activities) that is not relevant in the Spanish industry. C: Manufacturing. Size classes covered: There is no threshold, for any variable, in the register. In the ITI, cut-off sampling on the basis of turnover is used and the sampled units cover in each stratum (NUTS2-division/subdivision) at least 80% of the total turnover estimated in the Industrial Companies Survey. |
|||
| 3.4. Statistical concepts and definitions | |||
The definition of net turnover is the one included in the Annex IV of the EBS General Implementing Act (Commission Implementing Regulation 2020/1197 laying down technical specifications and arrangements pursuant to Regulation (EU) 2019/2152 of the European Parliament and of the Council on European business statistics repealing 10 legal acts in the field of business statistic). NET TURNOVER Net turnover consists of all income arising during the reference period in the course of ordinary activities of the statistical unit, and is presented net of all price reductions, discounts and rebates granted by it. Income is defined as increases in economic benefits during the reference period in the form of inflows or enhancements of assets or decreases of liabilities that result in increases in equity, other than those relating to contributions from equity participants.
Net turnover excludes all taxes. The indices of domestic and non-domestic (euro area and non-euro area) turnover require the turnover to be split according to the first destination of the product based on the change of ownership (whether or not there are also corresponding physical movements of goods across frontiers). The destination is determined by the residency of the third party that purchased the goods and services. The domestic market is defined as third parties resident in the same national territory as the observation unit. Non-domestic turnover is further sub-divided into turnover dispatched to euro-zone countries and all other non-domestic turnover. |
|||
| 3.5. Statistical unit | |||
The Annex II of the EBS-Regulation (Regulation (EU) 2019/2152 of the European Parliament and of the Council on European business statistics, repealing 10 legal acts in the field of business statistics), requires the use of KAU (kind of activity unit) as observation units for indicators in the industry. However, given the lack of an appropriate framework for these units, Spain collects the information from local units rather than from KAUs. The reporting unit and the observation unit is the same. |
|||
| 3.6. Statistical population | |||
The statistical population comprises the observation units (KAUs) operating in the CNAE-2009 sections mentioned below: B: Mining and quarrying, except division 09, and C: Manufacturing The frame used to identify the units is the Central Business Register (CBR). According to the CBR in year 2022 there were 207,691 local units in the Spanish territory whose main activity belongs to sections above mentioned. The sample size is approximately 12,000 local units. |
|||
| 3.7. Reference area | |||
The geographical coverage of the ITI is the whole Spanish territory excluding the Autonomous Cities of Ceuta, ES63, and Melilla, ES64, as the industrial activity is non significant. The countries covered in the EA aggregates are those indicates by the Comission. The list of countries is updated every time a new country joins the euro-zone. The turnover of the units located outside the Spanish territory are not included in the aggregates. Even if the output of these units is attributed on to a national unit because of intellectual property rights. The sampled units located in Spain provide their total turnover. Some of these units produce only in Spain and others have production inside and outside. The latter don't include information about the share of "foreign" activities included. |
|||
| 3.8. Coverage - Time | |||
Data are available since January 2002, and it was first published in base 2000. In 2009, the data were rebased to base 2005. Base 2010 was implemented since the first publication of the indices corresponding to reference month January 2013. As from the first dissemination of 2018 data, the data was rebased to base 2015. The following breakdown for the Base 2010 ITI data is available since January 2002 data: - Unadjusted, calendar adjusted data and seasonally and calendar adjusted data; - Totals, MIGs and CNAE 2009 sections and divisions; Base 2010 ITI data are also available by NUTS2 since January 2010. In base 2015 the division 07 data is included in the aggregation calculations. The length of the time series available is the same for nationally and for transmitted to Eurostat series. |
|||
| 3.9. Base period | |||
Commission Implementing Regulation 2020/1197 laying down technical specifications and arrangements pursuant to Regulation (EU) 2019/2152 of the European Parliament and of the Council on European business statistics repealing 10 legal acts in the field of business statistic (General Implementing Act), in its Annex VII, sets the rules for the rebasing process. 2015 is the first base year, and that all indices must be rebased on the new base year within three years after the end of each new base year. For this reason as from 2018 the data is disseminated in base 2015. For this base we have:
The base and reference year are the same at national level and for the data transmitted to Eurostat. |
|||
|
|||
Indices, percentage changes (%). |
|||
|
|||
The reference period is the month. |
|||
|
|||
| 6.1. Institutional Mandate - legal acts and other agreements | |||
The legal basis for the STS indicators are Regulation (EU) 2019/2152 of the European Parliament and of the Council on European business statistics, repealing 10 legal acts in the field of business statistics (EBS-Regulation) and Commission Implementing Regulation 2020/1197 laying down technical specifications and arrangements pursuant to Regulation (EU) 2019/2152 of the European Parliament and of the Council on European business statistics repealing 10 legal acts in the field of business statistic (General Implementing Act). Before the EBS, the STS legal base was Council Regulation No 1165/98 of 19 May 1998 concerning short-term statistics, amended by Regulation No 1158/2005 of 6 July 2005 concerning short-term statistics. The Article 25.3 of Regulation (EU) 2019/2152 mentions that Regulation (EC) No 1165/98 is repealed with effect from 1 January 2024. The classification by main industrial groupings (MIGS) is set out in Annex II of Reg. 2020/1197. According to the Spanish legislation, 'Industrial Turnover Indices' is a compulsory statistic. The compilation and dissemination of data are governed by the Statistical Law No 12/1989 "Public Statistical Function" of May 9, 1989, and Law No 4/1990 of June 29 on "National Budget of State for the year 1990" amended by Law No 13/1996 "Fiscal, administrative and social measures" of December 30, 1996, makes compulsory all statistics included in the National Statistics Plan. The Plan contains the statistics that must be developed in the four year period by the State General Administration's services or any other entity dependent on it. All statistics included in the National Statistics Plan are statistics for state purposes and are obligatory. The National Statistics Plan 2021-2024, approved by Royal Decree 410/2016, of October 31st, is the Plan currently implemented. This statistical operation has governmental purposes, and it is included in the National Statistics Plan 2021-2024, which is available in the following link: |
|||
| 6.2. Institutional Mandate - data sharing | |||
INE Spain provides access to all the non-confidential data through its website. In order to produce the aggregates for the European Union, ITI data are transmitted to Eurostat every month on the press release day. Eurostat is the only international organisation receiving ITI data. The exchanges of information between the INE and the rest of the State statistical offices (Ministerial Departments, independent bodies and administrative bodies depending on the State General Administration), or between these offices and the Autonomous Communities Statistical Offices, are regulated in the Statistical Law No 12/1989 "Public Statistical Function". This law also regulates the mechanisms of statistical coordination, and concludes cooperation agreements between the different offices when necessary. |
|||
|
|||
| 7.1. Confidentiality - policy | |||
ITI is a statistical operation included in the National Statistics Plan 2021-2024, therefore, it is subject to Statistics Law No 12/1989 "Public Statistical Function" and, consequently, data is protected by the principle of statistical confidentiality in all the storages of production. Regulation (EC) No 223/2009 of the European Parliament and of the Council on European statistics stipulates the need to establish a guideline and common principles to ensure confidentiality of data used during the production of European statistics and also when accessing the confidential data. INE Spain Confidentiality Policy can be found in the following link: http://www.ine.es/en/ine/codigobp/politica_confidencialidad_en.pdf |
|||
| 7.2. Confidentiality - data treatment | |||
Data are only published down to an activity level at which they are not confidential. To establish which activities are confidential, criteria are based both on the number of units (bigger than 3) of each activity and the concentration of turnover of the most important units (lower than 60% in the stratum). |
|||
|
|||
| 8.1. Release calendar | |||
An advance notice of release dates for the following year is drawn up in the last quarter of each year. This release calendar contains the dissemination dates of Industrial Turnover Indices (ITI). |
|||
| 8.2. Release calendar access | |||
INE Spain release calendar is available in the following website: http://www.ine.es/en/daco/daco41/calen_en.htm. |
|||
| 8.3. Release policy - user access | |||
All users have access to the data since 9 am on the press release day. The data are disseminated at INE Spain website (http://www.ine.es/dyngs/INEbase/en/operacion.htm?c=Estadistica_C&cid=1254736148782&menu=ultiDatos&idp=1254735576715). Users are informed that the data are being released via Twitter and also at INE Spain website "News flash" section. In accordance with the European Statistics Code of Practice, all users have access to the same statistical information at the same time, and any privileged pre-release access to any outside user must be limited, controlled and made public. In this sense, a few hours before its official publication, some statistical information of the INE is transmitted, under embargo, to the appointed body, the Secretariat of State for Economic Affairs and Business Support of the Ministry of Economy and Competitiveness, for the purpose of providing sufficient time for their responsible parties to prepare answers to any possible questions that journalists might ask them. The release policy doesn't determine the time at which data are disseminated. The dissemination policy is available in the following link: http://www.ine.es/en/ine/codigobp/politica_difusion_en.pdf The same release policy is applied to national releases and to transmissions to Eurostat. Data are transmitted in SDMX-ML format to Eurostat at the moment of the national release. Divisions 06 and 07 of CNAE-2009 data, due to disclosure control policy, are not nationally disseminated to users, but they are transmitted to Eurostat flagged as confidential. No other international organisation receives the ITI data. |
|||
|
|||
Data are disseminated to national users and transmitted to Eurostat on a monthly basis. |
|||
|
|||
| 10.1. Dissemination format - News release | |||
Monthly news releases are published at 9 a.m. at INE website. The press release contains information about MIGs and sections B and C and their divisions of CNAE-2009. Unadjusted data, calendar adjusted data and seasonally and calendar adjusted data are disseminated, including the indices, CA and SA&CA monthly rates and annual rates and gross annual rates. Data (indices and rates) at level NUTS2 and for markets is also included in the press release. News release of last data published is available in the link: http://www.ine.es/dyngs/INEbase/en/operacion.htm?c=Estadistica_C&cid=1254736148782&menu=ultiDatos&idp=1254735576715 All press releases are available in the following link: https://www.ine.es/dyngs/Prensa/en/notasPrensa.htm |
|||
| 10.2. Dissemination format - Publications | |||
The ITI monthly data can be found in the ITI press release:
The official release is not accompanied by any comment from any Goverment Ministry. |
|||
| 10.3. Dissemination format - online database | |||
Information related to Industrial Turnover Indices can be found in the following link: The ITI data are disseminated monthly. The activity coverage is B and C sections and their divisions, except 09, in CNAE-2009. The data series start in January 2002 and the available breakdowns in Base 2015 are: - Unadjusted, calendar adjusted and seasonally and calendar adjusted indices; - Annual, monthly and year to date rates; - MIGs; - NUTS2 (since January 2010 just for gross data); - General index by markets (just for gross data). Some links to these breakdowns: - Latest data: chart containing the latest available data: - Information about indices, monthly, annual and year-to-date variation rates for different levels of disaggregation: - The structure of weights used in the index calculation: - Series of data in previous bases: In 2022 the total number of accesses to the ITI website was AC1=88,315. |
|||
| 10.4. Dissemination format - microdata access | |||
Microdata are not disseminated on the website and they are not provided to any public or private institution. |
|||
| 10.5. Dissemination format - other | |||
Data is transmitted to Eurostat according to the format and breakdowns required. Sampled units that fill in the online questionnaire can request a customized report containing a comparative between the annual rates of the last twelve months of the unit and the stratum (NUTS2-division/subdivision) it belongs to. If any user doesn't find on the online database what s/he is looking for , s/he can ask for a customized report. The data asked for is analized, and if the statistical disclosure control rules are met, tha data can be sent to the user. |
|||
| 10.6. Documentation on methodology | |||
All the documentation on methodology (reference metadata report, methodology and classifications used) is available on the following link: http://www.ine.es/dyngs/INEbase/en/operacion.htm?c=Estadistica_C&cid=1254736148782&menu=metodologia&idp=1254735576715 The metadata completeness rate is AC3=100% and in 2022 the number of metadata consultations on the website is AC2=1,481. |
|||
| 10.7. Quality management - documentation | |||
The ITI is carried put according to the quality policy set out by INE Spain. This quality policy is in line with the European Code of Practice. The quality guidelines followed at INE Spain can be found in the link: http://www.ine.es/en/ine/codigobp/directrices_calidad_ine_en.pdf INE Spain quality management is available in the following link: |
|||
|
|||
| 11.1. Quality assurance | |||
The general quality assurance framework at INE Spain is available in the link: According to INE Spain quality policy, that includes the ESCoP as basis, the following activities have been implemented to carry out the ITI: Quality controls and data editing take place throughout the whole process. Data collection can be carried out with an e-questionnaire that detects invalid values, restrains the values of the variables and includes edits and workflows while the respondent fills in the questionnaire. To reduce the non-response rate the sampled units are contacted by mail and/or telephone during the data collection period. Sampled units can be fined if they don't fulfil their statistical obligations. Once the data is collected a selective editing phase takes place at microdata level. Estimation of non-response is the following step before the macroediting phase. Quality is also guaranteed by comparing ITI output with the Industrial Production Index, Industrial Price Index and Industrial New Orders Received Index. To obtain the frame of the survey both the PRODCOM and the Industrial Companies Survey are used. |
|||
| 11.2. Quality management - assessment | |||
The main strengths of this statistical operation are: coverage, timeliness and comparability. In fact, in base 2010, the following enhancements were introduced: - Broader geographical and conceptual breakdown (for the first time, data broken down by markets and NUTS2 were published). - Seasonally and calendar effects adjusted indices were published. In base 2000 only unadjusted series were disseminated and in base 2005, in addition, calendar adjusted series were also published. Since base 2015 the division 07 is included in the index calculations. |
|||
|
|||
| 12.1. Relevance - User Needs | |||
Industrial Turnover Indices provide information used by different users and serve different purposes. Among the main users it is worth noting:
In base 2010, for the first time, main series were published not only calendar adjusted but also seasonally and calendar adjusted, which allows to satisfy, among others, the information requirements of Eurostat. |
|||
| 12.2. Relevance - User Satisfaction | |||
To provide guidance about the opinion that users have on Industrial Turnover Indices (ITI), surveys of user satisfaction carried out by INE Spain can be used. These user satisfaction surveys value, among others, the industrial sector. These surveys are carried out every three years since 2007. The general rate achieved by the Industrial sector in 2019 satisfaction survey was 3.74 out of 5. The national user surveys' results is available in the link:
Moreover, people in charge of the survey stay in contact with the main users and respondents in order to attend any specific needs of information. |
|||
| 12.3. Completeness | |||
Industrial Turnover Indices provide all the information required by the national and international regulations related to this statistical operation, so the rate of available statistics is R1=100%. ITI covers all the relevant economic activities in Spain. As the sampling method is cut-off, the companies with a small turnover are excluded from the frame. The ITI series start in January 2002, so there is no data for years 2000 and 2001. |
|||
|
|||
| 13.1. Accuracy - overall | |||
The accuracy is tackled at National and Community levels by eliminating non-sampling errors as much as possible and studying and analyzing revisions. The main sources of error are non-response and overcoverage. There is no evidence that the response rate is distributed in a way that generates a bias in the index or its evolution. In addition, steps are taken to improve the updating of the sample, replacing, in a more agile way, units that have been deleted from the sample for new ones. Due to the timeliness of the survey in the provisional data release the size-weighted non-response rate is 2%. The questionnaires keep being required two months after the end of the reference month. If the respondent doesn't send it back by then he is fined. This way new questionnaires are recorded after the first publication of the results and the size-weighted non-response rate falls to 1%. Another consequence is that the published results are updated monthly including both new or edited data. Since the cutoff sampling is used, best sampling method to be used taking into account the skewness of the distribution of the Industrial businesses size in Spain, the estimation is biased, although there is no information about how much. Data editing consists on several phases throughout the process. The first one is microediting and takes place during the data collection. The e-questionnaire contains workflows and several hard and soft edits. It makes possible that the data are cleaned by the respondent and there is no need to recontact. Next step is a selective editing phase, where a set of units will be flagged in order to carry out an interactive editing just with these units. Finally the macroediting phase occurs, for the purpose of checking the results to be published. During the whole data collection process the response rate is checked and attention is paid to get the data of the influential units. |
|||
| 13.2. Sampling error | |||
As a non-probability sampling is used, it is not possible to obtain sampling errors. The sample is based on the cutoff method, which, given the nature of the sector, is considered the most appropriate. From a population of 202,232 local units, a sample of approximately 12,000 are included in the sample with the aim of covering in each activity at least 80% of the total turnover obtained from the Industrial Companies Survey. Revisions are made periodically with the aim of reaching 80% of coverage in turnover in each activity of CNAE-2009 as compared to the total estimated turnover in the Industrial Companies Survey. Aggregating activities MIGs are obtained, so keeping the coverage of the turnover in each activity assures the coverage in MIGs. The sample is updated monthly in order to include the new relevant units and delete the duplicated ones and also the final closures. |
|||
| 13.3. Non-sampling error | |||
Different controls of non-sampling errors are carried out throughout the whole process. Coverage: the survey framework contains the establishments whose main economic activity is encompassed in sections B or C of CNAE-2009 and it is updated annually. The frame sources are the Structural Business Statistics: Industrial Sector and PRODCOM, and the units to be included in the ITI framework are those that represent at least the 80% of the turnover in the stratum (NUTS2*economic activity at 4 digits level of CNAE-2009). Due to the way the survey framework is obtained, the overcoverage rate is close to zero. Total non-response: the size-weighted unit response rate of first estimates is 99.0%. The measures taken to reduce the non-response rate are: e-mail recontact to those informants who have not answered 7,12 and 17 days after the end of reference month, increasing the period of data collection (not delaying the press-release day), sending specific information to those local units that provide information through the web questionnaire and request it and carrying out a more thorough follow up of the most influential units during the collection phase (these units are highlighted in the data collection application). The list of influential units is updated according to the weight of each local unit in the elementary aggregate it belongs to, in terms of turnover. Partial non-response: Due to the data collection instrument, the short lenght of the questionnaire and the sample being a panel, the partial non-response is negligible. Imputation: monthly rates of the units filling in the questionnaire in each elementary aggregate are imputed to those units of the same elementary aggregate that did not answer in the reference period. Elementary aggregates are the most detailed levels for which indices are calculated and are defined by the intersection of a division (2 digits of CNAE-2009) or a set of groups (part of a division that belongs to the same MIG) within an Autonomous Community. The imputation rate was 1% in 2022. Data editing: a first editing phase, at micro-data level takes place when the respondent fills in the e-questionnaire. During the data collection another micro-data level editing phase occurs including all data collection methods questionnaires. After that the selective editing is carried out. Finally the macro-data editing phase takes place. Coding: no coding is necessary after the data collection phase. Identification variables are obtained from the survey frame and coded according to the CNAE-2009. Estimation models: In order to ensure the quality of the adjusted data, INE validates the data using the INE standard quality measures: absence of auto-correlation, verification of the appropriateness of the decomposition (specification) through the diagnoses provided by JDemetra+, verification of the absence of residual seasonality in the seasonally adjusted series, verification of the absence of residual effects in the seasonally adjusted series. |
|||
|
|||
| 14.1. Timeliness | |||
The publication is released around 51 days after the end of the reference month which improves the deadline established by Eurostat. On the last day of the reference month the identification number and its corresponding password are sent by e-mail to the sampled units so they can answer through the web questionnaire. Respondents asking to answer using other data collection method are provided with the electronic or paper questionnaire on demand. Afterwards, the Central Office receive three data dispatches (around 15, 27 and 38 days after the end of the reference month), in order to compile, edit, validate and disseminate the data around 51 days after the end of the reference month. 24 months after the reference month the data are considered as definitive. |
|||
| 14.2. Punctuality | |||
All the ITI releases are delivered on time according to the release calendar for short-term business statistics drawn up by INE Spain during the last quarter of the previous year. |
|||
|
||||||
| 15.1. Comparability - geographical | ||||||
Results by Autonomous Communities (NUTS2) were published for the first time in base 2010. Their comparability within Spain is guaranteed since the survey is designed in a homogenous way for the whole geographical area and therefore its methodology, design, process of data collecting and data editing are the same. The same concepts are applied in the entire national territory and in all the economic activites. Comparability among EU countries is ensured by the EBS-Regulation (Regulation (EU) 2019/2152 of the European Parliament and of the Council on European business statistics, repealing 10 legal acts in the field of business statistics) and its General Implementing Act (Commission Implementing Regulation 2020/1197 laying down technical specifications and arrangements pursuant to Regulation (EU) 2019/2152 of the European Parliament and of the Council on European business statistics repealing 10 legal acts in the field of business statistic). They provide these statistics with homogeneity regarding the rest of European Union countries, which disseminate the same information on their respective industrial sectors. |
||||||
| 15.2. Comparability - over time | ||||||
Industrial Turnover Indices were first published in 2002. Data have been rebased three times since then. The first results were published in base 2000; later in the year 2009 base 2005 data were published and as from March 2013 the base year 2010 data were disseminated. Since March 2018 the base 2015 data are disseminated Rebasing involves changes in some methodological aspects of the survey, which have led to a break in the series that has been suitably treated to provide linked series from the beginning of the serie. The number of comparable elements of the series in December 2022 is 252. |
||||||
| 15.3. Coherence - cross domain | ||||||
As a cut-off sampling method is used, in order to obtain the sample in each stratum (NUTS2-division/subdivision), the Structural Business Statistics: Industrial Sector is drawn on as a frame. The reason is that the SBS(IS) contains information at 4-digits CNAE-2009 of the Industrial activity as well as turnover. The Industrial Products Survey (PRODCOM) is also used to complete the frame variables. This way, most of the sampled units are included in the SBS(IS) and in the PRODCOM samples. Three are the main reasons to sample this way: - There is a priori confirmation that the units belong to the Industrial sector. - Although the ITI is a monthly statistic, the annual ITI microdata of the previous years are compared with the SBS(IS) and PRODCOM microdata in the editing phase.
The coherence between the annual results of these three statistical operations can be seen in the following chart, that includes the 2020 annual rates:
The way to sample in the Industrial Production Index is the same as for the ITI, so many ITI sampled units are also IPI sampled units and in the editing phase the monthly IPI microdata and outputs are used (as the IPI is realeased a couple of weeks before the ITI). Last but not least, in the Industrial Turnover questionnaire, data of Industrial New Orders Received by the sampled units are requested. They are used as input for the INOR Index database, press release, etc., and also used at microdata and output level to edit the ITI. |
||||||
| 15.4. Coherence - internal | ||||||
In order to guarantee internal consistency all data used for the estimation of the Industrial Turnover Index are obtained using the same processes of collection, validation, imputation and editing. The general ITI is consistent with NUTS2, MIGs and sections and divisions of CNAE-2009 indices because the total index is obtained by weighting the sub-aggregates indices. The only inconsistency is between the total index and the market indices, because thetotal index is not obtained as the weighted addition of the markets indices. The base and reference year is the same for all series (gross, adjusted and seasonally and calendar adjusted). For calendar adjustment the indirect method is used. |
||||||
|
|||
In 2022, the estimated budget to produce this survey was 799,59 thousand euros. The response burden has been reduced in recent years implementing a new e-questionnaire designed to include workflows and edits during the data collection and the possibility to fill in the questionnaire by email. Besides, selective editing during the process has reduced the recontact rates without disminishing the data quality. |
|||
|
|||
| 17.1. Data revision - policy | |||
Revised data are used both for the National dissemination and to obtain the STS data transmitted to Eurostat, so the same policy is applied to the STS data released nationally and sent to Eurostat. The revision policy adopted for the ITI raw data at INE Spain encompasses several types of revisions: - Regular revisions are carried out on a monthly basis. This revision consists on checking the new available information for the data of the reference month plus the late data of previous months that have already been released. Annually, an overhaul of the seasonal adjustment models takes place in order to update the models - Major revisions are performed on the occasion of rebasing or methodological changes like changes in definitions and classifications as well as legal changes like those due to new Regulations or updates in the already existing. - Non-scheduled revisions take place rarely in the case of detecting an error in the statistical process. - Information on tracking vintages and revision analysis occur seldom with important units. The revision policy regarding seasonally adjusted data comprises two types of revisions: - Concurrent adjustment: partially concurrent adjustment is carried out monthly. With the new data received:
- Current adjustment: annually the model (including the intervention variables of the outliers and the regressors for the correction of calendar effects) is identified, the parameters (of the ARIMA, of the regressors for the correction of calendar effects and of the intervention variables of the outliers) are estimated and the filters are calculated and set.
The link to the revision policy for raw data adopted at INE Spain is the following: http://ine.es/ss/Satellite?c=Page&cid=1259947560358&pagename=MetodologiaYEstandares%2FINELayout&L=1 Regarding the revision for seasonally adjusted data is available in the following link: http://www.ine.es/en/clasifi/estandar_efectos_estacionales_en.pdf There is no official revision calendar, each indicator has its own revision calendar. |
|||
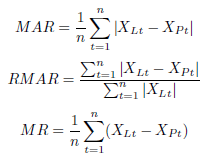
| 17.2. Data revision - practice | |||
As explained in the section 17.1, revisions take place continually and the same revision policy is applied to data released nationally and transmitted to Eurostat. In ITI, each month the provisional data of the current year and the previous year are updated. Major revisions are explained in the methodology and changes in the survey methodology are announced in advance and disseminated at the website. No benchmarking is carried out. The regular processes that introduce revisions are regular revisions for original data series, calendar/working day adjusted data series and seasonal adjusted data series. The Quality Indicators used in the data revision practice are: MAR (Mean Absolute Revision), RMAR (Relative Mean Absolute Revision) and MR (Mean Revision). The formulas used to calculate these QI are:
The computed values for the last 36 monthly (starting in January 2020 and finishing in December 2022) General ITI Index are:
MAR = 0.18, RMAR = 1.0%, MR = -0.0063.
MAR = 0.24, RMAR = 1.4%, MR = -0.029.
|
|||
|
|||
| 18.1. Source data | |||
Industrial Turnover Survey is addressed to local units whose main activity is included in Sections B, except division 09, and C of CNAE-2009. The Industrial Companies Survey (whose frame is the Central Business Register) is the frame for the ITI. It provides the main variables: identification, location, territorial distribution, turnover and economic activity at 4-digits level of CNAE-2009 for companies and local units. PRODCOM is another source used to complete the frame. So as to make the ITI and INORI (Industrial New Orders Received Indices) results comparable with those of the IPI (Industrial Production Index), and this way have an overall view of the economic activity of the industrial sector, the initial ITI and INORI sample was obtained from that of the IPI. Nevertheless, it must be taken into consideration that the population scope of IPI is wider, since it includes companies whose main economic activity is classified within section D of CNAE 2009 (Supply of electric energy, gas, steam and air conditioning). It shall also be taken into consideration that although the initial sample of ITI is based on that of the IPI, there may have been differences between both for various reasons, e.g., the case of a unit which stops manufacturing products included in the basket of products selected in IPI (in this case the unit is delisted from IPI, but not necessarily the same happens in the ITI sample). The size of the ITI sample is of approximately 12,000 units out of 205,195 local units in the Spanish territory whose main activity belongs to sections B, except division 09, and C of CNAE-2009. A cut-off method is used to sample. The stratum is NUTS2-division/subdivision of CNAE-2009 and the threshold is 80% of the turnover of the stratum. Although most of the local units included in the sample belong to companies with twenty or more employees, to ensure coverage within each activity and Autonomous Community, some local units belonging to companies with less employees have been included in the sample. Every five years, the sample is updated in order to include as many units as to meet the threshold of the 80% of the turnover in the stratum. But over the years some units are merged through absorption, some close, some move from one NUTS2 to another and some start-up, so monthly the sample is updated to ensure coverage. |
|||
| 18.2. Frequency of data collection | |||
Data are collected monthly. These data refer to the full month. |
|||
| 18.3. Data collection | |||
There ares everal methods to gather data from respondents: on-line questionnaire (used in average in 2022 by 88% of the sampled units approximately), e-mail (used by 8%), telephone (used by 1%) and the 3% left receives a postal survey that is sent back by fax in most of the cases or by postal mail. Two questionnaires are sent to the sampled units. In one of them just industrial turnover and new orders received are asked for, see annex. In the other one information about stocks is also requested. The questionnaire sent depends on the size and activity of the unit. The latter is sent to local units whose main activity is included in section C of CNAE-2009 and belonging to companies with 50 or more employees and, also, local units whose main activity is included in divisions 13, 14, 15, 16 or 31 of CNAE-2009 and belonging to companies with 20 or more employees. The rest of the units of the sample have to fill in the former. Annexes: Questionnaire |
|||
| 18.4. Data validation | |||
The procedures for checking and validating the source data are the following.
|
|||
| 18.5. Data compilation | |||
In the first step, the questionnaires are collected at regional level by INE data collection staff and there is a first cleansing of errors according to a set of edits. Microediting consists on validating data from each local unit, attending to its historical values. The analysis establishes monthly and annual comparisons so that the data is validated without contacting the informants when the evolution is repeated periodically. Next, at centralized level, the selective editing phase, imputation (non-response is imputed using the data of the previous month of the non-respondent units and the variation rate of the units in the same stratum) and the macroediting process take place. In some cases, manual editing is required, for example non responding large units or units belonging to divisions like 30 or 25 in CNAE-2009. Finally estimators are calculated by aggregating the elementary indices taking into account the weightings. In the last phase, the confidentiality rules are applied and the dissemination files together with the press release are prepared according to the dissemination breakdowns. In this phase the file conversion to SDMX-ML file by using a SAS macro is carried out. The ITI is obtained using a fixed-base Laspeyres index. The elementary indices are calculated from the respondents (imputed in case of non-response) common to the reference month and the previous month. Elementary indices are calculated (only for internal use) for each stratum (NUTS2-division/subdivision). The weighting variable is the turnover and the source is SBS (Structural Business Statistics: Industrial Sector). The weights are updated every 5 years using the annual results of the base year. In order to disseminate the different breakdowns, weights are available and disseminated for MIGs, sections and divisions of CNAE-2009. Geographical weights are only available for internal purpose. Due to the rebasing 2015 process, the ITI weights were updated. The data used to update the weights were the Structural Business Statistics: Industrial Sector year 2015. These weights were revised and analysed in detail. |
|||
| 18.6. Adjustment | |||
For the seasonal adjustment of the series of the Industrial Turnover Indices, INE Spain has followed the established standard to adjust figures for seasonal and calendar effects. This standard is the result of the working group for seasonal adjustment created at INE in May 2012, and follows the recommendations included in ESS guidelines in seasonal adjustment. The link to INE standard is available in the following link: http://www.ine.es/en/clasifi/estandar_efectos_estacionales_en.pdf Calendar effects are defined as the impact that occurs in the time series of a variable due to the different structures presented in the months (or quarters) of different years (both in length and composition), if maintained constant the other factors influencing this variable. To overcome this problem and obtain comparable turnover series, these series are adjusted taking into account the following effects: working days, Easter and leap years. To collect these effects RegARIMA models with four centred variables of intervention for calendar effects have been used. Once the calendar effects have been removed, indices are adjusted for seasonal effects. Seasonal fluctuations are movements that occur with similar intensity every month, every quarter or every season of the year and are expected to sustain over time. Series adjusted for seasonal and calendar effects provide an estimate of the "new effects" in the series (changes in trend, cycle and irregular component). Since base 2010, to complete the analysis of the situation, most series are disseminated not only unadjusted but also calendar adjusted and seasonally and calendar adjusted. The software used for seasonal adjustment is JDemetra+ 2.2.2. And the method used is TRAMO/SEATS. The models are revised annually and the regression coefficients are recalculated annually. The parameters and components are re-estimated monthly. The adjusted series are calculated on a monthly basis and the whole length of the time series is revised. The direct adjustment is used, so there is no consistency amongst the different breakdown. To assess the performanceof the seasonal and calendar effect the following methods are applied: - Check the decomposition through JDemetra+ diagnose. - Check the absence of residual seasonality and calendar effects. - Check the absence of residual calendar effects in the seasonal adjusted time series. To assess the effects of the Covid crisis, the war in Ukraine and/or other unexpected situations, monthly automatic AOs are included in the models. Annually during the model analysis some of these AOs are changed to LS or TC. More information about the seasonal adjustment (regressors, ARIMA models used, outliers, etc.) is available at INE Spain website in the section 18.6 of the following link: https://www.ine.es/dynt3/metadatos/en/RespuestaDatos.html?oe=30052 Annexes: Seasonal adjustment |
|||
|
|||
Not available. |
|||
|
|||
|
|||