Reference metadata describe statistical concepts and methodologies used for the collection and generation of data. They provide information on data quality and, since they are strongly content-oriented, assist users in interpreting the data. Reference metadata, unlike structural metadata, can be decoupled from the data.
The four-yearly labour cost survey meets the statistical needs of the Commission as defined in the Council Regulation (EC) No 530/1999 of 9 March 1999 and the Commission Regulation (EC) No 1737/2005 of 21 October 2005. This four-yearly survey is based on a sample of local units of enterprises with at least 10 employees. The data are collected according to the activity and location of the local unit, as well as the size of the enterprise to which the local unit belongs. The labour cost survey is organised every four years.
2.2. Classification system
Data is available by economic activity according to the General Industrial Classification of Economic Activities (NACE) and by region according to the Nomenclature of Territorial Units for Statistics (NUTS). The economic activity (NACE) and regional breakdown (NUTS) are based on the version which was valid in that reference year. Economic activity is broken down at the division level of the NACE classification. From reference year 2008 onwards NACE Rev. 2 classification had to be applied in all data collections recording data by economic activities. In order to allow a comparison of the LCS 2008 results with the data of the former LCS reference years, LCS2008 data is available both in NACE Rev. 1.1 (previous classification used) as well as in NACE Rev.2 as stipulated by Commission Regulation 973/2007.
2.3. Coverage - sector
LCS 2000 and 2004 : NACE Rev. 1.1 Sections C to K, as well as M to O. LCS 2008, 2012, 2016 and 2020 : NACE Rev. 2 Sections B to S excluding section O.
2.4. Statistical concepts and definitions
Labour Costs refer to the total expenditure borne by employers for the purpose of employing staff. They include employee compensation, which is mainly comprised of gross wages and salaries in cash and in kind and employers' social security contributions, vocational training costs, other expenditure, such as recruitment costs and spending on working clothes, and employment taxes regarded as labour costs minus subsidies received. These labour cost components and their elements are defined in Commission Regulation (EC) No 1737/2005 of 21 October 2005, implementing Council Regulation (EC) No 530/1999 concerning structural statistics on earnings and labour costs as regards the definition and transmission of information on labour costs.
2.5. Statistical unit
The statistical unit is the enterprise or local unit.
2.6. Statistical population
Enterprises with at least 10 employees.
2.7. Reference area
Belgium and NUTS 1 regions (Brussels-Capital Region, Flemish Region and Walloon Region).
2.8. Coverage - Time
LCS 2000 and 2004 : NACE Rev. 1.1 Sections C to K, as well as M to O.
LCS 2008, 2012, 2016 and 2020 : NACE Rev. 2 Sections B to S excluding section O.
2.9. Base period
Not applicable.
3.1. Source data
Since 2016, the four-yearly survey on labour cost is based on the exclusive use of administrative sources (NSSO, NBB, FPS Finances, etc.). Before 2016, the survey was based on a sample of local units of enterprises with at least 10 employees, selected in the NSSO(PLA) registers. Therefore, the comparison with the results prior to 2016 should be made with a great deal of caution.
Data from the NSSO (National Social Security Office) are used in the estimates for the number of employees (A), the hours actually worked (B), the paid hours (C), the direct remuneration, bonuses and allowances (D1111), the payments for days not worked (D1113), the company cars (D11143) and the statutory social-security contributions (D1211).
Data from the NBB (National Bank of Belgium) on the annual accounts of enterprises are used to estimate the collectively agreed, contractual and voluntary social-security contributions (D1212).
Data from the FPS (Federal Public Service) Finances on personal income tax (BELCOTAX) and on corporate tax (BIZTAX) are used to estimate payments to employees’ savings schemes (D1112), wages and salaries in kind (D1114), employers' imputed social contributions (D122), other expenditure (D3) and subsidies (D5).
The estimate of vocational training costs (D2) is based on the results of the Continuing Vocational Training Survey (CVTS) for the year 2020.
3.2. Frequency of data collection
The survey is carried out every four years.
3.3. Data collection
Based on legal authorisation, administrative data are received electronically from their institution.
NSSO data have arrived 16 months after the reference period (April 2022).
NBB data are delivered 10 days after their receipt at the Central Balance Sheet Office. As a reminder, enterprises have to submit their annual accounts within 6 months after the closure of the financial year.
FPS Finances data are delivered 6 months after the reference period for BELCOTAX and 12 months after the reference period for BIZTAX.
Data from CVTS 2020 were delivered on 21 June 2022 before the publication of the survey results on Statbel's website (on 22 November 2022).
3.4. Data validation
Data are internally validated before dissemination, using the national validation procedures.
3.5. Data compilation
The NSSO-datasets are used as source to compile the Belgian LCS.
3.6. Adjustment
Not applicable.
4.1. Quality assurance
Data are internally validated before dissemination. Herefore we use the national validation procedures.
4.2. Quality management - assessment
Following the very negative diagnosis of LCS 2012 (low response rate, inconsistencies between sources), it was decided to launch a reform of LCS 2016 that would be based on the exclusive use of administrative sources. This project, started in 2015 and funded by a Eurostat's grant over the period 2015-2017, involved two steps: 1) the collection of administrative sources not yet available, 2) the construction of LCS 2016 variables using a comparative analysis of the results obtained in 2012 between the alternative sources and the LCS data.
The results of the second step were relatively satisfying for the main variables studied, i.e. the selection variables (enterprise size, NACE section and region of the local unit), the number of employees (A), the hours paid (C), and the survey variables which represent 95 % of the labour cost according to LCS 2012 (direct remuneration, bonuses and allowances, payments for days not worked and statutory social-security contributions).
5.1. Relevance - User Needs
The main users of the results of the Labour Cost Survey (LCS) are Eurostat, the Ministry of Economy/Statistics Belgium, the Ministry of Employment, Labour and Social Dialogue, the National Bank of Belgium, the Central Economic Council, employers associations, trade unions, the media, universities, students and enterprises.
The Labour Cost Survey contains variables that are not available in other statistics. In administrative data (e.g. files from the National Social Security Office and the National Bank of Belgium) variables are not even available at the level of local units. This survey creates data that are comparable with other European countries.
5.2. Relevance - User Satisfaction
User satisfaction surveys indicate that the need for information is largely met.
5.3. Completeness
Belgium fulfills the requirements of Regulation (EC) N°530/1999.
5.3.1. Data completeness - rate
Not provided.
6.1. Accuracy - overall
The Belgian LCS is completely based on administrative sources, in particular data from the National Social Security Office (NSSO). The NSSO is responsible for the overall management of the Belgian social security. To carry out its duties, the NSSO collects social security contributions, which are collected from the earnings of workers. Every employer having a local unit in Belgium and employing at least one worker is required to communicate each quarter the labour costs, earnings and working time of all its employees. The register of the NSSO is therefore almost exhaustive and information is available on an individual basis.
6.2. Sampling error
Not applicable.
6.2.1. Sampling error - indicators
Not applicable.
6.3. Non-sampling error
The Labour Cost survey contains variables that are not identified or poorly covered in the administrative sources available (NSSO, NBB, Belcotax and BIZTAX): the number of apprentices (A13); the hours actually worked (B), the payments for days not worked (D1113), the collectively agreed, contractual and voluntary social-security contributions (D1212), the other expenditure paid by the employer (D3), the taxes (D4) and the subsidies received by the employer (D5).
6.3.1. Coverage error
The number of apprentices (A13) is estimated based on NSSO data that make it possible to identify apprentices younger than 19 only. Older apprentices are incorporated into the numbers of other employees (A11 and A12).
Hours actually worked (B) are reported in the NBB's social balance sheets, but only enterprises with at least 20 full-time equivalents (FTE) have an obligation to publish them at the Central Balance Sheet Office.
Payments for days not worked (D1113) are largely recorded in the NSSO sources as a direct remuneration (D1111).
Other expenditure paid by the employer (D3) are recorded in BIZTAX only if they can be deducted from corporate tax, which is not the case for many of them.
Taxes (D4) that are considered as labour costs are difficult to identify as the employment policies in place at the federal and local levels aim to promote job creation rather than discourage it. However, some local units have reported this type of cost in the LCS 2012 (0.2 % of the responding local units). So this should correspond to very specific taxes and be limited to few municipalities. Unfortunately, they cannot be identified by means of the available tax administrative sources.
Subsidies received by the employer (D5) cannot, for the most part, be found in the administrative sources available. Reductions in social security contributions are provided by the NSSO, as well as the exemptions on personal income tax (BELCOTAX) and on corporate tax (BIZTAX), but many of these employment aid measures are also paid by regional or local organisations whose data are not yet available.
6.3.1.1. Over-coverage - rate
There is over-coverage error for the variables A11 and A12 with older apprentices and for the variable on direct remuneration (D1111) where the most of payments for days not worked (D1113) are recorded.
The problems are above all on under-coverage errors (see 6.3.1).
6.3.1.2. Common units - proportion
Not provided.
6.3.2. Measurement error
All enterprises have the legal obligation to report the information asked at NSSO and tax authorities (BELCOTAX and BIZTAX). Moreover, this information is regularly checked by these authorities. However, these checks are less meticulous at the level of the NBB's social balance sheets for which many values seem to be outliers.
6.3.3. Non response error
Not applicable.
6.3.3.1. Unit non-response - rate
Not applicable.
6.3.3.2. Item non-response - rate
Not applicable.
6.3.4. Processing error
Not provided.
6.3.4.1. Imputation - rate
Not provided.
6.3.5. Model assumption error
Different model types have been used to estimate the LCS 2020 variables:
the models of microdata use, with the bottom-up approach;
the models of microdata use, with the top-down approach.
The bottom-up models use data at the level of employees to aggregate them at the level of local units. NSSO and BELCOTAX data on employees allow this type of use. NSSO data are even more detailed, because the registration unit is the occupation line (or contract line), which make it possible to make accurate estimates on a monthly basis, and not only on a quarterly basis. Moreover, this information is regularly checked by these authorities. These estimation models generate good quality results. Most variables are produced based on these models: the number of employees (A), the paid hours (C) and the survey variables that represent 95 % of the labour cost according to LCS 2012 (direct remuneration, bonuses and allowances, payments for days not worked and statutory social-security contributions).
The top-down models use data at the level of enterprises to disaggregate them at the level of local units. NBB and BIZTAX data make this type of use possible. The disadvantage of these models is that the use of the top-down approach requires to spread the labour costs according to the number of employees in the local unit, with the false assumption that all employees of the enterprise have the same costs. Several variables are produced based on these models: payments to employees’ savings schemes (D1112), wages and salaries in kind (D1114), collectively agreed, contractual and voluntary social-security contributions (D1212) and employers' imputed social contributions (D122).
6.4. Seasonal adjustment
Not applicable.
6.5. Data revision - policy
Not provided.
6.6. Data revision - practice
Not provided.
6.6.1. Data revision - average size
Not provided.
7.1. Timeliness
The four tables with the completely controlled and internally approved data for 2020 were sent to Eurostat on 8 July 2020.
7.1.1. Time lag - first result
Not provided.
7.1.2. Time lag - final result
Not provided.
7.2. Punctuality
The production of the results for the year 2020 has started with the delivery of NSSO data in April 2022.
7.2.1. Punctuality - delivery and publication
The results were sent to Eurostat on 8 July 2022 and published on our website on 5 October 2022.
8.1. Comparability - geographical
Data are comparable between countries.
8.1.1. Asymmetry for mirror flow statistics - coefficient
Not provided.
8.2. Comparability - over time
The shift from a survey on local units in 2012 to an exclusive use of administrative sources in 2016 necessarily implies differences in the results between the two methods.
The main difference is that the use of more detailed data at the level of employees' occupation lines from the NSSO made it possible to use a monthly average for the estimate of the number of employees (instead of a quarterly average in 2012). This change in method made it possible to include employees with short-term employment contracts (at least one quarter). This largely explains the sharp increases of the number of employees for the NACE sectors N (Administrative and support service activities, +41 %) with temporary agency workers and P (Education, +44 %) with external actors, searchers etc between 2012 and 2016 results.
Data between 2016 and 2020 are fully comparable.
8.2.1. Length of comparable time series
Not provided.
8.3. Coherence - cross domain
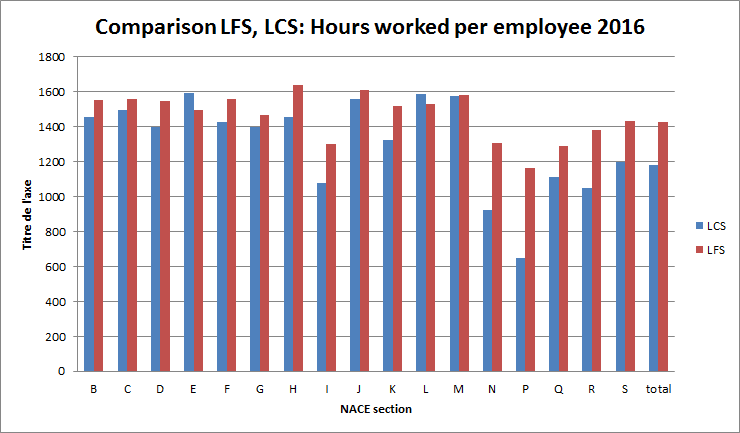
Comparison of LCS and LFS: Hours worked per employee, 2020
LFS only contains information on the hours worked per week. To calculate the hours per year, we multiplied the hours per week by 52 weeks, minus the summer vacation period (circa 4 weeks) and public holidays (circa 2 weeks). This variable is still overestimated because other absence days are not taken into account, e.g. absence due to sickness, maternity leave, … This can explain the divergence between LCS and LFS. Unlike LCS, for sector N, LFS distributes temporary agency workers according to the NACE sector of the enterprise that employs them. For sector P, non-declared hours worked by teachers to the Community to prepare classes and correct exams of students are not taken into account in the 2020 LCS.
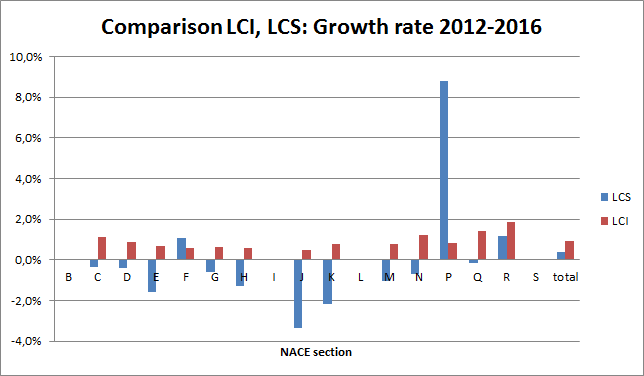
Comparison of LCS and LCI : Hourly labour costs growth rate between 2016 and 2020
The total growth rates of LCI and LCS are almost similar. Small divergences between both statistics come from the fact that LCI represents all statistical units, regardless of size while LCS only represents all statistical units with 10 or more employees.
Comparison of LCS and SBS: Wages and salaries per employee, 2020
SBS uses enterprises as statistical unit while LCS is based on local units.
8.4. Coherence - sub annual and annual statistics
Not provided.
8.5. Coherence - National Accounts
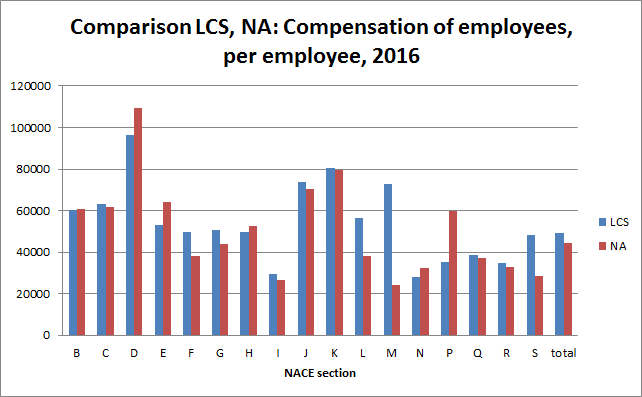
Comparison of LCS and NA: Compensation of employees, per employee, 2020 (ESA 2010)
The difference between LCS and NA can be explained by the use of different sources. NA covers all enterprise sizes and adjusts the figures in order to accurately reflect the entire economy.
8.6. Coherence - internal
Additional checks and comparisons with Labour Cost Index (LCI) data are done in order to assess internal coherence with regard to labour costs.
Data as well as further information on definitions and methods are available at the dedicated section of Statbel’s website: Labour Cost | Statbel
9.1. Dissemination format - News release
New data are announced at the head page of Statbel's website.
9.2. Dissemination format - Publications
The national press release is published on Statbel’s website with detailed information on the most frequently asked aggregated tables and methodology. This information is available inFrench and Dutch.
9.3. Dissemination format - online database
The database is available on the website of Statbel.
9.3.1. Data tables - consultations
Not applicable.
9.4. Dissemination format - microdata access
There is no microdata access for the LCS.
9.5. Dissemination format - other
For users who need more detailed and unique data, Statistics Belgium can produce aggregated tables according to user preference.
9.6. Documentation on methodology
Further information on definitions and methods are available at the dedicated section of Statbel’s website.
9.7. Quality management - documentation
Metadata are available on the website of Statbel.
9.7.1. Metadata completeness - rate
100%
9.7.2. Metadata - consultations
The metadata can be consulted at the dedicated section of Statbel’s website.
Not applicable.
The Belgian confidentiality rules are followed.
11.1. Confidentiality - policy
The Belgian confidentiality rules are presented on the website of Statbel.
11.2. Confidentiality - data treatment
Confidential data is flagged. Belgium informs Eurostat if confidential data shall be flagged.
With the exclusive use of administrative data, the quality of the results has improved significantly. Nevertheless, improvements are still necessary for some variables: apprentices (A13, B13, C13, D112, D123), hours actually worked (B), payments for days not worked (D1113) and subsidies received by the employer (D5). This will be the subject of a new reform project for LCS 2024.
The four-yearly labour cost survey meets the statistical needs of the Commission as defined in the Council Regulation (EC) No 530/1999 of 9 March 1999 and the Commission Regulation (EC) No 1737/2005 of 21 October 2005. This four-yearly survey is based on a sample of local units of enterprises with at least 10 employees. The data are collected according to the activity and location of the local unit, as well as the size of the enterprise to which the local unit belongs. The labour cost survey is organised every four years.
Not Applicable
Labour Costs refer to the total expenditure borne by employers for the purpose of employing staff. They include employee compensation, which is mainly comprised of gross wages and salaries in cash and in kind and employers' social security contributions, vocational training costs, other expenditure, such as recruitment costs and spending on working clothes, and employment taxes regarded as labour costs minus subsidies received. These labour cost components and their elements are defined in Commission Regulation (EC) No 1737/2005 of 21 October 2005, implementing Council Regulation (EC) No 530/1999 concerning structural statistics on earnings and labour costs as regards the definition and transmission of information on labour costs.
The statistical unit is the enterprise or local unit.
Enterprises with at least 10 employees.
Belgium and NUTS 1 regions (Brussels-Capital Region, Flemish Region and Walloon Region).
Not Applicable
The Belgian LCS is completely based on administrative sources, in particular data from the National Social Security Office (NSSO). The NSSO is responsible for the overall management of the Belgian social security. To carry out its duties, the NSSO collects social security contributions, which are collected from the earnings of workers. Every employer having a local unit in Belgium and employing at least one worker is required to communicate each quarter the labour costs, earnings and working time of all its employees. The register of the NSSO is therefore almost exhaustive and information is available on an individual basis.
Not Applicable
The NSSO-datasets are used as source to compile the Belgian LCS.
Since 2016, the four-yearly survey on labour cost is based on the exclusive use of administrative sources (NSSO, NBB, FPS Finances, etc.). Before 2016, the survey was based on a sample of local units of enterprises with at least 10 employees, selected in the NSSO(PLA) registers. Therefore, the comparison with the results prior to 2016 should be made with a great deal of caution.
Data from the NSSO (National Social Security Office) are used in the estimates for the number of employees (A), the hours actually worked (B), the paid hours (C), the direct remuneration, bonuses and allowances (D1111), the payments for days not worked (D1113), the company cars (D11143) and the statutory social-security contributions (D1211).
Data from the NBB (National Bank of Belgium) on the annual accounts of enterprises are used to estimate the collectively agreed, contractual and voluntary social-security contributions (D1212).
Data from the FPS (Federal Public Service) Finances on personal income tax (BELCOTAX) and on corporate tax (BIZTAX) are used to estimate payments to employees’ savings schemes (D1112), wages and salaries in kind (D1114), employers' imputed social contributions (D122), other expenditure (D3) and subsidies (D5).
The estimate of vocational training costs (D2) is based on the results of the Continuing Vocational Training Survey (CVTS) for the year 2020.
Not Applicable
The four tables with the completely controlled and internally approved data for 2020 were sent to Eurostat on 8 July 2020.
Data are comparable between countries.
The shift from a survey on local units in 2012 to an exclusive use of administrative sources in 2016 necessarily implies differences in the results between the two methods.
The main difference is that the use of more detailed data at the level of employees' occupation lines from the NSSO made it possible to use a monthly average for the estimate of the number of employees (instead of a quarterly average in 2012). This change in method made it possible to include employees with short-term employment contracts (at least one quarter). This largely explains the sharp increases of the number of employees for the NACE sectors N (Administrative and support service activities, +41 %) with temporary agency workers and P (Education, +44 %) with external actors, searchers etc between 2012 and 2016 results.