


1.1. Contact organisation
General Directorate of Education and Science Statistics (DGEEC – Direção Geral de Estatísticas de Educação e Ciência)
1.2. Contact organisation unit
Directorate for Science and Technology Statistics and Information Society Services (DSECTSI - Direção de Serviços de Estatísticas de Ciência e Tecnologia e Sociedade de Informação) / Research and Development Monitoring Team (EMID - Equipa para a Monitorização da Investigação e Desenvolvimento)
1.3. Contact name
Confidential because of GDPR
1.4. Contact person function
Confidential because of GDPR
1.5. Contact mail address
Av. 24 de Julho, 134, 1399-054 Lisboa, PORTUGAL
1.6. Contact email address
Confidential because of GDPR
1.7. Contact phone number
Confidential because of GDPR
1.8. Contact fax number
Confidential because of GDPR
28 May 2021
2.1. Metadata last certified
30 May 2024
2.2. Metadata last posted
30 May 2024
2.3. Metadata last update
30 May 2024
3.1. Data description
The Community Innovation Survey (CIS) is a survey about innovation activities in enterprises. The survey is designed to collect the information on types of innovation, processes of development of innovation like cooperation patterns, financing and expenditure, objectives of innovation activities or barriers for initiating or implementing innovation.
The CIS provides statistics by type of innovators, economic activity and size class of enterprises. The survey is currently carried out every two years across the EU Member States, EFTA countries and EU candidate countries.
In order to ensure comparability across countries, Eurostat together with the countries develops a Harmonised Data Collection (HDC) questionnaire and drafts the methodological recommendations for implementation of each survey round.
CIS 2020 is a second in a row to implement concepts and methodology of the Oslo Manual 4th Edition revised in 2018. The changes in the CIS driven by the revision of the manual and their impact on collected indicators are described in the Statistics Explained article: Community Innovation Survey – new features.
The legal framework for CIS since 2012 is the Commission Regulation No 995/2012 that establishes the quality conditions for the data collection and transmission and identifies the obligatory cross-coverage of economic sectors, size class of enterprises and innovation indicators. The target population are enterprises with at least 10 employees classified in the core NACE economic sectors (see 3.3). Further activities may be covered on a voluntary basis in national datasets. Most statistics are based on the 3-year reference period (t, t-1, t-2), but some use only one calendar year (t or t-2). Please refer to the Annex section of the European metadata (ESMS) for details of the time coverage of collected indicators.
3.2. Classification system
Indicators related to the enterprises are classified by country, economic activity (NACE Rev. 2), size class of enterprises and type of innovation.
The main typology of classification of enterprises in reference to innovation is the distinction between innovation-active enterprises (INN) and not innovation-active enterprises (NINN).
The enterprise is considered as innovative (INN) if during the reference period it successfully introduced a a) product or a) business process innovation, c) completed but not yet implemented the innovation, d) had ongoing innovation activities, e) abandoned innovation activities or was f) engaged in in-house R&D or R&D contracted out. Non-innovative (NINN) enterprises had no innovation activity mentioned above whatsoever during the reference period.
3.3. Coverage - sector
CIS covers main economic sectors according to NACE Rev.2 broken down by size class of enterprises and type of innovation activity.
3.3.1. Main economic sectors covered - NACE Rev.2
In accordance with Commission Regulation 995/2012 on innovation statistics, the following industries and services are included in the core target population. Results are made available with these following breakdowns :
All NACE – Core NACE (NACE Rev. 2 sections & divisions B-C-D-E-46-H-J-K-71-72-73 )
CORE INDUSTRY (excluding construction) (NACE Rev. 2 SECTIONS B_C_D_E)
10-12: Manufacture of food products, beverages and tobacco
13-15: Manufacture of textiles, wearing apparel, leather and related products
16-18: Manufacture of wood, paper, printing and reproduction
20: Manufacture of chemicals and chemical products
21: Manufacture of basic pharmaceutical products and pharmaceutical preparations
19-22: Manufacture of petroleum, chemical, pharmaceutical, rubber and plastic products
23: Manufacture of other non-metallic mineral products
24: Manufacture of basic metals
25: Manufacture of fabricated metal products, except machinery and equipment
26: Manufacture of computer, electronic and optical products
25-30: Manufacture of fabricated metal products (except machinery and equipment), computer, electronic and optical products, electrical equipment, motor vehicles and other transport equipment
31-33: Manufacture of furniture; jewellery, musical instruments, toys; repair and installation of machinery and equipment
D: ELECTRICITY, GAS, STEAM AND AIR CONDITIONING SUPPLY
E: WATER SUPPLY; SEWERAGE, WASTE MANAGEMENT AND REMEDIATION ACTIVITIES
36: Water collection, treatment and supply
37-39: Sewerage, waste management, remediation activities
CORE SERVICES (NACE Rev. 2 sections & divisions 46-H-J-K-71-72-73)(NACE code in the tables = G46-M73_INN)
46: Wholesale trade, except of motor vehicles and motorcycles
H: TRANSPORTATION AND STORAGE
49-51: Land transport and transport via pipelines, water transport and air transport
52-53: Warehousing and support activities for transportation and postal and courier activities
J: INFORMATION AND COMMUNICATION
58: Publishing activities
61: Telecommunications
62: Computer programming, consultancy and related activities
63: Information service activities
K: FINANCIAL AND INSURANCE ACTIVITIES
64: Financial service activities, except insurance and pension funding
65: Insurance, reinsurance and pension funding, except compulsory social security
66: Activities auxiliary to financial services and insurance activities
M: PROFESSIONAL, SCIENTIFIC AND TECHNICAL ACTIVITIES
71: Architectural and engineering activities; technical testing and analysis
72: Scientific research and development
73: Advertising and market research
71-73: Architectural and engineering activities; technical testing and analysis; Scientific research and development; Advertising and market research
3.3.1.1. Main economic sectors covered - NACE Rev.2 - national particularities
The Portuguese implementation of CIS 2020 survey covers all NACE sections A to S, except Section O.
3.3.2. Sector coverage - size class
In accordance with Commission Regulation 995/2012 on innovation statistics, the following size classes of enterprises according to the number of employees are included in the core target population of the CIS:
- 10 - 49 employees
- 50 - 249 employees
- 250 or more employees
3.3.2.1. Sector coverage - size class - national particularities
Size classes were based on persons employed.
- 10 - 49
- 50 - 249
- 250 or more
3.4. Statistical concepts and definitions
The description of concepts, definitions and main statistical variables is available in CIS 2020 European metadata file (ESMS) Results of the community innovation survey 2020 (CIS2020) (inn_cis12) in Eurostat database.
3.5. Statistical unit
The enterprise as legal unit.
3.6. Statistical population
Core target population are all enterprises in CORE NACE activities (see 3.3.1) with 10 or more employees.
3.7. Reference area
Portugal. The regional dimension (NUTS) is available in national survey at the level of NUTS II.
3.8. Coverage - Time
Several rounds of Community Innovation Survey have been conducted so far at two-year interval since end of 90’s.
3.8.1. Participation in the CIS waves
| CIS wave | Reference period | Participation | Comment (deviation from reference period) |
| CIS2 | 1994-1996 | Yes | Reference period 1995-1997 |
| CIS3 | 1998-2000 | Yes | |
| CIS light | 2002-2003* | Yes | Reference period 2003 |
| CIS4 | 2002-2004 | Yes | |
| CIS2006 | 2004-2006 | Yes | |
| CIS2008 | 2006-2008 | Yes | |
| CIS2010 | 2008-2010 | Yes | |
| CIS2012 | 2010-2012 | Yes | |
| CIS2014 | 2012-2014 | Yes | |
| CIS2016 | 2014-2016 | Yes | |
| CIS2018 | 2016-2018 | Yes | |
| CIS2020 | 2018-2020 | Yes |
*two reference periods can be distinguished for CIS light: 2000-2002 and 2001-2003
3.9. Base period
Not relevant
CIS indicators are available according to 3 units of measure:
NR: Number for number of enterprises and number of persons employed.
THS_EUR: Thousands of euros. All financial variables are provided in thousands of euros, i.e. Turnover or Innovation expenditure.
PC: Percentage. The percentage is the ratio between the selected combinations of indicators.
For CIS 2020, the time covered by the survey is the 3-year period from the beginning of 2018 to the end of 2020.
Some questions and indicators refer to one year — 2020.
The list of indicators covering the 3-year period and referring to one year according to the HDC is available in the Annex section of the European metadata (ESMS).
6.1. Institutional Mandate - legal acts and other agreements
CIS surveys are based on the Commission Regulation No 995/2012, implementing Decision No 1608/2003/EC of the European Parliament and of the Council on the production and development of Community statistics on science and technology.
This Regulation establishes innovation statistics on a statutory basis and makes the delivery of certain variables compulsory e.g. innovation activities, cooperation, development, expenditures and turnover (see the Regulation). Each survey wave may additionally include further variables.
In addition, the Regulation defines the obligatory cross-coverage of economic sectors and size class of enterprises.
6.1.1. National legislation
The Protocol of delegation of statistical functions signed by DGEEC and Statistics Portugal is the legal instrument that gives to DGEEC the status of official statistical authority with obligations to comply with legal and regulatory provisions of the Portuguese National Statistical System (Law Nr. 22/2008 of May 13).
6.2. Institutional Mandate - data sharing
Not applicable.
CIS data are transmitted to Eurostat via EDAMIS using the secured transmission system.
7.1. Confidentiality - policy
DGEEC, as the national authority for the production and dissemination of statistics, acts according to the Portuguese National Statistical System Law Nr. 22/2008 of May 13, that also regulates statistical confidentiality (Article 6).
7.2. Confidentiality - data treatment
The rule applied for defining cells with direct disclosure risk (primary confidentiality) is 2 firms or less in a cell is considered confidential (Rule of Three). When necessary it is applied the rule of the secondary confidentiality, if the disclosure is possible by subtraction.
8.1. Release calendar
The calendars of statistical operations and statistical publications are publicly available on the DGEEC's website .
8.2. Release calendar access
https://estatistica.dgeec.mec.pt/docs/docs_cdeo/PA2022_Disp_DGEEC_.pdf
https://estatistica.dgeec.mec.pt/docs/docs_cdeo/PA2022_Publ_DGEEC_.pdf
https://www.ine.pt/xportal/xmain?xpid=INE&xpgid=ine_cont_inst&INST=5433652
8.3. Release policy - user access
CIS agregated data (by NACE, size-clas and region) is publicaly available to all users on the website of DGEEC and on the website of Statistics Portugal. For CIS 2020, there was a publication and a press release with the main results. The dissemination of statistical data to all users is done at the same time.
CIS is conducted and disseminated at two-year interval in pair years.
Accessibility and clarity refer to the simplicity and ease for users to access statistics using simple and user-friendly procedure, obtaining them in an expected form and within an acceptable time period, with the appropriate user information and assistance: a global context which finally enables them to make optimum use of the statistics.
10.1. Dissemination format - News release
See below.
10.1.1. Availability of the releases
| Dissemination and access | Availability | Comments, links, ... |
| Press release | Yes | There was a press release to announce the disseminations of the CIS 2020 main results. |
| Access to public free of charge | Yes | Aggregated data by NACE, Size-class and regions (https://www.dgeec.mec.pt/np4/207/) |
| Access to public restricted (membership/password/part of data provided, etc) | No |
10.2. Dissemination format - Publications
- Online database (containing all/most results) : no.
- Online Excel files (containing all the results aggregated by NACE, size-class and region): Yes
https://www.dgeec.mec.pt/np4/207/
https://www.ine.pt/xportal/xmain?xpid=INE&xpgid=ine_publicacoes&PUBLICACOESpub_boui=6172193&PUBLICACOEStema=55483&PUBLICACOESmodo=2)
- Analytical publication (referring to all/most results) : A report analysing the main results of the survey (pdf):
https://www.dgeec.mec.pt/np4/207/
https://www.ine.pt/xportal/xmain?xpid=INE&xpgid=ine_publicacoes&PUBLICACOESpub_boui=6172193&PUBLICACOEStema=55483&PUBLICACOESmodo=2
https://www.ine.pt/xportal/xmain?xpid=INE&xpgid=ine_destaques&DESTAQUESdest_boui=536779978&DESTAQUEStema=55483&DESTAQUESmodo=2
https://www.ine.pt/xportal/xmain?xpid=INE&xpgid=ine_destaques&DESTAQUESdest_boui=541017250&DESTAQUEStema=55483&DESTAQUESmodo=2
- Analytical publication (referring to specific results, e.g. only for one sector or one specific aspect) : no.
10.3. Dissemination format - online database
Not available.
10.3.1. Data tables - consultations
Not requested.
10.4. Dissemination format - microdata access
See below.
10.4.1. Dissemination of microdata
| Mean of dissemination | Availability of microdata | Comments, links, ... |
| Eurostat SAFE centre | Yes | Confidential data as obtained from the national authorities. They allow only indirect identification of the statistical units concerned. The access to these data is only possible in the Eurostat SAFE Centre. |
| National SAFE centre | Yes | |
| Eurostat: partially anonymised data (SUF) | Yes | Anonymised microdata sets extracted from the aforementioned data. The individual statistical records have been modified in order to minimise, in accordance with current best practice, the risk of indirect identification of the statistical units to which they relate. This access is given via distribution of encrypted CD-ROM. |
| National : partially anonymised data | Yes | In the field of CIS, researchers can access anonymised microdata in a way that does not allow the identification of the company. |
10.5. Dissemination format - other
No other means of dissemination.
10.5.1. Metadata - consultations
Not requested.
10.6. Documentation on methodology
The CIS 2020 data dissemination files provides methodological information (technical note) and the questionnaire. The technical note provides information on the target population, the criteria for the construction of the sample and how the weighting factors are calculated. It is a component of the Excel files where the data is made available. The latest version is from September 2022, with dual authorship of DGEEC and Statistics Portugal.
Users are also provided with metadata on each CIS survey operation, describing all concepts and methodology inherent to collection and production of the data, as well as the classifications used in the survey. This metadata is updated in each survey operation and is available on the websites of DGEEC (https://estatistica.dgeec.mec.pt/dm.php) and INE (https://smi.ine.pt/DocumentacaoMetodologica?clear=True).
10.6.1. Metadata completeness - rate
Not requested.
10.7. Quality management - documentation
Not available.
11.1. Quality assurance
DGEEC as the institution responsible for the production of official statistics, must respect and be governed by national and international statistical quality standards, in accordance with article 7 of Law Nr. 22/2008 of May 13, and by the European Statistics Code of Practice. In the case of the CIS, DGEEC also follows Eurostat's methodological recommendations.
A thorough validation procedure of data collected is carried out, consisting in finding and correcting internal inconsistencies amoung the sections and questions in survey and by comparing with data from previous years or with other data sources.
All efforts are made to reduce errors or at least to identify and correct them. It's provided assistance to respondents during data collection. During the validation process, enterprises are contacted for further clarifications or for correcting errors, and the imputation of data is residual.
For all questionnaires, the following procedures are carried out:
The electronic form includes validations that allow checking the consistency of the information (it may be necessary to contact the company, if incoherence is found). Inconsistencies of the "Error" type must be resolved before registration is accepted.
Once the data registration is concluded, the information is analysed and processed, namely the analysis of the consistency of the year's data, comparison of values with the previous year for quality control. The collection management application allows the execution of warning error maps.
Some data are confronted with information from other sources considered relevant. The coherence between these sources is mainly based on the fact that only information from variables constructed within the same conceptual framework is used, as for exemple, the R&D data (intramural and extramural expenditures) produced by DGEEC through data collection instruments approved within the NSS.
In the case of outliers observations for innovation expenditure items, the procedures are the following:
- use the information of BES R&D survey, when possible;
- recalculate values using the stratum average of the company (only when there is a minimum number of 3 enterprises in the stratum);
- contact the respondents.
11.2. Quality management - assessment
The Portuguese CIS 2020 was submitted to the necessary approval and was registered in the National Statistical System, meaning that: confidentiality on the information is respected; the survey authorities are senior and trust-worthy; the information collected respects all norms of quality.
The response rate of Core NACE enterprises was 88.7% which represents a turnover rate of 91.8%.
The CIS 2020 electronic web form was developed and designed with online validation rules, namely incoherence between answers alerts.
To help respondents filling up the survey, a phone line was available.
After the submission, in the cases of doubts, enterprises were contacted (by phone/e-mail) in order to confirm or correct the answer.
Apart from that, we validated the information related to - size-class; NACE; innovation expenditures by cross-analysis with administrative data, ex. the statistical business register and the R&D survey.
Relevance is the degree to which statistics meet current and potential users’ needs. It includes the production of all needed statistics and the extent to which concepts used (definitions, classifications etc.) reflect user needs. The aim is to describe the extent to which the statistics are useful to, and used by, the broadest array of users. For this purpose, statisticians need to compile information, firstly about their users and their needs.
The CIS is based on a common questionnaire and a common survey methodology in order to achieve comparable, harmonised and high quality results for EU Member States, EFTA countries, Candidates and Associated countries.
12.1. Relevance - User Needs
The national CIS questionnaire is harmonized with Eurostat's CIS HDC which means that regular European needs are satisfied. In Portuguese CIS2020 survey the NACE coverage was extended to more sections to satisfy other national needs.
12.1.1. Needs at national level
| User group | Short description of user group | Main needs for CIS data of the user group Users’ needs |
| 1. Institutions - European level | European Comission | Eurostat regular transmission data; Fast Track data; Innovation profiles; Regional data; Microdata. |
| 1. Institutions - International organisations | OECD | Data used for annual innovation statistic indicators |
| 1. Institutions - National level |
Ministry of Science, Technology and Higher Education | Data used for policy-making and for overall knowledge about the issue. |
| 1. Institutions - National level | Other Ministries | Data used for sector comparisons |
| 1. Institutions - National level | Statistics Portugal | Data used for annual innovation statistic indicators |
| 3. Media | National or regional media | Data used for analyses and comments on innovation issues |
| 4. Researchers and students | Researchers and students | Data on business innovation used for research on innovation issues |
| 5. Enterprises or businesses | Enterprises or businesses or other private institutions | Data used for market analysis, benchmarking or others. |
12.2. Relevance - User Satisfaction
No satisfaction survey undertaken.
12.3. Completeness
The portuguese CIS 2020 included all questions of the CIS Harmonised Data Collection 2020 (mandatory and non-mandatory), so Portugal transmitted all the cells requested by Eurostat.
Completeness rate is 100%.
12.3.1. Data completeness - rate
Not requested.
13.1. Accuracy - overall
Accuracy in the statistical sense denotes the closeness of computations or estimates to the exact or true values. Statistics are not equal with the true values because of variability (the statistics change from implementation to implementation of the survey due to random effects) and bias (the average of the possible values of the statistics from implementation to implementation is not equal to the true value due to systematic effects).
13.2. Sampling error
That part of the difference between a population value and an estimate thereof, derived from a random sample, which is due to the fact that only a subset of the population is enumerated.
13.2.1. Sampling error - indicators
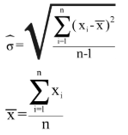
The main indicator used to measure sampling errors for CIS data is the coefficient of variation (CV).
Coefficient of Variation= (Square root of the estimate of the sampling variance) / (Estimated value)
Formula:
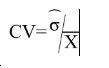
where
13.2.1.1. Coefficient of variations for key variables
Coefficient of variation (%) for key variables by NACE categories and for enterprises with 10 and more employees
| NACE |
Size class |
(1) |
(2) |
(3) |
| Core NACE (B-C-D-E-46-H-J-K-71-72-73) |
Total |
1.65 |
5.44 | 2.92 |
| Core industry (B_C_D_E - excluding construction) |
Total |
2.86 |
8.60 | 5.02
|
| Core Services (46-H-J-K-71-72-73) |
Total |
1.36 |
4.62 | 2.72 |
[1] = Coefficient of variation for the percentage of innovative enterprises (INN) in the total population of enterprises (ENT20)
[2] = Coefficient of variation for the turnover of product innovative enterprises with new or improved products (TUR_PRD_NEW_MKT), as a percentage of total turnover of product innovative enterprises [TUR20,INNO_PRD].
[3] = Coefficient of variation for percentage of product and/or process innovative enterprises (incl. enterprises with abandoned and or on-going activities) involved in any innovation co-operation arrangement [COOP_ALL,INN], as a percentage of innovative enterprises (INN).
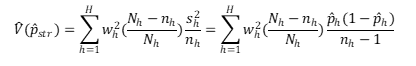
13.2.1.2. Variance estimation method
13.3. Non-sampling error
Non-sampling errors occur in all phases of a survey. They add to the sampling errors (if present) and contribute to decreasing overall accuracy. It is important to assess their relative weight in the total error and devote appropriate resources for their control and assessment.
Not calculated.
13.3.1. Coverage error
Coverage errors (or frame errors) are due to divergences between the target population and the frame population. The frame population is the set of target population members that has a chance to be selected into the survey sample. It is a listing of all items in the population from which the sample is drawn that contains contact details as well as sufficient information to perform stratification and sampling.
13.3.1.1. Over-coverage - rate
Not requested.
13.3.1.2. Common units - proportion
Not requested.
13.3.1.3. Under covered groups of the target population
Not calculated.
13.3.1.4. Coverage errors in coefficient variation
The coefficient of variation reported under 13.2.1.1 does not incorporate the effects of coverage errors.
13.3.2. Measurement error
Measurement errors occur during data collection and generate bias by recording values different than the true ones. The survey questionnaire used for data collection may have led to the recording of wrong values, or there may be respondent or interviewer bias.
Not calculated.
13.3.2.1. Measures for reducing measurement errors
The collection of the data is done by a specific department with trainned personnel prepared to support the respondents. For CIS 2020 the team responsible for the data collection had specific trainning about the main concepts, the functionalities of the online survey and error messages.
13.3.3. Non response error
Non response occurs when a survey fails to collect data on all survey variables from all the population units designated for data collection in a sample or complete enumeration.
There are two types of non-response:
1) Unit non-response, which occurs when no data (or so little as to be unusable) are collected about a population unit designated for data collection.
a) Un-weighted unit non-response rate (%) = 100*(Number of units with no response or not usable response) / (Total number of in-scope (eligible) units in the sample)
b) Weighted unit non-response rate (%) = 100*(Number of weighted units with no response or not usable response) / (Total number of in-scope (eligible) units in the sample)
2) Item non-response, which occurs when only data on some, but not all survey data items are collected about a population unit designated for data collection.
a) Un-weighted item non-response rate (%) = 100*(Number of units with no response at all for the item) / (Total number of eligible, for the item, units in the sample i.e. filters have to be taken into account)
The CIS 2020 electronic web form doesn't allow item non-response.
13.3.3.1. Unit non-response - rate
See below
13.3.3.1.1. Un-weighted and weighted unit non-response rate by NACE categories and for enterprises with 10 or more employed persons
Un-weighted and weighted unit non-response rate by NACE categories and for enterprises with 10 or more employees
| NACE | Number of eligible units with no response | Total number of eligible units in the sample | Un-weighted unit non-response rate (%) | Weighted unit non-response rate (%) |
| Core NACE (B-C-D-E-46-H-J-K-71-72-73) | 930 |
8402 | 11.07% | 15.81% |
| Core industry (B_C_D_E - excluding construction) | 394 | 3479 | 11.33% | 18.14% |
| Core Services (46-H-J-K-71-72-73) | 536 | 4923 | 10.89% | 12.46% |
The number of eligible units is the number of sample units, which indeed belong to the target population.
13.3.3.1.2. Maximum number of recalls/reminders before coding
An enterprise was classified as non-responding when 3 recalls were returned by mail for enterprises only with an address. When an enterprise had alternative addresses 5 recalls were sent.
13.3.3.2. Item non-response - rate
See below.
13.3.3.2.1. Item non-response rate for Turnover (in Core NACE: B-C-D-E-46-H-J-K-71-72-73 enterprises with 10 or more employed persons)
Item non-response rate for Turnover (in Core NACE: B-C-D-E-46-H-J-K-71-72-73 enterprises with 10 or more employees).
| Item non-response rate (un-weighted) | Imputation | If imputed, describe method used, mentioning which auxiliary information or stratification is used | |
| Turnover | 0 | 0 | 0 |
The CIS 2020 electronic web form doesn't allow item non-response.
13.3.3.2.2. Item non response rate for new questions
Item non-response rate for new questions in CIS t (in Core NACE: B-C-D-E-46-H-J-K-71-72-73 enterprises with 10 or more employees)
| NEW QUESTIONS IN CIS 2020 | Inclusion in national questionnaire | Item non response rate (un-weighted) | Comments |
| 2.2 Market conditions faced by enterprise | Yes | 0 | The CIS 2020 electronic web form doesn't allow item non-response. |
| 2.8 Factors related to climate change | Yes | 0 | The CIS 2020 electronic web form doesn't allow item non-response. |
| 3.16 Innovations with environmental benefits | Yes | 0 | The CIS 2020 electronic web form doesn't allow item non-response. |
| 3.17 Factors driving environmental innovations | Yes | 0 | The CIS 2020 electronic web form doesn't allow item non-response. |
13.3.4. Processing error
Processing errors were not identified.
13.3.5. Model assumption error
Not identified.
Timeliness and punctuality refer to time and dates, but in a different manner.
14.1. Timeliness
The timeliness of statistics reflects the length of time between data availability and the event or phenomenon they describe.
14.1.1. Time lag - first result
The CIS 2020 first results were deliver to Eurostat in March 2022 (T+15) through the CIS2020 Fast Track data.
Final results for Eurostat: T+18 (June 2022)
At national level, the publication of the first results was T+16 (April 2022, main results) and T+21 (September 2022).
14.1.2. Time lag - final result
Not requested.
14.2. Punctuality
Punctuality refers to the time lag between the release date of data and the target date on which they were scheduled for release as announced officially.
14.2.1. Punctuality - delivery and publication
Date of transmission of complete and validated data to Eurostat (Number of days between that data and 30 June 2022) : 0
Comparability aims at measuring the impact of differences in applied statistical concepts and definitions on the comparison of statistics between geographical areas, non-geographical domains, or over time.
The coherence of statistical outputs refers to the degree to which the statistical processes by which they were generated used the same concepts (classifications, definitions, and target populations) and harmonised methods. Coherent statistical outputs have the potential to be validly combined and used jointly.
15.1. Comparability - geographical
In order to ensure comparability across countries, Eurostat together with the countries developed a Harmonised Data Collection (HDC) questionnaire accompanied by a set of definitions and methodological recommendations. All questions of CIS 2020 harmonized questionnaire were included in the portuguese questionnaire and all the concepts and its underlying methodology are based on the Oslo Manual (2018) 4th Edition (internationally recognised standard methodology for collecting innovation statistics).
15.1.1. Asymmetry for mirror flow statistics - coefficient
Not requested.
15.1.2. National questionnaire – compliance with Eurostat model questionnaire
Methodological deviations from the CIS Harmonised Data Collection (HDC)
| Questions not included in national questionnaire compared to HDC | Comment |
| All mandatory and optional variables were collected. | |
| Changes in the filtering compared to HDC | Comment |
| No changes in the filtering compared to HDC were applied. | |
15.1.3. National questionnaire – additional questions
Methodological deviations from the CIS Harmonised Data Collection (HDC)
| Additional questions in national questionnaire (not included in HDC) | Comment |
| Yes |
C3.1. of the expenditure indicated in C3. estimate the overall amount spent (in euros) by the enterprise on: Innovation with environmental benefits (cf. definition in question B16) |
15.2. Comparability - over time
Due to important methodological changes driven by Oslo Manual 2018, CIS 2018 and CIS 2020 cannot be directly compared with previous CIS waves.
15.2.1. Length of comparable time series
Not requested.
15.3. Coherence - cross domain
See the comparison between SBS and CIS data in the section 15.3.3 below.
15.3.1. Coherence - sub annual and annual statistics
Not requested.
15.3.2. Coherence - National Accounts
Not requested.
15.3.3. Coherence – Structural Business Statistics (SBS)
This part compares key variables for aggregated CIS data with SBS data
Definition of relative difference between CIS and SBS data: DIFF = (SBS/CIS)*100
Comparison between SBS and CIS data (relative difference) by NACE categories and for enterprises with 10 or more employees
| N98,53ACE | Size class | Number of enterprises (SBS/CIS)* | Number of employees (SBS/CIS)* | Total Turnover (SBS/CIS)* |
| Core NACE (B-C-D-E-46-H-J-K-71-72-73) | Total | 101.75 | 107.13 | 117.17 |
| Core industry (B_C_D_E - excluding construction) | Total | 100.78 | 108.68 | 118.24 |
| Core Services (46-H-J-K-71-72-73) | Total | 103.06 | 105.12 | 116.16 |
* Numbers are to be provided for the last year of the reference period (t)
15.4. Coherence - internal
Not aplicable.
Confidential information on the production cost of the CIS.
16.1. Cost
The assessment of costs associated with a statistical product is a rather complicated task since there must exist a mechanism for appointing portions of shared costs (for instance the business register or shared IT resources and dissemination channels) and overheads (office space, utility bills etc). The assessment must become detailed and clear enough so that international comparisons among agencies of different structures are feasible.
For measuring the cost on statistical offices, Eurostat proposes to make use of the following very short calculation, even if Eurostat is aware of the fact that such a measure may be complicated.
| Costs for the statistical authority | In thousands of national currency |
| Total cost (in thousand currency units) | not calculated |
| Staff cost (in %) | not calculated |
| Other direct cost (in %) | not calculated |
| Overheads (in %) | not calculated |
National currency used for this amount:
17.1. Data revision - policy
Not requested.
17.2. Data revision - practice
Not requested.
17.2.1. Data revision - average size
Not requested.
18.1. Source data
See below
18.1.1. Sampling frame (or census frame)
The sampling frame was selected from the Statistics Portugal business register.
18.1.2. Sampling design
The sampling frame was stratified by economic activity, company size, according to the personnel employed (10-49, 50-249 and 250+) and NUTS2 region. The sample size was determined in order to guarantee the recommended level of precision.
18.1.3. Target population and sample size
| Sample/census indicator | Number of enterprises |
| Target population | 21949 |
| Sample | 8402 |
| In case of combination sample/census: | |
| Sampled units | 6962 |
| Enumerated units/census | 1440 |
| Overall sample rate (overall sample/target population) | 38.28% |
18.1.4. Data source for pre-filled variables
Variables and indicators filled or prefilled from other sources.
| Variables/Indicators | Source | Reference year |
| Turnover | SBS | 2018; 2020 |
| Persons employed | SBS | 2018; 2020 |
| Year of establishement | SBS |
18.1.5. Data source and variables used for derivation and weighting
| Item | Response |
| Data source used for deriving population totals | Statistics Portugal business register |
| Variables used for weighting | Statistics Portugal business register |
18.2. Frequency of data collection
According to the Commission Regulation (UE) 995/2012, the innovation statistics shall be provided to Eurostat every two years in each even year t+18.
18.3. Data collection
See below.
18.3.1. Survey participation
CIS survey is mandatory according to the Portuguese NSS legislation (Law n. 22/2008 of 13th of May).
18.3.2. Survey type
Data was collected using a combination of methods census and sample survey.
18.3.3. Combination of sample survey and census data
The population classes which are covered by sampling are the size classes 10-49 and 50-249 persons employed and by census, the size class 250+ persons employed.
18.3.4. Census criteria
The criteria to conduct a census are the size class 250+ persons employed and all the enterprises in strata with 6 or less.
18.3.5. Data collection method
Data collection method
| Survey method | Yes/No | Comment |
|---|---|---|
| Face-to-face interview | No | |
| Telephone interview | No | |
| Postal questionnaire | No | |
| Electronic questionnaire (format Word or PDF to send back by email) | No | |
| Web survey (online survey available on the platform via URL) | Yes | |
| Other | No |
18.4. Data validation
Not requested.
18.5. Data compilation
Operations performed on data to derive new information according to a given set of rules.
18.5.1. Imputation - rate
Imputation is the method of creating plausible (but artificial) substitute values for all those missing.
Definition of imputation rate:
Imputation rate (for the variable x) (%) = 100*(Number of replaced values) / (Total number of values for a given variable)
Definition of weighted imputation rate:
Weighted imputation rate= 100*(Number of total weighted replaced values) / (Total number of weighted values for a given variable).
Some answers were occasionally corrected, but no imputations were made in fields that were missing. The electronic questionnaire includes validations that do not allow partial answers.
18.5.1.1. Imputation rate for metric variables
Imputation rate for metric variables by NACE categories and for enterprises with 10 or more employees:
| NACE | Size class | Total Turnover (1) | Turnover from products new to the market (2) | R&D expenditure in-house (3) | |||
| Unweighted | Weighted | Unweighted | Weighted | Unweighted | Weighted | ||
| Core NACE (B-C-D-E-46-H-J-K-71-72-73) | Total | 0 | 0 | 0 | 0 | 0 | 0 |
| Core industry (B_C_D_E - excluding construction) | Total | 0 | 0 | 0 | 0 | 0 | 0 |
| Core Services (46-H-J-K-71-72-73) | Total | 0 | 0 | 0 | 0 | 0 | 0 |
(1) = Total turnover in the last year of the reference period (t) (TUR)
(2) = Share of the turnover in the last year of the reference period (t) due to new or improved product new to the market in the total turnover for product innovative enterprises TUR_PRD_NEW_MKT/TUR(INNO_PRD)
(3) = R&D expenditure performed in-house (EXP_INNO_RND_IH)
18.5.2. Weights calculation
Weights calculation method for sample surveys
| Method | Selected applied method | Comments |
| Inverse sampling fraction | Yes | |
| Non-respondent adjustments | No | |
| Other | No |
18.6. Adjustment
For the sample weights we used the inverse of the sampling fraction (using the number of enterprises), as described above. No calibration method was used.
18.6.1. Seasonal adjustment
Not requested.
The Community Innovation Survey (CIS) is a survey about innovation activities in enterprises. The survey is designed to collect the information on types of innovation, processes of development of innovation like cooperation patterns, financing and expenditure, objectives of innovation activities or barriers for initiating or implementing innovation.
The CIS provides statistics by type of innovators, economic activity and size class of enterprises. The survey is currently carried out every two years across the EU Member States, EFTA countries and EU candidate countries.
In order to ensure comparability across countries, Eurostat together with the countries develops a Harmonised Data Collection (HDC) questionnaire and drafts the methodological recommendations for implementation of each survey round.
CIS 2020 is a second in a row to implement concepts and methodology of the Oslo Manual 4th Edition revised in 2018. The changes in the CIS driven by the revision of the manual and their impact on collected indicators are described in the Statistics Explained article: Community Innovation Survey – new features.
The legal framework for CIS since 2012 is the Commission Regulation No 995/2012 that establishes the quality conditions for the data collection and transmission and identifies the obligatory cross-coverage of economic sectors, size class of enterprises and innovation indicators. The target population are enterprises with at least 10 employees classified in the core NACE economic sectors (see 3.3). Further activities may be covered on a voluntary basis in national datasets. Most statistics are based on the 3-year reference period (t, t-1, t-2), but some use only one calendar year (t or t-2). Please refer to the Annex section of the European metadata (ESMS) for details of the time coverage of collected indicators.
30 May 2024
The description of concepts, definitions and main statistical variables is available in CIS 2020 European metadata file (ESMS) Results of the community innovation survey 2020 (CIS2020) (inn_cis12) in Eurostat database.
The enterprise as legal unit.
Core target population are all enterprises in CORE NACE activities (see 3.3.1) with 10 or more employees.
Portugal. The regional dimension (NUTS) is available in national survey at the level of NUTS II.
For CIS 2020, the time covered by the survey is the 3-year period from the beginning of 2018 to the end of 2020.
Some questions and indicators refer to one year — 2020.
The list of indicators covering the 3-year period and referring to one year according to the HDC is available in the Annex section of the European metadata (ESMS).
Accuracy in the statistical sense denotes the closeness of computations or estimates to the exact or true values. Statistics are not equal with the true values because of variability (the statistics change from implementation to implementation of the survey due to random effects) and bias (the average of the possible values of the statistics from implementation to implementation is not equal to the true value due to systematic effects).
CIS indicators are available according to 3 units of measure:
NR: Number for number of enterprises and number of persons employed.
THS_EUR: Thousands of euros. All financial variables are provided in thousands of euros, i.e. Turnover or Innovation expenditure.
PC: Percentage. The percentage is the ratio between the selected combinations of indicators.
Operations performed on data to derive new information according to a given set of rules.
See below
CIS is conducted and disseminated at two-year interval in pair years.
The timeliness of statistics reflects the length of time between data availability and the event or phenomenon they describe.
In order to ensure comparability across countries, Eurostat together with the countries developed a Harmonised Data Collection (HDC) questionnaire accompanied by a set of definitions and methodological recommendations. All questions of CIS 2020 harmonized questionnaire were included in the portuguese questionnaire and all the concepts and its underlying methodology are based on the Oslo Manual (2018) 4th Edition (internationally recognised standard methodology for collecting innovation statistics).
Due to important methodological changes driven by Oslo Manual 2018, CIS 2018 and CIS 2020 cannot be directly compared with previous CIS waves.
