


1.1. Contact organisation
Statistical Office of Montenegro
1.2. Contact organisation unit
Social services statistics
1.3. Contact name
Restricted from publication1.4. Contact person function
Restricted from publication1.5. Contact mail address
IV Proleterske 2, Podgorica
1.6. Contact email address
Restricted from publication1.7. Contact phone number
Restricted from publication1.8. Contact fax number
Restricted from publication2.1. Metadata last certified
30 May 20242.2. Metadata last posted
30 May 20242.3. Metadata last update
30 May 20243.1. Data description
The Community Innovation Survey (CIS) is a survey about innovation activities in enterprises. The survey is designed to collect the information on types of innovation, processes of development of innovation like cooperation patterns, financing and expenditure, objectives of innovation activities or barriers for initiating or implementing innovation.
The CIS provides statistics by type of innovators, economic activity and size class of enterprises. The survey is currently carried out every two years across the EU Member States, EFTA countries and EU candidate countries.
In order to ensure comparability across countries, Eurostat together with the countries develops a Harmonised Data Collection (HDC) questionnaire and drafts the methodological recommendations for implementation of each survey round.
CIS 2020 is a second in a row to implement concepts and methodology of the Oslo Manual 4th Edition revised in 2018. The changes in the CIS driven by the revision of the manual and their impact on collected indicators are described in the Statistics Explained article: Community Innovation Survey – new features.
The legal framework for CIS since 2012 is the Commission Regulation No 995/2012 that establishes the quality conditions for the data collection and transmission and identifies the obligatory cross-coverage of economic sectors, size class of enterprises and innovation indicators. The target population are enterprises with at least 10 employees classified in the core NACE economic sectors (see 3.3). Further activities may be covered on a voluntary basis in national datasets. Most statistics are based on the 3-year reference period (t, t-1, t-2), but some use only one calendar year (t or t-2). Please refer to the Annex section of the European metadata (ESMS) for details of the time coverage of collected indicators
3.2. Classification system
Indicators related to the enterprises are classified by country, economic activity (NACE Rev. 2), size class of enterprises and type of innovation.
The main typology of classification of enterprises in reference to innovation is the distinction between innovation-active enterprises (INN) and not innovation-active enterprises (NINN).
The enterprise is considered as innovative (INN) if during the reference period it successfully introduced a a) product or a) business process innovation, c) completed but not yet implemented the innovation, d) had ongoing innovation activities, e) abandoned innovation activities or was f) engaged in in-house R&D or R&D contracted out. Non-innovative (NINN) enterprises had no innovation activity mentioned above whatsoever during the reference period.
3.3. Coverage - sector
CIS covers main economic sectors according to NACE Rev.2 broken down by size class of enterprises and type of innovation activity.
3.3.1. Main economic sectors covered - NACE Rev.2
In accordance with Commission Regulation 995/2012 on innovation statistics, the following industries and services are included in the core target population. Results are made available with these following breakdowns :
All NACE – Core NACE (NACE Rev. 2 sections & divisions B-C-D-E-46-H-J-K-71-72-73 )
CORE INDUSTRY (excluding construction) (NACE Rev. 2 SECTIONS B_C_D_E)
10-12: Manufacture of food products, beverages and tobacco
13-15: Manufacture of textiles, wearing apparel, leather and related products
16-18: Manufacture of wood, paper, printing and reproduction
20: Manufacture of chemicals and chemical products
21: Manufacture of basic pharmaceutical products and pharmaceutical preparations
19-22: Manufacture of petroleum, chemical, pharmaceutical, rubber and plastic products
23: Manufacture of other non-metallic mineral products
24: Manufacture of basic metals
25: Manufacture of fabricated metal products, except machinery and equipment
26: Manufacture of computer, electronic and optical products
25-30: Manufacture of fabricated metal products (except machinery and equipment), computer, electronic and optical products, electrical equipment, motor vehicles and other transport equipment
31-33: Manufacture of furniture; jewellery, musical instruments, toys; repair and installation of machinery and equipment
D: ELECTRICITY, GAS, STEAM AND AIR CONDITIONING SUPPLY
E: WATER SUPPLY; SEWERAGE, WASTE MANAGEMENT AND REMEDIATION ACTIVITIES
36: Water collection, treatment and supply
37-39: Sewerage, waste management, remediation activities
CORE SERVICES (NACE Rev. 2 sections & divisions 46-H-J-K-71-72-73)(NACE code in the tables = G46-M73_INN)
46: Wholesale trade, except of motor vehicles and motorcycles
H: TRANSPORTATION AND STORAGE
49-51: Land transport and transport via pipelines, water transport and air transport
52-53: Warehousing and support activities for transportation and postal and courier activities
J: INFORMATION AND COMMUNICATION
58: Publishing activities
61: Telecommunications
62: Computer programming, consultancy and related activities
63: Information service activities
K: FINANCIAL AND INSURANCE ACTIVITIES
64: Financial service activities, except insurance and pension funding
65: Insurance, reinsurance and pension funding, except compulsory social security
66: Activities auxiliary to financial services and insurance activities
M: PROFESSIONAL, SCIENTIFIC AND TECHNICAL ACTIVITIES
71: Architectural and engineering activities; technical testing and analysis
72: Scientific research and development
73: Advertising and market research
71-73: Architectural and engineering activities; technical testing and analysis; Scientific research and development; Advertising and market research
3.3.1.1. Main economic sectors covered - NACE Rev.2 - national particularities
Covered NACE activities beyond the CR No. 995/2012
- construction
3.3.2. Sector coverage - size class
In accordance with Commission Regulation 995/2012 on innovation statistics, the following size classes of enterprises according to number of employees are included in the core target population of the CIS:
- 10 - 49 employees
- 50 - 249 employees
- 250 or more employees
3.3.2.1. Sector coverage - size class - national particularities
No deviations.
3.4. Statistical concepts and definitions
The description of concepts, definitions and main statistical variables is available in CIS 2020 European metadata file (ESMS) Results of the community innovation survey 2020 (CIS2020) (inn_cis12) in Eurostat database.
3.5. Statistical unit
According to Section 1 of the Annex II to the Regulation the statistical unit for the CIS 2020 shall be the enterprise, as defined in the Council Regulation 696/1993 on Statistical Units.
In the Council Regulation 696/19932, the enterprise is defined as “the smallest combination of legal units that is an organisational unit producing goods or services, which benefits from a certain degree of autonomy in decision making, especially for the allocation of its current resources. It may carry out one or more activities at one or more locations and it may be a combination of legal units, one legal unit or part of a legal unit.
3.6. Statistical population
Core target population are all enterprises in CORE NACE activities (see 3.3.1) with 10 or more employees.
3.7. Reference area
Territory of Montenegro.
3.8. Coverage - Time
Several rounds of Community Innovation Survey have been conducted so far at two-year interval since end of 90’s.
3.8.1. Participation in the CIS waves
| CIS wave | Reference period | Participation | Comment (deviation from reference period) |
| CIS2 | 1994-1996 | ||
| CIS3 | 1998-2000 | ||
| CIS light | 2002-2003* | ||
| CIS4 | 2002-2004 | ||
| CIS2006 | 2004-2006 | ||
| CIS2008 | 2006-2008 | ||
| CIS2010 | 2008-2010 | ||
| CIS2012 | 2010-2012 | ||
| CIS2014 | 2012-2014 | ||
| CIS2016 | 2014-2016 | Yes | Statistical office of Montenegro conducted a pilot survey and the data was confidential. |
| CIS2018 | 2016-2018 | Yes | Statistical office of Montenegro conducted a pilot survey and the data was confidential. |
| CIS2020 | 2018-2020 | Yes | Statistical Office of Montenegro for the first time implemented a regular survey. |
*two reference periods can be distinguished for CIS light: 2000-2002 and 2001-2003
3.9. Base period
Not relevant.
CIS indicators are available according to 3 units of measure:
NR: Number for number of enterprises and number of persons employed.
THS_EUR: Thousands of euros. All financial variables are provided in thousands of euros, i.e. Turnover or Innovation expenditure.
PC: Percentage. The percentage is the ratio between the selected combinations of indicators.
For CIS 2020, the time covered by the survey is the 3-year period from the beginning of 2018 to the end of 2020.
Some questions and indicators refer to one year — 2020.
The list of indicators covering the 3-year period and referring to one year according to the HDC is available in the Annex section of the European metadata (ESMS).
6.1. Institutional Mandate - legal acts and other agreements
CIS surveys are based on the Commission Regulation No 995/2012, implementing Decision No 1608/2003/EC of the European Parliament and of the Council on the production and development of Community statistics on science and technology.
This Regulation establishes innovation statistics on a statutory basis and makes the delivery of certain variables compulsory e.g. innovation activities, cooperation, development, expenditures and turnover (see the Regulation). Each survey wave may additionally include further variables.
In addition, the Regulation defines the obligatory cross-coverage of economic sectors and size class of enterprises.
6.1.1. National legislation
Legal acts that define the responsibilities and authority of the Statistical Office of Montenegro for collecting, processing and disseminating statistics are the following:
Annual plan of statistical surveys
Programme of activities of Official Statistics for the five-year period
6.2. Institutional Mandate - data sharing
Not requested.
CIS data are transmitted to Eurostat via EDAMIS using the secured transmission system.
7.1. Confidentiality - policy
The confidentiality of individual data is fully ensured relating to enterprises, households and individuals. Individual data on the natural or legal persons are confidential and constitutes an official secret in accordance with Article 56 of the Law on Official Statistics and Official Statistical System of Montenegro ("Official Gazette of Montenegro", No. 18/12 of 30. 3. 2012, 47/19 of 12. 8. 2019).
7.2. Confidentiality - data treatment
The confidential data are sent with an appropriate ‘c’ flag and are restricted from publication.
8.1. Release calendar
Release calendar data is publicly accessible on the website of the Statistical Office of Montenegro. Based on the Statistical Release Calendar, users are informed in advance of the release dates on which the producers of official statistics have committed to publish statistics.
8.2. Release calendar access
Statistical Release Calendar is available on the following link: https://www.monstat.org/eng/page.php?id=12&pageid=12
8.3. Release policy - user access
Information on all new released publications is available on the website of the Statistical Office of Montenegro. The release policy determines the availability of statistical data to all users at the same time.
CIS is conducted and disseminated at two-year interval in pair years.
Accessibility and clarity refer to the simplicity and ease for users to access statistics using simple and user-friendly procedure, obtaining them in an expected form and within an acceptable time period, with the appropriate user information and assistance: a global context which finally enables them to make optimum use of the statistics.
10.1. Dissemination format - News release
See below.
10.1.1. Availability of the releases
| Dissemination and access | Availability | Comments, links, ... |
| Press release | Yes | https://www.monstat.org/eng/page.php?id=1801&pageid=77 |
| Access to public free of charge | Yes | |
| Access to public restricted (membership/password/part of data provided, etc) | No |
10.2. Dissemination format - Publications
- Online database (containing all/most results) :not available
- Analytical publication (referring to all/most results) :not available
- Analytical publication (referring to specific results, e.g. only for one sector or one specific aspect) : not available
10.3. Dissemination format - online database
not available
10.3.1. Data tables - consultations
Not requested.
10.4. Dissemination format - microdata access
In accordance with Article 58 of the Law on Official Statistics and the System of Official Statistics ("Official Gazette of Montenegro", no. 18/12 and 47/19), the providing individual data with no identifiers is possible, at the written request of a scientific research institution for the purpose of carrying out scientific research activities as well as to international statistical organizations and statistics producers from other countries. The use of this data is governed by the contract and the Instruction on the method of providing individual statistical data, without identifiers, for scientific and research purposes.
10.4.1. Dissemination of microdata
| Mean of dissemination | Availability of microdata | Comments, links, ... |
| Eurostat SAFE centre | Yes | |
| National SAFE centre | Yes | |
| Eurostat: partially anonymised data (SUF) | ||
| National : partially anonymised data |
10.5. Dissemination format - other
No other means of dissemination.
10.5.1. Metadata - consultations
Not requested.
10.6. Documentation on methodology
Methodological documents are published on the website of the Statistical Office of Montenegro on the following link: https://www.monstat.org/eng/page.php?id=1800&pageid=1
10.6.1. Metadata completeness - rate
Not requested.
10.7. Quality management - documentation
The Law on Official Statistics and Official Statistical System (Official Gazette of Montenegro No 18/12 and 047/19) defines the commitment to quality which ensures that official statistical producers in Montenegro work and cooperate in accordance with the international principles of statistical system quality. Development Strategy and Programme of Official Statistics for 2019-2023 define the objectives of development. One of the objectives is quality management via monitoring the implementation of European Statistical Code of Practice. Pursuant to the ESS Quality Declaration, Article 338 of the Contract on EU Functioning, Regulation 759/2015 and Regulation 223/2009 as well as European Statistical Code of Practice, the following documents are in adoption procedure: 1. Quality Strategy of Statistical Office 2. Guide for Implementation of Quality Strategy in Statistical Office 3. Implementation Plan.
11.1. Quality assurance
Statistical Office has chosen the implementation of elements of TQM (Total Quality Management) model that foster development and improvement of functioning of: - Institution, - Official statistical result production and - Individual. Within middle-term deadline, Statistical Office has chosen the TQM implementation through the following objectives: 1. Strong commitment to users and other interested parties, 2. Quality statistical processes and products, 3. Professional orientation of staff members, 4. Constant improvements, 5. Reduction of overburden of reporting units.
11.2. Quality management - assessment
The methodology recommended by Eurostat was adopted and experiences of the pilot rounds of the national innovation data collections were taken into account. Coverage of the survey, reference period, used methodology for sampling, data collection, checking and data processing followed the Eurostat methodology and recommendations.
Relevance is the degree to which statistics meet current and potential users’ needs. It includes the production of all needed statistics and the extent to which concepts used (definitions, classifications etc.) reflect user needs. The aim is to describe the extent to which the statistics are useful to, and used by, the broadest array of users. For this purpose, statisticians need to compile information, firstly about their users and their needs.
The CIS is based on a common questionnaire and a common survey methodology in order to achieve comparable, harmonised and high quality results for EU Member States, EFTA countries, Candidates and Associated countries.
12.1. Relevance - User Needs
At the international level main user is the European Commissin, Eurostat, as well as Innovation Union Scoreboard.
The users at national level are listed under 12.1.1
12.1.1. Needs at national level
| User group | Short description of user group | Main needs for CIS data of the user group Users’ needs |
| Institutions -National level | Statistical office of Montenegro | Data used for national publications on innovation |
| Institutions -National level | Ministry of Science and Technological Development | Data used for analysis and international comparisons |
| Institutions -National level | Ministry of Economic Development and Tourism | Data used for internal analysis |
| Institutions -National level | National media | Data used for public information |
| Institutions -National level | Scientific-research institutes and students | Data used for national and international scientific-research projects |
12.2. Relevance - User Satisfaction
A targeted measurement of user satisfaction specifically with the data from the survey on innovation activities of enterprises is not conducted.
12.3. Completeness
The survey was conducted by the Statistical office of Montenegro and was completely in accordance with the survey entitled "Community Innovation Survey", which is conducted in the European Union every two years. The survey covers all mandatory and optional variables laid down in Commission Regulation (EC) No 995/2012 of 26 October 2012 implementing Decision No 1608/2003/EC of the European Parliament and of the Council concerning the production and development of Community statistics on science and technology.
Completeness aspects as regards innovation data is good.
12.3.1. Data completeness - rate
Not requested.
13.1. Accuracy - overall
Accuracy in the statistical sense denotes the closeness of computations or estimates to the exact or true values. Statistics are not equal with the true values because of variability (the statistics change from implementation to implementation of the survey due to random effects) and bias (the average of the possible values of the statistics from implementation to implementation is not equal to the true value due to systematic effects).
13.2. Sampling error
That part of the difference between a population value and an estimate thereof, derived from a random sample, which is due to the fact that only a subset of the population is enumerated.
13.2.1. Sampling error - indicators
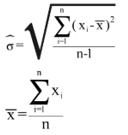
The main indicator used to measure sampling errors for CIS data is the coefficient of variation (CV).
Coefficient of Variation= (Square root of the estimate of the sampling variance) / (Estimated value)
Formula:
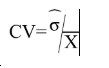
where
13.2.1.1. Coefficient of variations for key variables
Coefficient of variation (%) for key variables by NACE categories and for enterprises with 10 and more employees
| NACE |
Size class |
(1) |
(2) |
(3) |
| Core NACE (B-C-D-E-46-H-J-K-71-72-73) |
Total |
0.01354 |
0.03444 |
0.02554 |
| Core industry (B_C_D_E - excluding construction) |
Total |
0.01887 |
0.03956 |
0.02874 |
| Core Services (46-H-J-K-71-72-73) |
Total |
0.01587 |
0.03911 |
0.02786 |
[1] = Coefficient of variation for the percentage of innovative enterprises (INN) in the total population of enterprises (ENT20)
[2] = Coefficient of variation for the turnover of product innovative enterprises with new or improved products (TUR_PRD_NEW_MKT), as a percentage of total turnover of product innovative enterprises [TUR20,INNO_PRD].
[3] = Coefficient of variation for percentage of product and/or process innovative enterprises (incl. enterprises with abandoned and or on-going activities) involved in any innovation co-operation arrangement [COOP_ALL,INN], as a percentage of innovative enterprises (INN).
13.2.1.2. Variance estimation method
For calculating variance estimation Statsitical Office applying SAS procedure.
13.3. Non-sampling error
Non-sampling errors occur in all phases of a survey. They add to the sampling errors (if present) and contribute to decreasing overall accuracy. It is important to assess their relative weight in the total error and devote appropriate resources for their control and assessment.
13.3.1. Coverage error
Coverage errors (or frame errors) are due to divergences between the target population and the frame population. The frame population is the set of target population members that has a chance to be selected into the survey sample. It is a listing of all items in the population from which the sample is drawn that contains contact details as well as sufficient information to perform stratification and sampling.
13.3.1.1. Over-coverage - rate
Not requested.
13.3.1.2. Common units - proportion
Not requested.
13.3.1.3. Under covered groups of the target population
Enterprises that were liquidated during the period are deleted from the are deleted from the Statistical business register, sample and target population, unless it was decided that their liquidation was so late in the survey period that they should be included in the target population.
13.3.1.4. Coverage errors in coefficient variation
Effects of coverage errors are incorporated in the variance estimation, in a way that in non-response adjustment procedure small, medium and large enterprises are treated in different manner. Non-response weights for small enterprises are calculated as the ratio of the number of selected units and the number of units that participated in the survey, while the non-response weights for medium and large enterprises are calculated as the ratio of the eligible units and the number of units that participated in the survey. The reason for this is that we assume that small enterprises that no longer exist are easily replaced with new small enterpise, while medium and large enterprises could not be easily replaced. In that way we imputed the response for small enterprises, altough they no longer exist.
13.3.2. Measurement error
Measurement errors occur during data collection and generate bias by recording values different than the true ones. The survey questionnaire used for data collection may have led to the recording of wrong values, or there may be respondent or interviewer bias.
13.3.2.1. Measures for reducing measurement errors
In order to reduce errors in the questionnaire, we took measures to clarify some questions and concepts through the methodological instructions that were sent with the questionnaire on innovations. Before sending the questionnaire to the field, we carried out cognitive testing of the questionnaire (online), in order to avoid possible mistakes due to misunderstanding of questions and concepts from the questionnaire.
13.3.3. Non response error
Non response occurs when a survey fails to collect data on all survey variables from all the population units designated for data collection in a sample or complete enumeration.
There are two types of non-response:
1) Unit non-response, which occurs when no data (or so little as to be unusable) are collected about a population unit designated for data collection. Un-weighted unit non-response rate (%) = 100*(Number of units with no response or not usable response) / (Total number of in-scope (eligible) units in the sample)
2) Item non-response, which occurs when only data on some, but not all survey data items are collected about a population unit designated for data collection.
Un-weighted item non-response rate (%) = 100*(Number of units with no response at all for the item) / (Total number of eligible, for the item, units in the sample i.e. filters have to be taken into account)
13.3.3.1. Unit non-response - rate
See below.
13.3.3.1.1. Un-weighted and weighted unit non-response rate by NACE categories and for enterprises with 10 or more employed persons
Un-weighted and weighted unit non-response rate by NACE categories and for enterprises with 10 or more employees
| NACE | Number of eligible units with no response | Total number of eligible units in the sample | Un-weighted unit non-response rate (%) | Weighted unit non-response rate (%) |
| Core NACE (B-C-D-E-46-H-J-K-71-72-73) | 380 | 301 | 0.558003 | |
| Core industry (B_C_D_E - excluding construction) | 144 | 67 | 0.682464 | |
| Core Services (46-H-J-K-71-72-73) | 201 | 185 | 0.520725 |
The number of eligible units is the number of sample units, which indeed belong to the target population.
13.3.3.1.2. Maximum number of recalls/reminders before coding
13.3.3.2. Item non-response - rate
See below.
13.3.3.2.1. Item non-response rate for Turnover (in Core NACE: B-C-D-E-46-H-J-K-71-72-73 enterprises with 10 or more employed persons)
Item non-response rate for Turnover (in Core NACE: B-C-D-E-46-H-J-K-71-72-73 enterprises with 10 or more employees).
| Item non-response rate (un-weighted) | Imputation | If imputed, describe method used, mentioning which auxiliary information or stratification is used | |
| Turnover |
13.3.3.2.2. Item non response rate for new questions
Item non-response rate for new questions in CIS t (in Core NACE: B-C-D-E-46-H-J-K-71-72-73 enterprises with 10 or more employees)
| NEW QUESTIONS IN CIS 2020 | Inclusion in national questionnaire | Item non response rate (un-weighted) | Comments |
| 2.2 Market conditions faced by enterprise | |||
| 2.8 Factors related to climate change | |||
| 3.16 Innovations with environmental benefits | |||
| 3.17 Factors driving environmental innovations |
13.3.4. Processing error
At this phase we have done the logical checks where all the errors were identified.
13.3.5. Model assumption error
Not requested.
Timeliness and punctuality refer to time and dates, but in a different manner.
14.1. Timeliness
The timeliness of statistics reflects the length of time between data availability and the event or phenomenon they describe.
14.1.1. Time lag - first result
Timeliness of national data – date of first release of national level : 25/7/2022
14.1.2. Time lag - final result
Not requested.
14.2. Punctuality
Punctuality refers to the time lag between the release date of data and the target date on which they were scheduled for release as announced officially.
14.2.1. Punctuality - delivery and publication
Date of transmission of complete and validated data to Eurostat (Number of days between that data and 30 June 2022) :
Comparability aims at measuring the impact of differences in applied statistical concepts and definitions on the comparison of statistics between geographical areas, non-geographical domains, or over time.
The coherence of statistical outputs refers to the degree to which the statistical processes by which they were generated used the same concepts (classifications, definitions, and target populations) and harmonised methods. Coherent statistical outputs have the potential to be validly combined and used jointly.
15.1. Comparability - geographical
In our country, there is no geographical comparability between regions in the country.
15.1.1. Asymmetry for mirror flow statistics - coefficient
Not requested.
15.1.2. National questionnaire – compliance with Eurostat model questionnaire
Methodological deviations from the CIS Harmonised Data Collection (HDC)
| Questions not included in national questionnaire compared to HDC | Comment |
| All mandatory and voluntary variables were collected. | |
| Changes in the filtering compared to HDC | Comment |
15.1.3. National questionnaire – additional questions
Methodological deviations from the CIS Harmonised Data Collection (HDC)
| Additional questions in national questionnaire (not included in HDC) | Comment |
| Subquestion on about reducing costs and improving quality in the business process and the question about the number of innovative projects. |
We have added a subquestion at the request of the Ministry of Science and Technological Development on about reducing costs and improving quality in the business process and the question about the number of innovative projects. |
15.2. Comparability - over time
Due to important methodological changes driven by Oslo Manual 2018, CIS 2018 and CIS 2020 cannot be directly compared with previous CIS waves.
15.2.1. Length of comparable time series
Not requested.
15.3. Coherence - cross domain
See the comparison between SBS and CIS data in the section 15.3.3 below.
15.3.1. Coherence - sub annual and annual statistics
Not requested.
15.3.2. Coherence - National Accounts
Not requested.
15.3.3. Coherence – Structural Business Statistics (SBS)
This part compares key variables for aggregated CIS data with SBS data
Definition of relative difference between CIS and SBS data: DIFF = (SBS/CIS)*100
Comparison between SBS and CIS data (relative difference) by NACE categories and for enterprises with 10 or more employees
| NACE | Size class | Number of enterprises (SBS/CIS)* | Number of employees (SBS/CIS)* | Total Turnover (SBS/CIS)* |
| Core NACE (B-C-D-E-46-H-J-K-71-72-73) | Total | |||
| Core industry (B_C_D_E - excluding construction) | Total | |||
| Core Services (46-H-J-K-71-72-73) | Total |
* Numbers are to be provided for the last year of the reference period (t)
15.4. Coherence - internal
Not requested.
Confidential information on the production cost of the CIS.
16.1. Cost
The assessment of costs associated with a statistical product is a rather complicated task since there must exist a mechanism for appointing portions of shared costs (for instance the business register or shared IT resources and dissemination channels) and overheads (office space, utility bills etc). The assessment must become detailed and clear enough so that international comparisons among agencies of different structures are feasible.
For measuring the cost on statistical offices, Eurostat proposes to make use of the following very short calculation, even if Eurostat is aware of the fact that such a measure may be complicated.
| Costs for the statistical authority | In thousands of national currency |
| Total cost (in thousand currency units) | |
| Staff cost (in %) | |
| Other direct cost (in %) | |
| Overheads (in %) |
National currency used for this amount:
17.1. Data revision - policy
Not requested.
17.2. Data revision - practice
Not requested.
17.2.1. Data revision - average size
Not requested.
18.1. Source data
See below:
18.1.1. Sampling frame (or census frame)
The sampling frame was made by using national business register.
18.1.2. Sampling design
Data were collected through sample survey. All units were divided into strata defined by 2 digit Nace activity and by size classes.
18.1.3. Target population and sample size
| Sample/census indicator | Number of enterprises |
| Target population | 660 |
| Sample | 660 |
| In case of combination sample/census: | |
| Sampled units | |
| Enumerated units/census | |
| Overall sample rate (overall sample/target population) | 1 |
18.1.4. Data source for pre-filled variables
Variables and indicators filled or prefilled from other sources.
| Variables/Indicators | Source | Reference year |
|---|---|---|
| ID | Adress book | 2020 |
| NUTS | Statistical Business Register (SBR) | 2020 |
| NACE | SBR | 2020 |
| EMP18 | SBR | 2020 |
| EMP20 | SBR | 2020 |
| TUR18 | SBR | 2020 |
| TUR20 | SBR | 2020 |
| ENTGRP_HD_NAT | SBR | 2020 |
| ENTGRP_ENT_EG_NAT | SBR | 2020 |
18.1.5. Data source and variables used for derivation and weighting
| Item | Response |
| Data source used for deriving population totals | The official, up-to-date, statistical business register of CBS was used for deriving population totals and other needed variables. |
| Variables used for weighting | Number of selected units from strata in sample, total number of units in strata from population (for design weight), number of existing selected units in sample and number of existing units that have responded (for response weights). |
18.2. Frequency of data collection
According to the Commission Regulation (UE) 995/2012, the innovation statistics shall be provided to Eurostat every two years in each even year t+18.
18.3. Data collection
The method of data collection was paper (sending the questionnaire by post) and sending the questionnaire electronically in word and pdf format.
18.3.1. Survey participation
The survey is mandatory.
18.3.2. Survey type
Data were collected through sample survey.
18.3.3. Combination of sample survey and census data
Not available.
18.3.4. Census criteria
Not available.
18.3.5. Data collection method
Data collection method
| Survey method | Yes/No | Comment |
|---|---|---|
| Face-to-face interview | NO | |
| Telephone interview | No | |
| Postal questionnaire | YES | |
| Electronic questionnaire (format Word or PDF to send back by email) | YES | |
| Web survey (online survey available on the platform via URL) | NO | |
| Other | NO |
18.4. Data validation
Not requested.
18.5. Data compilation
Operations performed on data to derive new information according to a given set of rules.
18.5.1. Imputation - rate
Imputation is the method of creating plausible (but artificial) substitute values for all those missing.
Definition of imputation rate:
Imputation rate (for the variable x) (%) = 100*(Number of replaced values) / (Total number of values for a given variable)
Definition of weighted imputation rate:
Weighted imputation rate= 100*(Number of total weighted replaced values) / (Total number of weighted values for a given variable)
18.5.1.1. Imputation rate for metric variables
Imputation rate for metric variables by NACE categories and for enterprises with 10 or more employees:
| NACE | Size class | Total Turnover (1) | Turnover from products new to the market (2) | R&D expenditure in-house (3) | |||
| Unweighted | Weighted | Unweighted | Weighted | Unweighted | Weighted | ||
| Core NACE (B-C-D-E-46-H-J-K-71-72-73) | Total | ||||||
| Core industry (B_C_D_E - excluding construction) | Total | ||||||
| Core Services (46-H-J-K-71-72-73) | Total | ||||||
(1) = Total turnover in the last year of the reference period (t) (TUR)
(2) = Share of the turnover in the last year of the reference period (t) due to new or improved product new to the market in the total turnover for product innovative enterprises TUR_PRD_NEW_MKT/TUR(INNO_PRD)
(3) = R&D expenditure performed in-house (EXP_INNO_RND_IH)
18.5.2. Weights calculation
Weights calculation method for sample surveys
| Method | Selected applied method | Comments |
| Inverse sampling fraction | ||
| Non-respondent adjustments | ||
| Other |
18.6. Adjustment
No calibration method used.
18.6.1. Seasonal adjustment
Not requested.
The Community Innovation Survey (CIS) is a survey about innovation activities in enterprises. The survey is designed to collect the information on types of innovation, processes of development of innovation like cooperation patterns, financing and expenditure, objectives of innovation activities or barriers for initiating or implementing innovation.
The CIS provides statistics by type of innovators, economic activity and size class of enterprises. The survey is currently carried out every two years across the EU Member States, EFTA countries and EU candidate countries.
In order to ensure comparability across countries, Eurostat together with the countries develops a Harmonised Data Collection (HDC) questionnaire and drafts the methodological recommendations for implementation of each survey round.
CIS 2020 is a second in a row to implement concepts and methodology of the Oslo Manual 4th Edition revised in 2018. The changes in the CIS driven by the revision of the manual and their impact on collected indicators are described in the Statistics Explained article: Community Innovation Survey – new features.
The legal framework for CIS since 2012 is the Commission Regulation No 995/2012 that establishes the quality conditions for the data collection and transmission and identifies the obligatory cross-coverage of economic sectors, size class of enterprises and innovation indicators. The target population are enterprises with at least 10 employees classified in the core NACE economic sectors (see 3.3). Further activities may be covered on a voluntary basis in national datasets. Most statistics are based on the 3-year reference period (t, t-1, t-2), but some use only one calendar year (t or t-2). Please refer to the Annex section of the European metadata (ESMS) for details of the time coverage of collected indicators
The description of concepts, definitions and main statistical variables is available in CIS 2020 European metadata file (ESMS) Results of the community innovation survey 2020 (CIS2020) (inn_cis12) in Eurostat database.
According to Section 1 of the Annex II to the Regulation the statistical unit for the CIS 2020 shall be the enterprise, as defined in the Council Regulation 696/1993 on Statistical Units.
In the Council Regulation 696/19932, the enterprise is defined as “the smallest combination of legal units that is an organisational unit producing goods or services, which benefits from a certain degree of autonomy in decision making, especially for the allocation of its current resources. It may carry out one or more activities at one or more locations and it may be a combination of legal units, one legal unit or part of a legal unit.
Core target population are all enterprises in CORE NACE activities (see 3.3.1) with 10 or more employees.
Territory of Montenegro.
For CIS 2020, the time covered by the survey is the 3-year period from the beginning of 2018 to the end of 2020.
Some questions and indicators refer to one year — 2020.
The list of indicators covering the 3-year period and referring to one year according to the HDC is available in the Annex section of the European metadata (ESMS).
Accuracy in the statistical sense denotes the closeness of computations or estimates to the exact or true values. Statistics are not equal with the true values because of variability (the statistics change from implementation to implementation of the survey due to random effects) and bias (the average of the possible values of the statistics from implementation to implementation is not equal to the true value due to systematic effects).
CIS indicators are available according to 3 units of measure:
NR: Number for number of enterprises and number of persons employed.
THS_EUR: Thousands of euros. All financial variables are provided in thousands of euros, i.e. Turnover or Innovation expenditure.
PC: Percentage. The percentage is the ratio between the selected combinations of indicators.
Operations performed on data to derive new information according to a given set of rules.
See below:
CIS is conducted and disseminated at two-year interval in pair years.
The timeliness of statistics reflects the length of time between data availability and the event or phenomenon they describe.
In our country, there is no geographical comparability between regions in the country.
Due to important methodological changes driven by Oslo Manual 2018, CIS 2018 and CIS 2020 cannot be directly compared with previous CIS waves.