


1.1. Contact organisation
Croatian Bureau of Statistics (CBS)
1.2. Contact organisation unit
Innovations, Science and Technologies Unit
1.3. Contact name
Confidential because of GDPR
1.4. Contact person function
Confidential because of GDPR
1.5. Contact mail address
Ilica 3, 10 000 Zagreb, Croatia
1.6. Contact email address
Confidential because of GDPR
1.7. Contact phone number
Confidential because of GDPR
1.8. Contact fax number
Confidential because of GDPR
1 July 2021
2.1. Metadata last certified
30 May 2024
2.2. Metadata last posted
30 May 2024
2.3. Metadata last update
30 May 2024
3.1. Data description
The Community Innovation Survey (CIS) is a survey about innovation activities in enterprises. The survey is designed to collect the information on types of innovation, processes of development of innovation like cooperation patterns, financing and expenditure, objectives of innovation activities or barriers for initiating or implementing innovation.
The CIS provides statistics by type of innovators, economic activity and size class of enterprises. The survey is currently carried out every two years across the EU Member States, EFTA countries and EU candidate countries.
In order to ensure comparability across countries, Eurostat together with the countries develops a Harmonised Data Collection (HDC) questionnaire and drafts the methodological recommendations for implementation of each survey round.
CIS 2020 is a second in a row to implement concepts and methodology of the Oslo Manual 4th Edition revised in 2018. The changes in the CIS driven by the revision of the manual and their impact on collected indicators are described in the Statistics Explained article: Community Innovation Survey – new features.
The legal framework for CIS since 2012 is the Commission Regulation No 995/2012 that establishes the quality conditions for the data collection and transmission and identifies the obligatory cross-coverage of economic sectors, size class of enterprises and innovation indicators. The target population are enterprises with at least 10 employees classified in the core NACE economic sectors (see 3.3). Further activities may be covered on a voluntary basis in national datasets. Most statistics are based on the 3-year reference period (t, t-1, t-2), but some use only one calendar year (t or t-2). Please refer to the Annex section of the European metadata (ESMS) for details of the time coverage of collected indicators.
3.2. Classification system
Indicators related to the enterprises are classified by country, economic activity (NACE Rev. 2), size class of enterprises and type of innovation.
The main typology of classification of enterprises in reference to innovation is the distinction between innovation-active enterprises (INN) and not innovation-active enterprises (NINN).
The enterprise is considered as innovative (INN) if during the reference period it successfully introduced a a) product or a) business process innovation, c) completed but not yet implemented the innovation, d) had ongoing innovation activities, e) abandoned innovation activities or was f) engaged in in-house R&D or R&D contracted out. Non-innovative (NINN) enterprises had no innovation activity mentioned above whatsoever during the reference period.
3.3. Coverage - sector
CIS covers main economic sectors according to NACE Rev.2 broken down by size class of enterprises and type of innovation activity.
3.3.1. Main economic sectors covered - NACE Rev.2
In accordance with Commission Regulation 995/2012 on innovation statistics, the following industries and services are included in the core target population. Results are made available with these following breakdowns :
All NACE – Core NACE (NACE Rev. 2 sections & divisions B-C-D-E-46-H-J-K-71-72-73 )
CORE INDUSTRY (excluding construction) (NACE Rev. 2 SECTIONS B_C_D_E)
10-12: Manufacture of food products, beverages and tobacco
13-15: Manufacture of textiles, wearing apparel, leather and related products
16-18: Manufacture of wood, paper, printing and reproduction
20: Manufacture of chemicals and chemical products
21: Manufacture of basic pharmaceutical products and pharmaceutical preparations
19-22: Manufacture of petroleum, chemical, pharmaceutical, rubber and plastic products
23: Manufacture of other non-metallic mineral products
24: Manufacture of basic metals
25: Manufacture of fabricated metal products, except machinery and equipment
26: Manufacture of computer, electronic and optical products
25-30: Manufacture of fabricated metal products (except machinery and equipment), computer, electronic and optical products, electrical equipment, motor vehicles and other transport equipment
31-33: Manufacture of furniture; jewellery, musical instruments, toys; repair and installation of machinery and equipment
D: ELECTRICITY, GAS, STEAM AND AIR CONDITIONING SUPPLY
E: WATER SUPPLY; SEWERAGE, WASTE MANAGEMENT AND REMEDIATION ACTIVITIES
36: Water collection, treatment and supply
37-39: Sewerage, waste management, remediation activities
CORE SERVICES (NACE Rev. 2 sections & divisions 46-H-J-K-71-72-73)(NACE code in the tables = G46-M73_INN)
46: Wholesale trade, except of motor vehicles and motorcycles
H: TRANSPORTATION AND STORAGE
49-51: Land transport and transport via pipelines, water transport and air transport
52-53: Warehousing and support activities for transportation and postal and courier activities
J: INFORMATION AND COMMUNICATION
58: Publishing activities
61: Telecommunications
62: Computer programming, consultancy and related activities
63: Information service activities
K: FINANCIAL AND INSURANCE ACTIVITIES
64: Financial service activities, except insurance and pension funding
65: Insurance, reinsurance and pension funding, except compulsory social security
66: Activities auxiliary to financial services and insurance activities
M: PROFESSIONAL, SCIENTIFIC AND TECHNICAL ACTIVITIES
71: Architectural and engineering activities; technical testing and analysis
72: Scientific research and development
73: Advertising and market research
71-73: Architectural and engineering activities; technical testing and analysis; Scientific research and development; Advertising and market research
3.3.1.1. Main economic sectors covered - NACE Rev.2 - national particularities
Due to its significance in the economy of Croatia, we have additionally surveyed NACE 41-43, 55-56 and 68 apart from the core industries. Furthermore we also surveyed NACE 59 and 60.
3.3.2. Sector coverage - size class
In accordance with Commission Regulation 995/2012 on innovation statistics, the following size classes of enterprises according to number of employees are included in the core target population of the CIS:
- 10 - 49 employees
- 50 - 249 employees
- 250 or more employees
3.3.2.1. Sector coverage - size class - national particularities
No deviations.
3.4. Statistical concepts and definitions
The description of concepts, definitions and main statistical variables is available in CIS 2020 European metadata file (ESMS) Results of the community innovation survey 2020 (CIS2020) (inn_cis12) in Eurostat database.
3.5. Statistical unit
In accordance with Commission Regulation 995/2012 on innovation statistics, it is required that Member States set up and maintain a register of enterprises, as well as associated legal units and local units.
The basic units of statistical characteristics (observations) to which data refer are legal units - legal entities and natural persons. In national context, until recently it was considered that one legal unit in the statistical business register equals to one enterprise. A legal unit has a complete set of records and autonomy in decision-making. The ongoing process of enterprise profiling will enable us to use the statistical unit enterprise in the future in order to be aligned with the EBS Regulation (and if decided so by the WG STI). For reasons of simplifying further text, we shall use the term enterprise.
3.6. Statistical population
Core target population are all enterprises in CORE NACE activities (see 3.3.1) with 10 or more employees.
3.7. Reference area
The survey was conducted according to NUTS 2021 - 4 regions: Panonska Hrvatska, Jadranska Hrvatska, Grad Zagreb and Sjeverna Hrvatska.
3.8. Coverage - Time
Several rounds of Community Innovation Survey have been conducted so far at two-year interval since end of 90’s.
3.8.1. Participation in the CIS waves
| CIS wave | Reference period | Participation | Comment (deviation from reference period) |
| CIS2 | 1994-1996 | ||
| CIS3 | 1998-2000 | ||
| CIS light | 2002-2003* | ||
| CIS4 | 2002-2004 | ||
| CIS2006 | 2004-2006 | ||
| CIS2008 | 2006-2008 | Yes | No |
| CIS2010 | 2008-2010 | Yes | No |
| CIS2012 | 2010-2012 | Yes | No |
| CIS2014 | 2012-2014 | Yes | No |
| CIS2016 | 2014-2016 | Yes | No |
| CIS2018 | 2016-2018 | Yes | No |
| CIS2020 | 2018-2020 | Yes | No |
*two reference periods can be distinguished for CIS light: 2000-2002 and 2001-2003
3.9. Base period
Not relevant.
CIS indicators are available according to 3 units of measure:
NR: Number for number of enterprises and number of persons employed.
THS_EUR: Thousands of euros. All financial variables are provided in thousands of euros, i.e. Turnover or Innovation expenditure.
PC: Percentage. The percentage is the ratio between the selected combinations of indicators.
For CIS 2020, the time covered by the survey is the 3-year period from the beginning of 2018 to the end of 2020.
Some questions and indicators refer to one year — 2020.
The list of indicators covering the 3-year period and referring to one year according to the HDC is available in the Annex section of the European metadata (ESMS).
6.1. Institutional Mandate - legal acts and other agreements
CIS surveys are based on the Commission Regulation No 995/2012, implementing Decision No 1608/2003/EC of the European Parliament and of the Council on the production and development of Community statistics on science and technology.
This Regulation establishes innovation statistics on a statutory basis and makes the delivery of certain variables compulsory e.g. innovation activities, cooperation, development, expenditures and turnover (see the Regulation). Each survey wave may additionally include further variables.
In addition, the Regulation defines the obligatory cross-coverage of economic sectors and size class of enterprises.
6.1.1. National legislation
Legal acts that define the responsibilities and authority of the Croatian Bureau of Statistics for collecting, processing and disseminating statistics are the following:
Official Statistics Act (NN, No. 25/20) Official_Statistics_Act_2020.pdf (gov.hr)
Programme of Statistical Activities of the Republic of Croatia (NN, No. 29/22) Program statističkih aktivnosti Republike Hrvatske 2021. – 2027. (nn.hr)
Annual Implementation Plan of Statistical Activities of the Republic of Croatia 2021 (NN, No 42/2022) Godišnji provedbeni plan statističkih aktivnosti Republike Hrvatske 2021. (nn.hr)
6.2. Institutional Mandate - data sharing
Not requested.
CIS data are transmitted to Eurostat via EDAMIS using the secured transmission system.
7.1. Confidentiality - policy
Statistical data collected in this survey, according to the National Statistics Act (NN, 25/20.) is confidential and its purpose is restricted exclusively to statistical usage (with exception of registered researchers under specified conditions). Authorized interviewers are obligated to respect these restrictions. The results will be published in a cumulative form which prevents displaying data on individuals.
7.2. Confidentiality - data treatment
The following rules are used to identify sensitive cells in tabular data:
- Threshold rule: The cell is considered sensitive if the cell frequency is less than a pre-specified threshold value. In practice this means if data in certain cell in the table relates to less than a pre-specified number of reporting units, the cell is primary sensitive.
- Dominance rule: The cell is considered sensitive if the value of 1 largest contributor in the cell exceeds a pre-specified percentage of total value for that cell.
When a data cell in a table is suppressed by dropping its value based on a primary cell suppression rule, the value of that cell can still be calculated if the table provides totals. Secondary cell suppression is therefore needed to avoid such disclosures. Those values under primary and secondary protection are therefore suppressed for use.
8.1. Release calendar
There is a release policy and release calendar which is publicly accessible on CBS website (Državni zavod za statistiku - Home (gov.hr))
Kalendar objavljivanja statističkih podataka 2022. (gov.hr)
Program publiciranja 2022_Web.pdf (gov.hr)
8.2. Release calendar access
Kalendar objavljivanja statističkih podataka 2022. (gov.hr)
8.3. Release policy - user access
According to the Release Date announced in the Publishing Programme and in the Calendar of Statistical Data Issues, publications of the Croatian Bureau of Statistics are released at 11:00 a.m. precisely thus abiding by the Principle of Timeliness of the European Statistics Code of Practice, i.e. standard daily time set for the release.
CIS is conducted and disseminated at two-year interval.
Accessibility and clarity refer to the simplicity and ease for users to access statistics using simple and user-friendly procedure, obtaining them in an expected form and within an acceptable time period, with the appropriate user information and assistance: a global context which finally enables them to make optimum use of the statistics.
10.1. Dissemination format - News release
See below.
10.1.1. Availability of the releases
| Dissemination and access | Availability | Comments, links, ... |
| Press release | x | ZTI-2022-2-5 Innovation in Enterprises, 2018 – 2020 | Državni zavod za statistiku (dzs.hr) |
| Access to public free of charge | x | |
| Access to public restricted (membership/password/part of data provided, etc) |
10.2. Dissemination format - Publications
- Online database (containing all/most results) : not available
- Analytical publication (referring to all/most results) : ZTI-2022-2-5 Innovation in Enterprises, 2018 – 2020 | Državni zavod za statistiku (dzs.hr)
- Analytical publication (referring to specific results, e.g. only for one sector or one specific aspect) : not available
10.3. Dissemination format - online database
Not available
10.3.1. Data tables - consultations
Not requested.
10.4. Dissemination format - microdata access
Micro-data are not disseminated.
10.4.1. Dissemination of microdata
| Mean of dissemination | Availability of microdata | Comments, links, ... |
| Eurostat SAFE centre | x | |
| National SAFE centre | x | anonymisation |
| Eurostat: partially anonymised data (SUF) | ||
| National : partially anonymised data |
10.5. Dissemination format - other
No other means of dissemination.
10.5.1. Metadata - consultations
Not requested.
10.6. Documentation on methodology
Methodological documents are published in First Release in electronic version available on the website of the Croatian Bureau of Statistics.
The meta-information available together with the data published in official First Release – part “Notes on methodology” are information about Data sources, Coverage and comparability and short interpretation and analysis of results.
10.6.1. Metadata completeness - rate
Not requested.
10.7. Quality management - documentation
On the website of CBS there is a Quality chapter with QRs for different areas. One of them is CIS with QRs for CIS2014, CIS2016 and CIS2018
ZADNJI DATUM AŽURIRANJA: (gov.hr) Quality Report for Statistical Survey Community Innovation Survey, 2016 – 2018
ZADNJI DATUM AŽURIRANJA: (gov.hr) Quality Report for Statistical Survey Community Innovation Survey, 2014 – 2016
ZADNJI DATUM AŽURIRANJA: (gov.hr) Quality Report for Statistical Survey Community Innovation Survey, 2012 – 2014
11.1. Quality assurance
The survey is conducted by Croatian Bureau of Statistics which means that all data collected are confidential and will be used strictly for statistical purposes and will not be published as individual.
National questionnaire was prepared based on the harmonized survey questionnaire and other relevant documents. National CIS questionnaire includes all obligatory and optional questions, instruction and skips. It is basically translation of the harmonized survey questionnaire and it was changed minimally.
After receiving a filled-in questionnaire, it was checked for logical and mathematical inconsistencies and missing data. In case of some illogical answers or missing data, the enterprises were contacted by telephone or e-mail.
Since the data collection mode was electronic (on-line) questionnaire, the data were automatically transferred into database. Web questionnaire includes some routines, skips and checks, but not too many. Some of the data collected by enterprises were crosschecked with data from existing administrative sources (data on turnover, size-class, age of enterprise).
11.2. Quality management - assessment
The majority of enterprises (over 80%) had no difficulty filling out the questionnaire . Those enterprises that had difficulties, mostly stated that the questions are too broad, incomprehensible, that there are a lot of similar questions, that filling the questionnaire takes a lot of time, especially in larger companies, because the necessary data needs to be collected from several departments in the company.
As in previous waves, some enterprises had problems understanding concepts while answering couple of questions. That's why we had a lot of telephone corrections, additions and corrections, especially for the 3rd chapter. There is also remark regarding the lenght of the questionnaire and again some enterprises have stated that the questionnaire requires more time to complete and a larger number of people involved in completing it from different departments. We also had a remark that the questionnaire covers the period from 2018 to 2020 which is a bit too long a period to remember. Several enterprises consider financial information a trade secret. Some variables do not correspond to those in the annual financial report, so it is very difficult to conclude what exactly they refer to.
For some enterprises it was complicate to estimate the percent of total turnover in 2020 for products introduced during the three years 2018 to 2020 that were not previously offered by any of enterprise’s competitors from identical or very similar to products already offered by enterprise’s competitors. Some enterprises also had problems with questions related to environmental benefits – they had problems recognizing the environmental benefit despite the innovation. A lot of effort has been done to help the enterprises to become aware of the ecological benefits stated.
Overall quality of the CIS methodology is satisfactory. For question regarding enterprise being part of group of enterprises, we took data from the Statistical Business Register (SBR).
As in the previous wave, one postal reminder was sent, and the other reminders were conducted by telephone or e-mail which resulted in response rate of 75.4%.
Relevance is the degree to which statistics meet current and potential users’ needs. It includes the production of all needed statistics and the extent to which concepts used (definitions, classifications etc.) reflect user needs. The aim is to describe the extent to which the statistics are useful to, and used by, the broadest array of users. For this purpose, statisticians need to compile information, firstly about their users and their needs.
The CIS is based on a common questionnaire and a common survey methodology in order to achieve comparable, harmonised and high quality results for EU Member States, EFTA countries, Candidates and Associated countries.
12.1. Relevance - User Needs
There are several users at national and international level with different needs with respect to the statistiacal data.
At the international level main user is the European Commissin with their DG's - DG GROW, DG RTD, Eurostat, as well as Innovation Union Scoreboard and Regional Innovation Scoreboard . They use data for systematic and user-oriented presentation of internationally comparable indicators on the Community Innovation Survey (for all Member States of the European Union) furthermore to provide a comparative assessment of the innovation performance of EU Member States (Innovation Union Scoreboard) and assessing the innovation performance of European regions on a limited number of indicators (Regional Innovation Scoreboard).
The users at national level will be listed under 12.1.1.
12.1.1. Needs at national level
| User group | Short description of user group | Main needs for CIS data of the user group Users’ needs |
| 1. Institutions - National level | Croatian Bureau of Statistics | Data used for national publications on innovation |
| 1. Institutions - National level | Ministry of economy and sustainable development | Data used for internal analysis, planning and creating policies and strategies as well monitoring |
| 1. Institutions - National level | Ministry of Science and Education | Data used for analysis and international comparisons |
| 2. Social actors | Croatian Agency for SMEs, Innovations and Investments (HAMAG-BICRO | Data used for policy making |
| 3. Media | National media | Data used for analysis or comments |
| 4. Researchers and students | Independent researchers | Data used for scientific-research projects |
| 4.Researchers and students | Scientific-research institutes Institute of Economics |
Data used for national and international scientific-research projects with the aim to analyse innovativeness, competitiveness of Croatian enterprises and for comparative analysis |
| 5. Enterprises or businesses | Enterprises or businesses | Data used for their own analysis and use |
12.2. Relevance - User Satisfaction
A targeted measurement of user satisfaction specifically with the data from the survey on innovation activities of enterprises is not conducted.
12.3. Completeness
The survey was conducted by the Croatian Bureau of Statistics and was completely in accordance with the survey entitled "Community Innovation Survey", which is conducted in the European Union every two years. The survey covers all mandatory and optional variables laid down in Commission Regulation (EC) No 995/2012 of 26 October 2012 implementing Decision No 1608/2003/EC of the European Parliament and of the Council concerning the production and development of Community statistics on science and technology. All mandatory and voluntary variables were collected. All statistics produced on innovation are available.
12.3.1. Data completeness - rate
Not requested.
13.1. Accuracy - overall
Accuracy in the statistical sense denotes the closeness of computations or estimates to the exact or true values. Statistics are not equal with the true values because of variability (the statistics change from implementation to implementation of the survey due to random effects) and bias (the average of the possible values of the statistics from implementation to implementation is not equal to the true value due to systematic effects).
13.2. Sampling error
That part of the difference between a population value and an estimate thereof, derived from a random sample, which is due to the fact that only a subset of the population is enumerated.
13.2.1. Sampling error - indicators
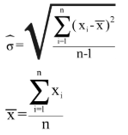
The main indicator used to measure sampling errors for CIS data is the coefficient of variation (CV).
Coefficient of Variation= (Square root of the estimate of the sampling variance) / (Estimated value)
Formula:
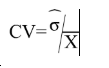
where
13.2.1.1. Coefficient of variations for key variables
Coefficient of variation (%) for key variables by NACE categories and for enterprises with 10 and more employees
| NACE |
Size class |
(1) |
(2) |
(3) |
| Core NACE (B-C-D-E-46-H-J-K-71-72-73) |
Total |
|
|
|
| Core industry (B_C_D_E - excluding construction) |
Total |
|
|
|
| Core Services (46-H-J-K-71-72-73) |
Total |
|
|
|
[1] = Coefficient of variation for the percentage of innovative enterprises (INN) in the total population of enterprises (ENT20)
[2] = Coefficient of variation for the turnover of product innovative enterprises with new or improved products (TUR_PRD_NEW_MKT), as a percentage of total turnover of product innovative enterprises [TUR20,INNO_PRD].
[3] = Coefficient of variation for percentage of product and/or process innovative enterprises (incl. enterprises with abandoned and or on-going activities) involved in any innovation co-operation arrangement [COOP_ALL,INN], as a percentage of innovative enterprises (INN).
13.2.1.2. Variance estimation method
Taylor linearization was used for variance estimation by applying SAS procedure Surveymeans for calculating variance estimation. Sample design and weighting has been taken into account because it is required by mentioned SAS procedure.
13.3. Non-sampling error
Non-sampling errors occur in all phases of a survey. They add to the sampling errors (if present) and contribute to decreasing overall accuracy. It is important to assess their relative weight in the total error and devote appropriate resources for their control and assessment.
13.3.1. Coverage error
Coverage errors (or frame errors) are due to divergences between the target population and the frame population. The frame population is the set of target population members that has a chance to be selected into the survey sample. It is a listing of all items in the population from which the sample is drawn that contains contact details as well as sufficient information to perform stratification and sampling.
13.3.1.1. Over-coverage - rate
Not requested.
13.3.1.2. Common units - proportion
Not requested.
13.3.1.3. Under covered groups of the target population
Companies that were liquidated during the period are deleted from the sample and target population, unless it was decided that their liquidation was so late in the survey period that they should be included in the target population.
13.3.1.4. Coverage errors in coefficient variation
Effects of coverage errors are incorporated in the variance estimation, in a way that in non-response adjustment procedure small, medium and large enterprises are treated in different manner. Non-response weights for small enterprises are calculated as the ratio of the number of selected units and the number of units that participated in the survey, while the non-response weights for medium and large enterprises are calculated as the ratio of the eligible units and the number of units that participated in the survey. The reason for this is that we assume that small enterprises that no longer exist are easily replaced with new small enterpise, while medium and large enterprises could not be easily replaced. In that way we imputed the response for small enterprises, altough they no longer exist.
13.3.2. Measurement error
Measurement errors occur during data collection and generate bias by recording values different than the true ones. The survey questionnaire used for data collection may have led to the recording of wrong values, or there may be respondent or interviewer bias.
13.3.2.1. Measures for reducing measurement errors
Measures which were taken to reduce measurements errors started with designing the national questionnaire. We have put a lot of efforts to translate, as good as it was possible, some terms and concepts to Croatian (e.g. pooling, cross-licensing, co-creation, crowd-sourcing, open business-to-business platforms, open-source software, cross-functional work groups) and we wrote clear methodological guidelines. The on-line questionnaire was tested by CBS employees and we have covered most of fore coming situation and to be ready to avoid possible errors. As well, we have tested all skips and controls in order to ensure better quality of collected data. Due to unexpected circumstances that influenced all activities of the project from (changes of project leader, new member of project team, new internal organizational structure of CBS and the relocation of the project team) before start of data collection, we organized a quick training to our new member of the project team and agreed common approach to all issues that could be confusing, questionable or unclear to reporting units.
13.3.3. Non response error
Non response occurs when a survey fails to collect data on all survey variables from all the population units designated for data collection in a sample or complete enumeration.
There are two types of non-response:
1) Unit non-response, which occurs when no data (or so little as to be unusable) are collected about a population unit designated for data collection.
a) Un-weighted unit non-response rate (%) = 100*(Number of units with no response or not usable response) / (Total number of in-scope (eligible) units in the sample)
b) Weighted unit non-response rate (%) = 100*(Number of weighted units with no response or not usable response) / (Total number of in-scope (eligible) units in the sample)
2) Item non-response, which occurs when only data on some, but not all survey data items are collected about a population unit designated for data collection.
a) Un-weighted item non-response rate (%) = 100*(Number of units with no response at all for the item) / (Total number of eligible, for the item, units in the sample i.e. filters have to be taken into account)
13.3.3.1. Unit non-response - rate
See below.
13.3.3.1.1. Un-weighted and weighted unit non-response rate by NACE categories and for enterprises with 10 or more employed persons
Un-weighted and weighted unit non-response rate by NACE categories and for enterprises with 10 or more employees
| NACE | Number of eligible units with no response | Total number of eligible units in the sample | Un-weighted unit non-response rate (%) | Weighted unit non-response rate (%) |
| Core NACE (B-C-D-E-46-H-J-K-71-72-73) | 763 | 3558 | 21.44 | 25.61 |
| Core industry (B_C_D_E - excluding construction) | 501 | 2183 | 22.95 | 26.71 |
| Core Services (46-H-J-K-71-72-73) | 262 | 1375 | 19.05 | 24.39 |
The number of eligible units is the number of sample units, which indeed belong to the target population.
13.3.3.1.2. Maximum number of recalls/reminders before coding
Not available.
13.3.3.2. Item non-response - rate
See below.
13.3.3.2.1. Item non-response rate for Turnover (in Core NACE: B-C-D-E-46-H-J-K-71-72-73 enterprises with 10 or more employed persons)
Item non-response rate for Turnover (in Core NACE: B-C-D-E-46-H-J-K-71-72-73 enterprises with 10 or more employees).
| Item non-response rate (un-weighted) | Imputation | If imputed, describe method used, mentioning which auxiliary information or stratification is used | |
| Turnover | 0 |
There were no missing values i.e. item non-response. The enterprises that provided answers were contacted as many times as needed to get answers to all questions, either by email or by phone.
13.3.3.2.2. Item non response rate for new questions
Item non-response rate for new questions in CIS t (in Core NACE: B-C-D-E-46-H-J-K-71-72-73 enterprises with 10 or more employees)
| NEW QUESTIONS IN CIS 2020 | Inclusion in national questionnaire | Item non response rate (un-weighted) | Comments |
| 2.2 Market conditions faced by enterprise | 23.27 | ||
| 2.8 Factors related to climate change | 23.27 | ||
| 3.16 Innovations with environmental benefits | 23.27 | ||
| 3.17 Factors driving environmental innovations | 72.88 |
13.3.4. Processing error
Not available.
13.3.5. Model assumption error
Not requested.
Timeliness and punctuality refer to time and dates, but in a different manner.
14.1. Timeliness
The timeliness of statistics reflects the length of time between data availability and the event or phenomenon they describe.
14.1.1. Time lag - first result
Timeliness of national data – date of first release of national level :
30/09/2020
14.1.2. Time lag - final result
Not requested.
14.2. Punctuality
Punctuality refers to the time lag between the release date of data and the target date on which they were scheduled for release as announced officially.
14.2.1. Punctuality - delivery and publication
Date of transmission of complete and validated data to Eurostat (Number of days between that data and 30 June 2022) :
Comparability aims at measuring the impact of differences in applied statistical concepts and definitions on the comparison of statistics between geographical areas, non-geographical domains, or over time.
The coherence of statistical outputs refers to the degree to which the statistical processes by which they were generated used the same concepts (classifications, definitions, and target populations) and harmonised methods. Coherent statistical outputs have the potential to be validly combined and used jointly.
15.1. Comparability - geographical
We did not have any problems of comparability between 4 regions of the country.
15.1.1. Asymmetry for mirror flow statistics - coefficient
Not requested.
15.1.2. National questionnaire – compliance with Eurostat model questionnaire
Methodological deviations from the CIS Harmonised Data Collection (HDC)
| Questions not included in national questionnaire compared to HDC | Comment |
| All mandatory and voluntary variables were collected. | |
| Changes in the filtering compared to HDC | Comment |
15.1.3. National questionnaire – additional questions
Methodological deviations from the CIS Harmonised Data Collection (HDC)
| Additional questions in national questionnaire (not included in HDC) | Comment |
15.2. Comparability - over time
Due to important methodological changes driven by Oslo Manual 2018, CIS 2018 and CIS 2020 cannot be directly compared with previous CIS waves.
15.2.1. Length of comparable time series
Not requested.
15.3. Coherence - cross domain
There was no comparison.
15.3.1. Coherence - sub annual and annual statistics
Not requested.
15.3.2. Coherence - National Accounts
Not requested.
15.3.3. Coherence – Structural Business Statistics (SBS)
There was no comparison with SBS.
15.4. Coherence - internal
Not requested.
17.1. Data revision - policy
Not requested.
17.2. Data revision - practice
Not requested.
17.2.1. Data revision - average size
Not requested.
18.1. Source data
See below:
18.1.1. Sampling frame (or census frame)
The official, up-to-date, statistical business register of Croatian Bureau of Statistics was used as a frame (situation at the end of 2020). The frame consisted of 11 477 units with 10 or more employees and with main activity in core target population and additional target population (NACE 41-43, 55-56, 68) according to NACE Rev. 2.
There are 7 628 units with 10 or more employees and with main activity in core target population in the sampling frame.
18.1.2. Sampling design
The target population was broken down into similar structured subgroups or strata, so, stratification is used. Appropriate stratification will normally give results with smaller sampling errors than a non-stratified sample of the same size and will make it possible to ensure that there are enough units in the respective domains to produce results of acceptable quality.
The stratification variables that are used for the CIS 2020, i.e. the characteristics used to break down the sample into similarly structured groups were:
- Regional sampling according to NUTS2 regions
- Enterprise size according to the number of employees
- The economic activities (in accordance with NACE)
In that way, 164 strata were formed.
The selection of the sample was based on random sampling techniques, with known selection probabilities, applied to strata.
So, the sampling frame was divided in 164 strata according to the 2 digit NACE and 3 size classes of number of employees. All units with 50 or more employees were selected with certainty. The sample for units with 10 – 49 employees was stratified simple random sample with known selection probabilities for all units. The number of selected units in the stratum with enterprises with 10 - 49 employees was calculated in proportion to the number of units in the stratum in population. After that, we decreased calculated number of units in the sample for activities such as construction, accommodation and food service activities, manufacture of bread and real estate activities, due to too big proportion such units in the whole sample and as we wanted to increase number of sampling units from other strata. Optimal allocation was not used because of unreliable estimates of variance of strata from CIS 2010. Estimates of variance were unreliable as there was small number of units in some strata.
18.1.3. Target population and sample size
| Sample/census indicator | Number of enterprises |
| Target population | 11477 (7628) |
| Sample | 4500 (3391) |
| In case of combination sample/census: | |
| Sampled units | |
| Enumerated units/census | |
| Overall sample rate (overall sample/target population) | 39.21% (44.45%) |
18.1.4. Data source for pre-filled variables
Variables and indicators filled or prefilled from other sources.
| Variables/Indicators | Source | Reference year |
| ID | Adress book | 2020 |
| NUTS | Statistical Business Register (SBR) | 2020 |
| NACE | SBR | 2020 |
| NSI_ID | SBR | 2020 |
| EMP18 | SBR | 2020 |
| EMP20 | SBR | 2020 |
| TUR18 | SBR | 2020 |
| TUR20 | SBR | 2020 |
| ENTE_TIME | SBR | 2020 |
| ENTE_Y_GE2016 | SBR | 2020 |
| ENTE_Y_2014T2015 | SBR | 2020 |
| ENTE:Y_2010T2013 | SBR | 2020 |
| ENTE_Y_LE2009 | SBR | 2020 |
| ENTGRP_HD_NAT | SBR | 2020 |
| ENTGRP_ENT_EG_NAT | SBR | 2020 |
18.1.5. Data source and variables used for derivation and weighting
| Item | Response |
| Data source used for deriving population totals | The official, up-to-date, statistical business register of CBS was used for deriving population totals and other needed variables. |
| Variables used for weighting | Number of selected units from strata in sample, total number of units in strata from population (for design weight), number of existing selected units in sample and number of existing units that have responded (for response weights). |
18.2. Frequency of data collection
According to the Commission Regulation (UE) 995/2012, the innovation statistics shall be provided to Eurostat every two years in each even year t+18.
18.3. Data collection
Data collection method used was electronic (on-line) questionnaire which was computer-assisted in a minimum way. On-line version matched harmonised questionnaire visually and methodologically.
18.3.1. Survey participation
The survey is mandatory.
18.3.2. Survey type
Survey type was combination of sample survey and census data.
18.3.3. Combination of sample survey and census data
Survey type was combination of sample survey and census data.
We have sample of small enterprise (10-49 employees) and enterprises with 50 - 249 employees and 250 or more employees are covered by complete enumeration.
The sample for units with 10 – 49 employees was stratified simple random sample with known selection probabilities for all units.
Enterprises with 50 - 249 employees and 250 or more employees are covered by complete enumeration.
18.3.4. Census criteria
Enterprises with 50 - 249 employees and 250 or more employees are covered by complete enumeration.
18.3.5. Data collection method
Data collection method
| Survey method | Yes/No | Comment |
|---|---|---|
| Face-to-face interview | No | |
| Telephone interview | No | |
| Postal questionnaire | No | |
| Electronic questionnaire (format Word or PDF to send back by email) | No | |
| Web survey (online survey available on the platform via URL) | Yes | |
| Other |
18.4. Data validation
Not requested.
18.5. Data compilation
Operations performed on data to derive new information according to a given set of rules.
18.5.1. Imputation - rate
Imputation is the method of creating plausible (but artificial) substitute values for all those missing.
Definition of imputation rate:
Imputation rate (for the variable x) (%) = 100*(Number of replaced values) / (Total number of values for a given variable)
Definition of weighted imputation rate:
Weighted imputation rate= 100*(Number of total weighted replaced values) / (Total number of weighted values for a given variable)
18.5.1.1. Imputation rate for metric variables
Imputation rate for metric variables by NACE categories and for enterprises with 10 or more employees: there was no 'item no response' so no imputation was performed
| NACE | Size class | Total Turnover (1) | Turnover from products new to the market (2) | R&D expenditure in-house (3) | |||
| Unweighted | Weighted | Unweighted | Weighted | Unweighted | Weighted | ||
| Core NACE (B-C-D-E-46-H-J-K-71-72-73) | Total | ||||||
| Core industry (B_C_D_E - excluding construction) | Total | ||||||
| Core Services (46-H-J-K-71-72-73) | Total | ||||||
(1) = Total turnover in the last year of the reference period (t) (TUR)
(2) = Share of the turnover in the last year of the reference period (t) due to new or improved product new to the market in the total turnover for product innovative enterprises TUR_PRD_NEW_MKT/TUR(INNO_PRD)
(3) = R&D expenditure performed in-house (EXP_INNO_RND_IH)
18.5.2. Weights calculation
Weights calculation method for sample surveys
| Method | Selected applied method | Comments |
| Inverse sampling fraction | x | |
| Non-respondent adjustments | x | |
| Other | x | Ratio estimator |
The survey results are weighted in order to adjust for the sampling design and for unit non-response to produce valid results for the target population.
The basic method for adjusting for different probabilities of selection used in the sampling process is to use the inverse of the sampling fraction, using the number of enterprises. This was based on the figure Nh/nh where Nh is the total number of enterprises in stratum h of the population and nh is the number of enterprises in the realised sample in stratum h of the population, assuming that each unit in the stratum had the same inclusion probability. This automatically adjusts the sample weights of the respondents to compensate for unit non-response. So, we have used the basic method for adjusting for the sampling design and for unit non-response. We calculated weights only by using module SAS-base.
At the end we have also calculated ratio estimator and its effect has been also incorporated in final weights. We have first divided population in 2 groups (2 regions and 2 groups according to number of employees - small enterprises with less than 50 employees and other group with 50 or more employees). Then, number of employees was calculated for each group and it was used in calculation. After that, we have included also its effect in final weights and exact number of employees which was obtained in the frame.
18.6. Adjustment
We did not use standard calibration methods and software. We have only calibrated data according to number of employees from sampling frame (business register). We have tried to calculate also ratio weights, but population was too overestimated with it. Reason for that is that we have used weighted number of employees according to design weights, but after that, we have used final weight (product of design weights and response weights) and in that way we have achieved number of employees as it is in the frame. In some way, we can say now that population is calibrated according to number of employees in each.
18.6.1. Seasonal adjustment
Not requested.
As already mention the survey covers all mandatory and optional variables and follows all Eurostat methodological recommendations (skips, logical and mathematical control etc. built into the on-line questionnaire). Beside target population which covers active enterprises ‒ legal entities and natural persons employing 10 or more persons that are, according to the main activity, classified in sections B, C, D, E, F, G, H, I, J, K, L, M of NACE Rev. 2 we added some more service activities in the survey because of their significance in the Croatian economy (we added Construction (41 – 43), Accommodation and food service activities (55 – 56) and Real estate activities (68)) and we also surveyed NACE 59 and 60.
As recommended we extracted the enterprise identification from the Statistical Business Register as well some variables collected as part of Section 4 – average number of employees; total turnover; in which year was your enterprise established; in 2020, was your enterprise part of - a) an enterprise group with the head office located in HR and if “yes” are all of the enterprises of the group located in HR, b) an enterprise group with the head office located abroad and if “yes” inserted country code according to ISO standard for country in which head office is located.
We have experienced that reporting units do not read instructions whether they are written with or after the question.
The Community Innovation Survey (CIS) is a survey about innovation activities in enterprises. The survey is designed to collect the information on types of innovation, processes of development of innovation like cooperation patterns, financing and expenditure, objectives of innovation activities or barriers for initiating or implementing innovation.
The CIS provides statistics by type of innovators, economic activity and size class of enterprises. The survey is currently carried out every two years across the EU Member States, EFTA countries and EU candidate countries.
In order to ensure comparability across countries, Eurostat together with the countries develops a Harmonised Data Collection (HDC) questionnaire and drafts the methodological recommendations for implementation of each survey round.
CIS 2020 is a second in a row to implement concepts and methodology of the Oslo Manual 4th Edition revised in 2018. The changes in the CIS driven by the revision of the manual and their impact on collected indicators are described in the Statistics Explained article: Community Innovation Survey – new features.
The legal framework for CIS since 2012 is the Commission Regulation No 995/2012 that establishes the quality conditions for the data collection and transmission and identifies the obligatory cross-coverage of economic sectors, size class of enterprises and innovation indicators. The target population are enterprises with at least 10 employees classified in the core NACE economic sectors (see 3.3). Further activities may be covered on a voluntary basis in national datasets. Most statistics are based on the 3-year reference period (t, t-1, t-2), but some use only one calendar year (t or t-2). Please refer to the Annex section of the European metadata (ESMS) for details of the time coverage of collected indicators.
30 May 2024
The description of concepts, definitions and main statistical variables is available in CIS 2020 European metadata file (ESMS) Results of the community innovation survey 2020 (CIS2020) (inn_cis12) in Eurostat database.
In accordance with Commission Regulation 995/2012 on innovation statistics, it is required that Member States set up and maintain a register of enterprises, as well as associated legal units and local units.
The basic units of statistical characteristics (observations) to which data refer are legal units - legal entities and natural persons. In national context, until recently it was considered that one legal unit in the statistical business register equals to one enterprise. A legal unit has a complete set of records and autonomy in decision-making. The ongoing process of enterprise profiling will enable us to use the statistical unit enterprise in the future in order to be aligned with the EBS Regulation (and if decided so by the WG STI). For reasons of simplifying further text, we shall use the term enterprise.
Core target population are all enterprises in CORE NACE activities (see 3.3.1) with 10 or more employees.
The survey was conducted according to NUTS 2021 - 4 regions: Panonska Hrvatska, Jadranska Hrvatska, Grad Zagreb and Sjeverna Hrvatska.
For CIS 2020, the time covered by the survey is the 3-year period from the beginning of 2018 to the end of 2020.
Some questions and indicators refer to one year — 2020.
The list of indicators covering the 3-year period and referring to one year according to the HDC is available in the Annex section of the European metadata (ESMS).
Accuracy in the statistical sense denotes the closeness of computations or estimates to the exact or true values. Statistics are not equal with the true values because of variability (the statistics change from implementation to implementation of the survey due to random effects) and bias (the average of the possible values of the statistics from implementation to implementation is not equal to the true value due to systematic effects).
CIS indicators are available according to 3 units of measure:
NR: Number for number of enterprises and number of persons employed.
THS_EUR: Thousands of euros. All financial variables are provided in thousands of euros, i.e. Turnover or Innovation expenditure.
PC: Percentage. The percentage is the ratio between the selected combinations of indicators.
Operations performed on data to derive new information according to a given set of rules.
See below:
CIS is conducted and disseminated at two-year interval.
The timeliness of statistics reflects the length of time between data availability and the event or phenomenon they describe.
We did not have any problems of comparability between 4 regions of the country.
Due to important methodological changes driven by Oslo Manual 2018, CIS 2018 and CIS 2020 cannot be directly compared with previous CIS waves.
