


1.1. Contact organisation
Statistics Estonia
1.2. Contact organisation unit
Economic and Environmental Statistics Department
1.3. Contact name
Confidential because of GDPR
1.4. Contact person function
Confidential because of GDPR
1.5. Contact mail address
Tatari 51, 10134 Tallinn, Estonia
1.6. Contact email address
Confidential because of GDPR
1.7. Contact phone number
Confidential because of GDPR
1.8. Contact fax number
Confidential because of GDPR
2.1. Metadata last certified
28 May 2024
2.2. Metadata last posted
28 May 2024
2.3. Metadata last update
28 May 2024
3.1. Data description
The Community Innovation Survey (CIS) is a survey about innovation activities in enterprises. The survey is designed to collect the information on types of innovation, processes of development of innovation like cooperation patterns, financing and expenditure, objectives of innovation activities or barriers for initiating or implementing innovation.
The CIS provides statistics by type of innovators, economic activity and size class of enterprises. The survey is currently carried out every two years across the EU Member States, EFTA countries and EU candidate countries.
In order to ensure comparability across countries, Eurostat together with the countries develops a Harmonised Data Collection (HDC) questionnaire and drafts the methodological recommendations for implementation of each survey round.
CIS 2020 is a second in a row to implement concepts and methodology of the Oslo Manual 4th Edition revised in 2018. The changes in the CIS driven by the revision of the manual and their impact on collected indicators are described in the Statistics Explained article: Community Innovation Survey – new features.
The legal framework for CIS since 2012 is the Commission Regulation No 995/2012 that establishes the quality conditions for the data collection and transmissionand identifies the obligatory cross-coverage of economic sectors, size class of enterprises and innovation indicators. The target population are enterprises with at least 10 employees classified in the core NACE economic sectors (see 3.3). Further activities may be covered on a voluntary basis in national datasets. Most statistics are based on the 3-year reference period (t, t-1, t-2), but some use only one calendar year (t or t-2). Please refer to the Annex section of the European metadata (ESMS) for details of the time coverage of collected indicators.
3.2. Classification system
Indicators related to the enterprises are classified by country, economic activity (NACE Rev. 2), size class of enterprises and type of innovation.
The main typology of classification of enterprises in reference to innovation is the distinction between innovation-active enterprises (INN) and not innovation-active enterprises (NINN).
The enterprise is considered as innovative (INN) if during the reference period it successfully introduced a a) product or a) business process innovation, c) completed but not yet implemented the innovation, d) had ongoing innovation activities, e) abandoned innovation activities or was f) engaged in in-house R&D or R&D contracted out. Non-innovative (NINN) enterprises had no innovation activity mentioned above whatsoever during the reference period.
3.3. Coverage - sector
CIS covers main economic sectors according to NACE Rev.2 broken down by size class of enterprises and type of innovation activity.
3.3.1. Main economic sectors covered - NACE Rev.2
In accordance with Commission Regulation 995/2012 on innovation statistics, the following industries and services are included in the core target population. Results are made available with these following breakdowns :
All NACE – Core NACE (NACE Rev. 2 sections & divisions B-C-D-E-46-H-J-K-71-72-73 )
CORE INDUSTRY (excluding construction) (NACE Rev. 2 SECTIONS B_C_D_E)
10-12: Manufacture of food products, beverages and tobacco
13-15: Manufacture of textiles, wearing apparel, leather and related products
16-18: Manufacture of wood, paper, printing and reproduction
20: Manufacture of chemicals and chemical products
21: Manufacture of basic pharmaceutical products and pharmaceutical preparations
19-22: Manufacture of petroleum, chemical, pharmaceutical, rubber and plastic products
23: Manufacture of other non-metallic mineral products
24: Manufacture of basic metals
25: Manufacture of fabricated metal products, except machinery and equipment
26: Manufacture of computer, electronic and optical products
25-30: Manufacture of fabricated metal products (except machinery and equipment), computer, electronic and optical products, electrical equipment, motor vehicles and other transport equipment
31-33: Manufacture of furniture; jewellery, musical instruments, toys; repair and installation of machinery and equipment
D: ELECTRICITY, GAS, STEAM AND AIR CONDITIONING SUPPLY
E: WATER SUPPLY; SEWERAGE, WASTE MANAGEMENT AND REMEDIATION ACTIVITIES
36: Water collection, treatment and supply
37-39: Sewerage, waste management, remediation activities
CORE SERVICES (NACE Rev. 2 sections & divisions 46-H-J-K-71-72-73)(NACE code in the tables = G46-M73_INN)
46: Wholesale trade, except of motor vehicles and motorcycles
H: TRANSPORTATION AND STORAGE
49-51: Land transport and transport via pipelines, water transport and air transport
52-53: Warehousing and support activities for transportation and postal and courier activities
J: INFORMATION AND COMMUNICATION
58: Publishing activities
61: Telecommunications
62: Computer programming, consultancy and related activities
63: Information service activities
K: FINANCIAL AND INSURANCE ACTIVITIES
64: Financial service activities, except insurance and pension funding
65: Insurance, reinsurance and pension funding, except compulsory social security
66: Activities auxiliary to financial services and insurance activities
M: PROFESSIONAL, SCIENTIFIC AND TECHNICAL ACTIVITIES
71: Architectural and engineering activities; technical testing and analysis
72: Scientific research and development
73: Advertising and market research
71-73: Architectural and engineering activities; technical testing and analysis; Scientific research and development; Advertising and market research
3.3.1.1. Main economic sectors covered - NACE Rev.2 - national particularities
All core activities were covered.
No non-core activities were covered.
3.3.2. Sector coverage - size class
In accordance with Commission Regulation 995/2012 on innovation statistics, the following size classes of enterprises according to number of employees are included in the core target population of the CIS:
- 10 - 49 employees
- 50 - 249 employees
- 250 or more employees
3.3.2.1. Sector coverage - size class - national particularities
In sampling the following size classes of enterprises according to number person employed are included
- 10–49
- 50–99
- 100–249
- 250+
The same size classes are used for nationally published results.
3.4. Statistical concepts and definitions
The description of concepts, definitions and main statistical variables is available in CIS 2020 European metadata file (ESMS) Results of the community innovation survey 2020 (CIS2020) (inn_cis12) in Eurostat database.
3.5. Statistical unit
Statistical unit is enterprise
3.6. Statistical population
Core target population are all enterprises in CORE NACE activities (see 3.3.1) with 10 or more employees.
3.7. Reference area
All territory of Estonia is covered.
Estonia is at NUTS 2 level.
3.8. Coverage - Time
Several rounds of Community Innovation Survey have been conducted so far at two-year interval since end of 90’s.
3.8.1. Participation in the CIS waves
| CIS wave | Reference period | Participation | Comment (deviation from reference period) |
| CIS2 | 1994-1996 | no | |
| CIS3 | 1998-2000 | yes | |
| CIS light | 2002-2003* | no | |
| CIS4 | 2002-2004 | yes | |
| CIS2006 | 2004-2006 | yes | |
| CIS2008 | 2006-2008 | yes | |
| CIS2010 | 2008-2010 | yes | |
| CIS2012 | 2010-2012 | yes | |
| CIS2014 | 2012-2014 | yes | |
| CIS2016 | 2014-2016 | yes | |
| CIS2018 | 2016-2018 | yes | |
| CIS2020 | 2018-2020 | yes |
*two reference periods can be distinguished for CIS light: 2000-2002 and 2001-2003
3.9. Base period
Not relevant.
CIS indicators are available according to 3 units of measure:
NR: Number for number of enterprises and number of persons employed.
THS_EUR: Thousands of euros. All financial variables are provided in thousands of euros, i.e. Turnover or Innovation expenditure.
PC: Percentage. The percentage is the ratio between the selected combinations of indicators.
For CIS 2020, the time covered by the survey is the 3-year period from the beginning of 2018 to the end of 2020.
Some questions and indicators refer to one year — 2020.
The list of indicators covering the 3-year period and referring to one year according to the HDC is available in the Annex section of the European metadata (ESMS).
6.1. Institutional Mandate - legal acts and other agreements
CIS surveys are based on the Commission Regulation No 995/2012, implementing Decision No 1608/2003/EC of the European Parliament and of the Council on the production and development of Community statistics on science and technology.
This Regulation establishes innovation statistics on a statutory basis and makes the delivery of certain variables compulsory e.g. innovation activities, cooperation, development, expenditures and turnover (see the Regulation). Each survey wave may additionally include further variables.
In addition, the Regulation defines the obligatory cross-coverage of economic sectors and size class of enterprises.
6.1.1. National legislation
DIRECTLY APPLICABLE LEGAL ACTS
Decision No 1608/2003/EC of the European Parliament and of the Council of 22 July 2003 concerning the production and development of Community statistics on science and technology (Text with EEA relevance)
Commission Regulation (EC) No 1450/2004 of 13 August 2004 implementing Decision No 1608/2003/EC of the European Parliament and of the Council concerning the production and development of Community statistics on innovation
Commission Implementing Regulation (EU) No 995/2012 of 26 October 2012 laying down detailed rules for the implementation of Decision No 1608/2003/EC of the European Parliament and of the Council concerning the production and development of Community statistics on science and technology
6.2. Institutional Mandate - data sharing
Not requested.
CIS data are transmitted to Eurostat via EDAMIS using the secured transmission system.
7.1. Confidentiality - policy
The dissemination of data collected for the purpose of producing official statistics is guided by the requirements provided for in § 32, § 34, § 35, § 38 of the Official Statistics Act.
The treatment of confidential data is regulated by the Procedure for Protection of Data Collected and Processed by Statistics Estonia: http://www.stat.ee/66485.
7.2. Confidentiality - data treatment
Primary cell suppression were used for financial indicators if there were less than 3 enterprises in the respective NACE activity and size group or if the share of one enterprise was more than 90%.
In addition to primary cell suppression, secondary cell suppression was applied to protect primary cell suppressionl values from calculation.
8.1. Release calendar
Notifications about the dissemination of statistics are published in the release calendar, which is available on the website. Every year on 1 October, the release times of the statistical database, news releases, main indicators by IMF SDDS and publications for the following year are announced in the release calendar (in the case of publications – the release month).
8.2. Release calendar access
.
Annexes:
Release calendar
8.3. Release policy - user access
All users have been granted equal access to official statistics: dissemination dates of official statistics are announced in advance and no user category (incl. Eurostat, state authorities and mass media) is provided access to official statistics before other users. Official statistics are first published in the statistical database. If there is also a news release, it is published simultaneously with data in the statistical database. Official statistics are available on the website at 8:00 a.m. on the date announced in the release calendar.
CIS is conducted and disseminated at two-year interval in pair years.
Accessibility and clarity refer to the simplicity and ease for users to access statistics using simple and user-friendly procedure, obtaining them in an expected form and within an acceptable time period, with the appropriate user information and assistance: a global context which finally enables them to make optimum use of the statistics.
10.1. Dissemination format - News release
See below.
10.1.1. Availability of the releases
| Dissemination and access | Availability | Comments, links, ... |
| Press release | yes | |
| Access to public free of charge | yes | |
| Access to public restricted (membership/password/part of data provided, etc) |
Annexes:
National database
News release
10.2. Dissemination format - Publications
- Online database (containing all/most results) : all the data are published in the online database
- Analytical publication (referring to specific results, e.g. only for one sector or one specific aspect) : some graphs and key drawings and all information have been published on the Statistics by Theme
10.3. Dissemination format - online database
Yes, the online database is available
Annexes:
Database
10.3.1. Data tables - consultations
Not requested.
10.4. Dissemination format - microdata access
.
10.4.1. Dissemination of microdata
| Mean of dissemination | Availability of microdata | Comments, links, ... |
| Eurostat SAFE centre | yes | |
| National SAFE centre | yes | |
| Eurostat: partially anonymised data (SUF) | ||
| National : partially anonymised data |
10.5. Dissemination format - other
No other means of dissemination.
10.5.1. Metadata - consultations
Not requested.
10.6. Documentation on methodology
ESMS Matadata information is available
Annexes:
ESMS Metadata information
10.6.1. Metadata completeness - rate
Not requested.
10.7. Quality management - documentation
There is no special quality documents available.
11.1. Quality assurance
To assure the quality of processes and products, Statistics Estonia applies the EFQM Excellence Model, the European Statistics Code of Practice and the Quality Assurance Framework of the European Statistical System (ESS QAF). Statistics Estonia is also guided by the requirements in § 7. “Principles and quality criteria of producing official statistics” of the Official Statistics Act.
11.2. Quality management - assessment
Statistics Estonia performs all statistical activities according to an international model (Generic Statistical Business Process Model – GSBPM). According to the GSBPM, the final phase of statistical activities is overall evaluation using information gathered in each phase or sub-process; this information can take many forms, including feedback from users, process metadata, system metrics and suggestions from employees. This information is used to prepare the evaluation report which outlines all the quality problems related to the specific statistical activity and serves as input for improvement actions.
Relevance is the degree to which statistics meet current and potential users’ needs. It includes the production of all needed statistics and the extent to which concepts used (definitions, classifications etc.) reflect user needs. The aim is to describe the extent to which the statistics are useful to, and used by, the broadest array of users. For this purpose, statisticians need to compile information, firstly about their users and their needs.
The CIS is based on a common questionnaire and a common survey methodology in order to achieve comparable, harmonised and high quality results for EU Member States, EFTA countries, Candidates and Associated countries.
12.1. Relevance - User Needs
Since 1996 the Statistical Office conducts reputation surveys and user surveys. The survey is conducted at least once a year, the existing as well as potential consumers are interviewed.
The aims of user surveys are:
- to find out the reputation of the Statistical Office among consumers,
- to find out the need for statistical information,
- to study the consumers’ preferences in using various statistical products,
- to get the necessary information for production development.
The results of the surveys are applied for better serving the consumers, as well as in improvement of products. Information on the user surveys results can be found on the website https://www.stat.ee/en/statistics-estonia/about-us/user-surveys
Proposals from stakeholders and users are negotiated to specify the need for data and the possibility their inclusion in the survey. When additional questions are included in the survey, a contract is concluded with the stakeholders, which determines the needs, feasibility and publication of the results.
12.1.1. Needs at national level
| User group | Short description of user group | Main needs for CIS data of the user group Users’ needs |
| 1. Institutions - European level |
The European Commission (DG ENTR) | Innovation Union Scoreboard |
| 1. Institutions - European level | Eurostat | To produce innovation STI statistics and make microdata available for researchers |
| 1. Institutions - National level | Ministry of Ecconomuic Affairs and Communications | To work out STI strategy and politics |
| 1. Institutions - National level | Statistics Estonia | To produce STI statistics and make micro-data available for researchers |
| 2. Social actors | Governmental Foundations connected with STI | To take decisions when financing STI |
| 1. Institutions - Regional level | Local goverrnments | To evaluate local situation in innovation |
| 1. Institutions - International Organisations | OECD, IMF | To evaluate Estonian position and trends in respect to STI |
| 2. Social actors | Employers’ associations | For sector and international comparisons |
| 3. Media | Newspapers, TV and radio channels | To comment the situation to general public |
| 4. Researchers and students | Researches | To analyse the field of S&T&I and have access to the micro-data to make specific research |
| 5. Enterprises or businesses | Big enterprises | Market analysis, investment analysis, possibility to create subsidiaries |
12.2. Relevance - User Satisfaction
Since 1996, Statistics Estonia has conducted reputation and user satisfaction surveys.
All results are available on the website
Annexes:
User satisfaction results
12.3. Completeness
All indicators where included to survey questionnaire and all data was sent to Eurostat.
In CIS 2020 there exist an item non-response in some data cells, which is due to the fact that some enterprises submitted incomplete questionnaires and it was not possible to obtain data from them during the contacts. We did not use the imputation of empty data cells because there was a lack of suitable donors, and the data would have been too distorted.
12.3.1. Data completeness - rate
Not requested.
13.1. Accuracy - overall
Accuracy in the statistical sense denotes the closeness of computations or estimates to the exact or true values. Statistics are not equal with the true values because of variability (the statistics change from implementation to implementation of the survey due to random effects) and bias (the average of the possible values of the statistics from implementation to implementation is not equal to the true value due to systematic effects).
13.2. Sampling error
That part of the difference between a population value and an estimate thereof, derived from a random sample, which is due to the fact that only a subset of the population is enumerated.
13.2.1. Sampling error - indicators
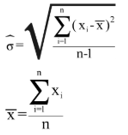
The main indicator used to measure sampling errors for CIS data is the coefficient of variation (CV).
Coefficient of Variation= (Square root of the estimate of the sampling variance) / (Estimated value)
Formula:
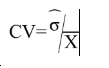
where
13.2.1.1. Coefficient of variations for key variables
| NACE |
Size class |
(1) |
(2) |
(3) |
|---|---|---|---|---|
| Core NACE (B-C-D-E-46-H-J-K-71-72-73) |
Total |
1.8 |
9.3 |
2.2 |
| Core industry (B_C_D_E - excluding construction) |
Total |
2.2 |
13.4 |
3.0 |
[1] = Coefficient of variation for the percentage of innovative enterprises (INN) in the total population of enterprises (ENT20)
[2] = Coefficient of variation for the turnover of product innovative enterprises with new or improved products (TUR_PRD_NEW_MKT), as a percentage of total turnover of product innovative enterprises [TUR20,INNO_PRD].
[3] = Coefficient of variation for percentage of product and/or process innovative enterprises (incl. enterprises with abandoned and or on-going activities) involved in any innovation co-operation arrangement [COOP_ALL,INN], as a percentage of innovative enterprises (INN).
13.2.1.2. Variance estimation method
For variance estimation the Taylor series linearization method is used.
Annexes:
Standard errors formula
13.3. Non-sampling error
Non-sampling errors occur in all phases of a survey. They add to the sampling errors (if present) and contribute to decreasing overall accuracy. It is important to assess their relative weight in the total error and devote appropriate resources for their control and assessment.
13.3.1. Coverage error
Coverage errors (or frame errors) are due to divergences between the target population and the frame population. The frame population is the set of target population members that has a chance to be selected into the survey sample. It is a listing of all items in the population from which the sample is drawn that contains contact details as well as sufficient information to perform stratification and sampling.
13.3.1.1. Over-coverage - rate
Not requested.
13.3.1.2. Common units - proportion
Not requested.
13.3.1.3. Under covered groups of the target population
Updated business register of Estonian economic units do not allow undercoverage.
13.3.1.4. Coverage errors in coefficient variation
Not applicable
13.3.2. Measurement error
Measurement errors occur during data collection and generate bias by recording values different than the true ones. The survey questionnaire used for data collection may have led to the recording of wrong values, or there may be respondent or interviewer bias.
13.3.2.1. Measures for reducing measurement errors
More complex questions in CIS 2020 questionnaire were tested on selected enterprises, before the questionnaire was opened for filling. The wording was improved on the basis of the information provided.
An on-line questionnaire in eSTAT was used to collect the data. Questions were displayed as question blocks or tabs. If a question was not answered, a warning message appeared immediately and the respondent could not allowed to proceed to the next question. The questionnaire cannot be approved until the questions have been answered. Unfortunately, there were still some questionnaires that were not approved. These enterprises were contacted by telephone and additional information was provided as far as possible.
13.3.3. Non response error
Non response occurs when a survey fails to collect data on all survey variables from all the population units designated for data collection in a sample or complete enumeration.
There are two types of non-response:
1) Unit non-response, which occurs when no data (or so little as to be unusable) are collected about a population unit designated for data collection.
a) Un-weighted unit non-response rate (%) = 100*(Number of units with no response or not usable response) / (Total number of in-scope (eligible) units in the sample)
b) Weighted unit non-response rate (%) = 100*(Number of weighted units with no response or not usable response) / (Total number of in-scope (eligible) units in the sample)
2) Item non-response, which occurs when only data on some, but not all survey data items are collected about a population unit designated for data collection.
a) Un-weighted item non-response rate (%) = 100*(Number of units with no response at all for the item) / (Total number of eligible, for the item, units in the sample i.e. filters have to be taken into account)
The unweighted non-response rate was 47.09
13.3.3.1. Unit non-response - rate
See below.
13.3.3.1.1. Un-weighted and weighted unit non-response rate by NACE categories and for enterprises with 10 or more employed persons
Un-weighted and weighted unit non-response rate by NACE categories and for enterprises with 10 or more employees
| NACE | Number of eligible units with no response | Total number of eligible units in the sample | Un-weighted unit non-response rate (%) | Weighted unit non-response rate (%) |
| Core NACE (B-C-D-E-46-H-J-K-71-72-73) | 500 | 2100 | 23.81 | 27.96 |
| Core industry (B_C_D_E - excluding construction) | 267 | 1211 | 22.05 | 26.26 |
| Core Services (46-H-J-K-71-72-73) | 233 | 889 | 26.21 | 29.76 |
The number of eligible units is the number of sample units, which indeed belong to the target population.
13.3.3.1.2. Maximum number of recalls/reminders before coding
The first information letter was sent to sampled enterprises at the beginning of January 2021. The second letter was sent just before the start of the survey on 15 August 2021. During the collection period, five reminder letters were sent to non-responded units.
13.3.3.2. Item non-response - rate
See below.
13.3.3.2.1. Item non-response rate for Turnover (in Core NACE: B-C-D-E-46-H-J-K-71-72-73 enterprises with 10 or more employed persons)
Item non-response rate for Turnover (in Core NACE: B-C-D-E-46-H-J-K-71-72-73 enterprises with 10 or more employees).
| Item non-response rate (un-weighted) | Imputation | If imputed, describe method used, mentioning which auxiliary information or stratification is used | |
| Turnover | 0.38 | no imputation | Turnover data was taken from SBS, as the financial and insurance sectors do not have “turnover”. Instead of turnover, operating income and other operating income data such as insurance premium received, etc. were used. SBS indicators were used for the financial and insurance sector, but for banks, also the information of income statements of credit institutions on the website of Financial Supervision Authority was used. |
13.3.3.2.2. Item non response rate for new questions
Item non-response rate for new questions in CIS t (in Core NACE: B-C-D-E-46-H-J-K-71-72-73 enterprises with 10 or more employees)
| NEW QUESTIONS IN CIS 2020 | Inclusion in national questionnaire | Item non response rate (un-weighted) | Comments |
| 2.2 Market conditions faced by enterprise | yes | 1.81 | Among the respondents to the question, there were enterprises that did not answer the question, even though it was a obligatory question. They were contacted but no further information could be obtained. We did not carry on an item-imputation as there was a lack of suitable donors, and the data would have been too distorted. |
| 2.8 Factors related to climate change | yes | 1.81 | same as above |
| 3.16 Innovations with environmental benefits | yes | 1.69 | same as above |
| 3.17 Factors driving environmental innovations | yes | 1.50 | same as above |
13.3.4. Processing error
There were few processing errors. There were problems with 2 indicators, the enterprise group membership indicator and research and development expenses. In the case of group membership, there were differences in the country of location of the group's parent company compared to the statistical profile data. In these cases, enterprises were contacted by phone and specified membership. In general, the problem was in the respondent's understanding and interpretation.
Regarding research and development expenditures, we compared the data with the RD survey, if there were differences in the data, the respondent was contacted. The differences may have been due to the fact that the respondents were different persons.
13.3.5. Model assumption error
Not requested.
Timeliness and punctuality refer to time and dates, but in a different manner.
14.1. Timeliness
The timeliness of statistics reflects the length of time between data availability and the event or phenomenon they describe.
14.1.1. Time lag - first result
Timeliness of national data – date of first release of national level : Data was published in national database on 25.05.2022
14.1.2. Time lag - final result
Not requested.
14.2. Punctuality
Punctuality refers to the time lag between the release date of data and the target date on which they were scheduled for release as announced officially.
14.2.1. Punctuality - delivery and publication
Date of transmission of complete and validated data to Eurostat (Number of days between that data and 30 June 2022) :
Comparability aims at measuring the impact of differences in applied statistical concepts and definitions on the comparison of statistics between geographical areas, non-geographical domains, or over time.
The coherence of statistical outputs refers to the degree to which the statistical processes by which they were generated used the same concepts (classifications, definitions, and target populations) and harmonised methods. Coherent statistical outputs have the potential to be validly combined and used jointly.
15.1. Comparability - geographical
The data are comparable with countries which collect data based on the common OECD methodology, which is also used by Eurostat. Calculation of enterprise innovation indicators is based on OECD methodology (Oslo Manual), which ensures coherence, comparability over time and across countries. OECD methodology is also used by Eurostat.
15.1.1. Asymmetry for mirror flow statistics - coefficient
Not requested.
15.1.2. National questionnaire – compliance with Eurostat model questionnaire
Methodological deviations from the CIS Harmonised Data Collection (HDC)
| Questions not included in national questionnaire compared to HDC | Comment |
| question 2.4 During the three years 2018 to 2020, did your enterprise..
|
Data about applying for a patent, registration of industrial design rights and registration of trademarks was directly taken from Patent Office. |
| question 4.1 'Number of persons employed' | The number of persons employed was taken from the SBS survey |
| question 4.2 'Number of persons employed with tertiary degree' | There was used used linking of register data. Education data of persons were extracted from the population register and linked to the data of the employment register (TÖR). |
| question 4.3 'Total turnover' | The total turnover was taken from the SBS survey |
| question 4.5 'Age of enterprise' | The age of the enterprise was taken from Statistical Business Register (SPI) |
| Changes in the filtering compared to HDC | Comment |
| question 3.1 'Introduction of innovative goods or services' | The question was split in two parts: During the three years from 2018 to 2020, did your enterprises introduce any
During the three years from 2018 to 2020, did your enterprises introduce any
|
15.1.3. National questionnaire – additional questions
Methodological deviations from the CIS Harmonised Data Collection (HDC)
| Additional questions in national questionnaire (not included in HDC) | Comment |
| no additional questions |
15.2. Comparability - over time
Due to important methodological changes driven by Oslo Manual 2018, CIS 2018 and CIS 2020 cannot be directly compared with previous CIS waves.
15.2.1. Length of comparable time series
Not requested.
15.3. Coherence - cross domain
See the comparison between SBS and CIS data in the section 15.3.3 below.
15.3.1. Coherence - sub annual and annual statistics
Not requested.
15.3.2. Coherence - National Accounts
Not requested.
15.3.3. Coherence – Structural Business Statistics (SBS)
This part compares key variables for aggregated CIS data with SBS data
Definition of relative difference between CIS and SBS data: DIFF = (SBS/CIS)*100
Comparison between SBS and CIS data (relative difference) by NACE categories and for enterprises with 10 or more employees
| NACE | Size class | Number of enterprises (SBS/CIS)* | Number of employees (SBS/CIS)* | Total Turnover (SBS/CIS)* |
| Core NACE (B-C-D-E-46-H-J-K-71-72-73) | Total | 97 | 92 | 90 |
| Core industry (B_C_D_E - excluding construction) | Total | 99 | 94 | 94 |
| Core Services (46-H-J-K-71-72-73) | Total | 95 | 88 | 85 |
* Numbers are to be provided for the last year of the reference period (t)
15.4. Coherence - internal
Not requested.
17.1. Data revision - policy
Not requested.
17.2. Data revision - practice
Not requested.
17.2.1. Data revision - average size
Not requested.
18.1. Source data
See below:
18.1.1. Sampling frame (or census frame)
Stratified simple random sampling by economic activity and size class of the enterprise was used.
Updated business register of Estonian economic units was used as a sampling frame.
18.1.2. Sampling design
The stratified simple random sampling method was used. The frame was stratified by economic activity (NACE Rev2. 2-digit level) and number of persons employed.By number of persons employed enterprises were divided into following size groups: 10-49, 50-249 and 250+.
The Neyman optimal allocation was used for sample allocation and determination of sample size in strata.
Sampling was used for enterprises 10 to 49 persons employed, enterprises with 50 and more persons employed were suveyed totally.
18.1.3. Target population and sample size
| Sample/census indicator | Number of enterprises |
|---|---|
| Target population | 3650 |
| Sample | 2100 |
| In case of combination sample/census: | |
| Sampled units | 1407 |
| Enumerated units/census | 693 |
| Overall sample rate (overall sample/target population) | 76,1 |
18.1.4. Data source for pre-filled variables
Variables and indicators filled or prefilled from other sources.
| Variables/Indicators | Source | Reference year |
| R&D expenditure | R&D survey | 2020 |
| Age of enterprise | SPI (Statistical Register) | 2020 |
18.1.5. Data source and variables used for derivation and weighting
| Item | Response |
| Data source used for deriving population totals | register of economically active enterprises maintained in Statistics Estonia |
| Variables used for weighting | population totals counted from the register and broken down by strata and number of reported units in the strata |
18.2. Frequency of data collection
According to the Commission Regulation (UE) 995/2012, the innovation statistics shall be provided to Eurostat every two years in each even year t+18.
18.3. Data collection
Data are collected and the submission of questionnaires is monitored through the web channel for electronic data submission. The questionnaires have been designed for independent completion and include instructions and controls. The questionnaires and information about data submission are available on Statistics Estonia’s website in Estonian language.
Data are collected with the annual statistical questionnaire “Enterprises innovation survey”.
18.3.1. Survey participation
The survey is mandatory
18.3.2. Survey type
Combination of sample and census.
The part of the target population containing units with less than 50 employees was stratified into staratas with respect to the main activity and number of employees.
Enterprises with number of employees more than 50 were investigated totally.
18.3.3. Combination of sample survey and census data
The part of the target population containing units with less than 50 employees was stratified into staratas with respect to the main activity and number of employees.
18.3.4. Census criteria
Enterprises with number of employees more than 50 were investigated totally
18.3.5. Data collection method
Data collection method
| Survey method | Yes/No | Comment |
|---|---|---|
| Face-to-face interview | ||
| Telephone interview | yes | to a small extent |
| Postal questionnaire | ||
| Electronic questionnaire (format Word or PDF to send back by email) | yes |
to a small extent
|
| Web survey (online survey available on the platform via URL) | yes | most common |
| Other |
Annexes:
National questionnaire in Estonian language in pdf format
18.4. Data validation
Not requested.
18.5. Data compilation
Operations performed on data to derive new information according to a given set of rules.
18.5.1. Imputation - rate
Imputation is the method of creating plausible (but artificial) substitute values for all those missing.
Definition of imputation rate:
Imputation rate (for the variable x) (%) = 100*(Number of replaced values) / (Total number of values for a given variable)
Definition of weighted imputation rate:
Weighted imputation rate= 100*(Number of total weighted replaced values) / (Total number of weighted values for a given variable)
18.5.1.1. Imputation rate for metric variables
Imputation rate for metric variables by NACE categories and for enterprises with 10 or more employees:
| NACE | Size class | Total Turnover (1) | Turnover from products new to the market (2) | R&D expenditure in-house (3) | |||
| Unweighted | Weighted | Unweighted | Weighted | Unweighted | Weighted | ||
| Core NACE (B-C-D-E-46-H-J-K-71-72-73) | Total |
|
|
||||
| Core industry (B_C_D_E - excluding construction) | Total | ||||||
| Core Services (46-H-J-K-71-72-73) | Total | ||||||
(1) = Total turnover in the last year of the reference period (t) (TUR)
(2) = Share of the turnover in the last year of the reference period (t) due to new or improved product new to the market in the total turnover for product innovative enterprises TUR_PRD_NEW_MKT/TUR(INNO_PRD)
(3) = R&D expenditure performed in-house (EXP_INNO_RND_IH)
18.5.2. Weights calculation
Weights calculation method for sample surveys
| Method | Selected applied method | Comments |
| Inverse sampling fraction | ||
| Non-respondent adjustments | ||
| Other | For calculation weights population totals counted from the register and broken down by strata and number of reported units in the strata are used |
18.6. Adjustment
Not applicable
18.6.1. Seasonal adjustment
Not requested.
The Community Innovation Survey (CIS) is a survey about innovation activities in enterprises. The survey is designed to collect the information on types of innovation, processes of development of innovation like cooperation patterns, financing and expenditure, objectives of innovation activities or barriers for initiating or implementing innovation.
The CIS provides statistics by type of innovators, economic activity and size class of enterprises. The survey is currently carried out every two years across the EU Member States, EFTA countries and EU candidate countries.
In order to ensure comparability across countries, Eurostat together with the countries develops a Harmonised Data Collection (HDC) questionnaire and drafts the methodological recommendations for implementation of each survey round.
CIS 2020 is a second in a row to implement concepts and methodology of the Oslo Manual 4th Edition revised in 2018. The changes in the CIS driven by the revision of the manual and their impact on collected indicators are described in the Statistics Explained article: Community Innovation Survey – new features.
The legal framework for CIS since 2012 is the Commission Regulation No 995/2012 that establishes the quality conditions for the data collection and transmissionand identifies the obligatory cross-coverage of economic sectors, size class of enterprises and innovation indicators. The target population are enterprises with at least 10 employees classified in the core NACE economic sectors (see 3.3). Further activities may be covered on a voluntary basis in national datasets. Most statistics are based on the 3-year reference period (t, t-1, t-2), but some use only one calendar year (t or t-2). Please refer to the Annex section of the European metadata (ESMS) for details of the time coverage of collected indicators.
28 May 2024
The description of concepts, definitions and main statistical variables is available in CIS 2020 European metadata file (ESMS) Results of the community innovation survey 2020 (CIS2020) (inn_cis12) in Eurostat database.
Statistical unit is enterprise
Core target population are all enterprises in CORE NACE activities (see 3.3.1) with 10 or more employees.
All territory of Estonia is covered.
Estonia is at NUTS 2 level.
For CIS 2020, the time covered by the survey is the 3-year period from the beginning of 2018 to the end of 2020.
Some questions and indicators refer to one year — 2020.
The list of indicators covering the 3-year period and referring to one year according to the HDC is available in the Annex section of the European metadata (ESMS).
Accuracy in the statistical sense denotes the closeness of computations or estimates to the exact or true values. Statistics are not equal with the true values because of variability (the statistics change from implementation to implementation of the survey due to random effects) and bias (the average of the possible values of the statistics from implementation to implementation is not equal to the true value due to systematic effects).
CIS indicators are available according to 3 units of measure:
NR: Number for number of enterprises and number of persons employed.
THS_EUR: Thousands of euros. All financial variables are provided in thousands of euros, i.e. Turnover or Innovation expenditure.
PC: Percentage. The percentage is the ratio between the selected combinations of indicators.
Operations performed on data to derive new information according to a given set of rules.
See below:
CIS is conducted and disseminated at two-year interval in pair years.
The timeliness of statistics reflects the length of time between data availability and the event or phenomenon they describe.
The data are comparable with countries which collect data based on the common OECD methodology, which is also used by Eurostat. Calculation of enterprise innovation indicators is based on OECD methodology (Oslo Manual), which ensures coherence, comparability over time and across countries. OECD methodology is also used by Eurostat.
Due to important methodological changes driven by Oslo Manual 2018, CIS 2018 and CIS 2020 cannot be directly compared with previous CIS waves.
