|
 |
| For any question on data and metadata, please contact: Eurostat user support |
|
|||
| 1.1. Contact organisation | INSTITUTO NACIONAL DE ESTADISTICA (INE) |
||
| 1.2. Contact organisation unit | Science and Technology Unit |
||
| 1.5. Contact mail address | Avenida de Manoteras 50-52 , planta 3 despacho 343 |
||
|
|||
| 2.1. Metadata last certified | 01/07/2021 | ||
| 2.2. Metadata last posted | 01/07/2021 | ||
| 2.3. Metadata last update | 01/07/2021 | ||
|
||||||||||||||||||||||||||||||||||||||||||||||||
| 3.1. Data description | ||||||||||||||||||||||||||||||||||||||||||||||||
The Community Innovation Survey (CIS) is a survey about innovation activities in enterprises. The survey is designed to collect the information on different types of innovation, various aspects of the development of an innovation, objectives of innovation activities, sources of information, public funding or expenditure on innovation. It is aim is to measure the innovativeness of sectors and enable the analysis of the factors of innovation. The CIS provides statistics by type of innovators, economic activities and size class of enterprises. The survey is currently carried out every two years across the EU Member States, EFTA countries and EU candidate countries.
In order to ensure comparability across countries, Eurostat together with the countries developed a Harmonised Data Collection (HDC) questionnaire accompanied by a set of definitions and methodological recommendations.
CIS 2018 concepts and its underlying methodology are based on the Oslo Manual (2018) 4th Edition.
New review of the CIS2018 aims to meet several objectives : 1: Reduce subjectivity and biases in the main CIS indicators 2: Improve reporting about innovation activities and capabilities in the firm 3: Ensure international comparability (including compliance with the OM4) 4: Broaden the basis CIS information on enterprise management 5: Take better account the diversity of enterprises in the EU 6: Improve reporting about external drivers and enablers of innovation 7: Improve timeliness 8: Ensure the feasibility of data collection 9: Ensure continuity with the CIS 2016 10: Improve reporting about the output and impact of innovation
CIS2018 is conducted under Commission Regulation No 995/2012. This Regulation defines the mandatory target population of the survey referring to enterprises in the Core NACE economic sectors (see section 3.3.) with at least 10 employees. Further activities may be covered on a voluntary basis in national datasets. Most statistics are based on the 3-year reference period (t, t-1, t-2), but some use only one calendar year (t or t-2).
Please consider CIS t to be the survey that refers to the same year of the quality report and CIS t-2 to be the previous survey e.g.: CIS 2018= CIS t then, CIS t-2=CIS 2016 |
||||||||||||||||||||||||||||||||||||||||||||||||
| 3.2. Classification system | ||||||||||||||||||||||||||||||||||||||||||||||||
Indicators related to the enterprises are classified by country, economic activity (NACE Rev. 2), size class of enterprises and type of innovation.
The main typology of classification of enterprises in reference to innovation is the distinction between innovation-active enterprises (INN) and not innovation-active enterprises (NINN). The enterprise is considered as innovative (INN) if during the reference period it successfully introduced a product or business process innovation, had ongoing innovation activities, abandoned innovation activities or was engaged in in-house R&D or R&D contracted out. Non-innovative (NINN) enterprises had no innovation activity mentioned above whatsoever during the reference period. |
||||||||||||||||||||||||||||||||||||||||||||||||
| 3.3. Coverage - sector | ||||||||||||||||||||||||||||||||||||||||||||||||
CIS covers main economic sectors according to NACE Rev.2 broken down by size class of enterprises and type of innovation activity. |
||||||||||||||||||||||||||||||||||||||||||||||||
| 3.3.1. Main economic sectors covered - NACE Rev.2 | ||||||||||||||||||||||||||||||||||||||||||||||||
In accordance with Commission Regulation 995/2012 on innovation statistics, the following industries and services are included in the core target population. Results are made available with these following breakdowns : All NACE – Core NACE (NACE Rev. 2 sections & divisions B-C-D-E-46-H-J-K-71-72-73 )
CORE INDUSTRY (excluding construction) (NACE Rev. 2 SECTIONS B_C_D_E) 10-12: Manufacture of food products, beverages and tobacco 13-15: Manufacture of textiles, wearing apparel, leather and related products 16-18: Manufacture of wood, paper, printing and reproduction 20: Manufacture of chemicals and chemical products 21: Manufacture of basic pharmaceutical products and pharmaceutical preparations 19-22: Manufacture of petroleum, chemical, pharmaceutical, rubber and plastic products 23: Manufacture of other non-metallic mineral products 24: Manufacture of basic metals 25: Manufacture of fabricated metal products, except machinery and equipment 26: Manufacture of computer, electronic and optical products 25-30: Manufacture of fabricated metal products (except machinery and equipment), computer, electronic and optical products, electrical equipment, motor vehicles and other transport equipment 31-33: Manufacture of furniture; jewellery, musical instruments, toys; repair and installation of machinery and equipment
D: ELECTRICITY, GAS, STEAM AND AIR CONDITIONING SUPPLY
E: WATER SUPPLY; SEWERAGE, WASTE MANAGEMENT AND REMEDIATION ACTIVITIES 36: Water collection, treatment and supply 37-39: Sewerage, waste management, remediation activities
CORE SERVICES (NACE Rev. 2 sections & divisions 46-H-J-K-71-72-73)(NACE code in the tables = G46-M73_INN) 46: Wholesale trade, except of motor vehicles and motorcycles
H: TRANSPORTATION AND STORAGE 49-51: Land transport and transport via pipelines, water transport and air transport 52-53: Warehousing and support activities for transportation and postal and courier activities
J: INFORMATION AND COMMUNICATION 58: Publishing activities 61: Telecommunications 62: Computer programming, consultancy and related activities 63: Information service activities
K: FINANCIAL AND INSURANCE ACTIVITIES 64: Financial service activities, except insurance and pension funding 65: Insurance, reinsurance and pension funding, except compulsory social security 66: Activities auxiliary to financial services and insurance activities
M: PROFESSIONAL, SCIENTIFIC AND TECHNICAL ACTIVITIES 71: Architectural and engineering activities; technical testing and analysis 72: Scientific research and development 73: Advertising and market research 71-73: Architectural and engineering activities; technical testing and analysis; Scientific research and development; Advertising and market research |
||||||||||||||||||||||||||||||||||||||||||||||||
| 3.3.1.1. Main economic sectors covered - NACE Rev.2 - national particularities | ||||||||||||||||||||||||||||||||||||||||||||||||
Additional NACE2 classes included: |
||||||||||||||||||||||||||||||||||||||||||||||||
| 3.3.2. Sector coverage - size class | ||||||||||||||||||||||||||||||||||||||||||||||||
In accordance with Commission Regulation 995/2012 on innovation statistics, the following size classes of enterprises according to number of employees are included in the core target population of the CIS:
|
||||||||||||||||||||||||||||||||||||||||||||||||
| 3.3.2.1. Sector coverage - size class - national particularities | ||||||||||||||||||||||||||||||||||||||||||||||||
No deviation. All enterprises with 10 employees or more are covered by the Innovation survey. |
||||||||||||||||||||||||||||||||||||||||||||||||
| 3.4. Statistical concepts and definitions | ||||||||||||||||||||||||||||||||||||||||||||||||
The description of concepts, definitions and main statistical variables is available in CIS 2018 European metadata file (ESMS) Results of the community innovation survey 2018 (CIS2018) (inn_cis11) in Eurostat database. |
||||||||||||||||||||||||||||||||||||||||||||||||
| 3.5. Statistical unit | ||||||||||||||||||||||||||||||||||||||||||||||||
The main statistical unit used is the enterprise, as a legal unit. The Central Businesses Directory (DIRCE) collects all Spanish businesses in a single directory. Its basic objective is to enable business-targeted sample surveys to be conducted, and consequently, it registers information such as identity data, location, main activity or number of employees. |
||||||||||||||||||||||||||||||||||||||||||||||||
| 3.6. Statistical population | ||||||||||||||||||||||||||||||||||||||||||||||||
Core target population are all enterprises in CORE NACE activities (see 3.3.1) with 10 or more employees. |
||||||||||||||||||||||||||||||||||||||||||||||||
| 3.7. Reference area | ||||||||||||||||||||||||||||||||||||||||||||||||
The survey covers the whole national territory. Main variables are disaggregated by region. |
||||||||||||||||||||||||||||||||||||||||||||||||
| 3.8. Coverage - Time | ||||||||||||||||||||||||||||||||||||||||||||||||
Several rounds of Community Innovation Survey have been conducted so far at two-year interval since end of 90’s. |
||||||||||||||||||||||||||||||||||||||||||||||||
| 3.8.1. Participation in the CIS waves | ||||||||||||||||||||||||||||||||||||||||||||||||
*two reference periods can be distinguished for CIS light: 2000-2002 and 2001-2003 |
||||||||||||||||||||||||||||||||||||||||||||||||
| 3.9. Base period | ||||||||||||||||||||||||||||||||||||||||||||||||
Not relevant. |
||||||||||||||||||||||||||||||||||||||||||||||||
|
|||
CIS indicators are available according to 3 units of measure:
NR: Number for number of enterprises and number of persons employed. THS_EUR: Thousands of euros. All financial variables are provided in thousands of euros, i.e. Turnover or Innovation expenditure. PC: Percentage. The percentage is the ratio between the selected combinations of indicators. |
|||
|
|||
For CIS 2018, the time covered by the survey is the 3-year period from the beginning of 2016 to the end of 2018. Some questions and indicators refer to one year — 2018. The list of indicators covering the 3-year period and referring to one year according to the HDC is available in the Annex section of the European metadata (ESMS). |
|||
|
|||
| 6.1. Institutional Mandate - legal acts and other agreements | |||
CIS surveys are based on the Commission Regulation No 995/2012, implementing Decision No 1608/2003/EC of the European Parliament and of the Council on the production and development of Community statistics on science and technology. This Regulation establishes innovation statistics on a statutory basis and makes the delivery of certain variables compulsory e.g. innovation activities, cooperation, development, expenditures and turnover (see the Regulation). Each survey wave may additionally include further variables. In addition, the Regulation defines the obligatory cross-coverage of economic sectors and size class of enterprises. |
|||
| 6.1.1. National legislation | |||
The compilation and dissemination of the data are governed by the Statistical Law No. 12/1989 "Public Statistical Function" of May 9, 1989, and Law No. 4/1990 of June 29 on “National Budget of State for the year 1990" amended by Law No. 13/1996 "Fiscal, administrative and social measures" of December 30, 1996, makes compulsory all statistics included in the National Statistics Plan. The National Statistical Plan 2009-2012 was approved by the Royal Decree 1663/2008. It contains the statistics that must be developed in the four year period by the State General Administration's services or any other entity dependent on it. All statistics included in the National Statistics Plan are statistics for state purposes and are obligatory. The National Statistics Plan 2017-2020, approved by Royal Decree 410/2016, of 31 October, is the Plan currently implemented. This statistical operation has governmental purposes, and it is included in the National Statistics Plan 2017-2020. (Statistics of the State Administration). |
|||
| 6.2. Institutional Mandate - data sharing | |||
Not requested. |
|||
|
|||
CIS data are transmitted to Eurostat via EDAMIS using the secured transmission system. |
|||
| 7.1. Confidentiality - policy | |||
The main national legal regulations applicable to the protection of statistical data are: - "Ley Orgánica 3/2018 de Protección de Datos Personales y garantía de los derechos digitales" - "Ley 12/1989 de la Función Estadística Pública" - "Real Decreto 428/1993, de 26 de marzo, por el que se aprueba el Estatuto de la Agencia de Protección de Datos" - "Real Decreto 994/1999, de 11 de junio, por el que se aprueba el Reglamento de medidas de seguridad de los ficheros automatizados que contengan datos de carácter personal" |
|||
| 7.2. Confidentiality - data treatment | |||
In order to avoid data disclosure, tabulation and information at different levels are analyzed to prevent that confidential data of statistical units could be derived. In tabulation, a cell is suppressed if there is less than 4 units representing the cell. |
|||
|
|||
| 8.1. Release calendar | |||
The advance release calendar that shows the precise release dates for the coming year is disseminated in the last quarter of each year. |
|||
| 8.2. Release calendar access | |||
The calendar is disseminated on the INEs Internet website (Publications Calendar) |
|||
| 8.3. Release policy - user access | |||
The data are released simultaneously according to the advance release calendar to all interested parties by issuing the press release. At the same time, the data are posted on the INE's Internet website (www.ine.es/en) almost immediately after the press release is issued. Also some predefined tailor-made requests are sent to registered users. Some users could receive partial information under embargo as it is publicly described in the European Statistics Code of Practice |
|||
|
|||
CIS is conducted and disseminated at two-year interval in pair years. |
|||
|
|||||||||||||||
Accessibility and clarity refer to the simplicity and ease for users to access statistics using simple and user-friendly procedure, obtaining them in an expected form and within an acceptable time period, with the appropriate user information and assistance: a global context which finally enables them to make optimum use of the statistics. |
|||||||||||||||
| 10.1. Dissemination format - News release | |||||||||||||||
See below. |
|||||||||||||||
| 10.1.1. Availability of the releases | |||||||||||||||
|
|||||||||||||||
| 10.2. Dissemination format - Publications | |||||||||||||||
- Online database (containing all/most results) : Yes - Analytical publication (referring to all/most results) : No - Analytical publication (referring to specific results, e.g. only for one sector or one specific aspect) : No |
|||||||||||||||
| 10.3. Dissemination format - online database | |||||||||||||||
INEbase is the system the INE uses to store statistical information on the Internet. It contains all the information the INE produces in electronic formats. The primary organisation of the information follows the theme-based classification of the Inventory of Statistical Operations of the State General Administration. The basic unit of INEbase is the statistical operation, defined as the set of activities that lead to obtaining statistical results on a determined sector or topic using data collected individually. Access to tables and time series in INEbase, within the "Science and Technology" section in http://www.ine.es/dyngs/INEbase/en/operacion.htm?c=Estadistica_C&cid=1254736176754&menu=resultados&idp=1254735576669 |
|||||||||||||||
| 10.3.1. Data tables - consultations | |||||||||||||||
Not requested. |
|||||||||||||||
| 10.4. Dissemination format - microdata access | |||||||||||||||
See below |
|||||||||||||||
| 10.4.1. Dissemination of microdata | |||||||||||||||
|
|||||||||||||||
| 10.5. Dissemination format - other | |||||||||||||||
There is the possibility of requesting customised information from the INE User Care Department. At the time of processing said requests, this considers limitations regarding confidentiality or precision. |
|||||||||||||||
| 10.5.1. Metadata - consultations | |||||||||||||||
Not requested. |
|||||||||||||||
| 10.6. Documentation on methodology | |||||||||||||||
In order to facilitate the adequate comprehension and use of data, some documents are also published. These documents are: - Standardised Methodological Report See: https://www.ine.es/dyngs/INEbase/en/operacion.htm?c=Estadistica_C&cid=1254736176755&menu=metodologia&idp=1254735576669 |
|||||||||||||||
| 10.6.1. Metadata completeness - rate | |||||||||||||||
Not requested. |
|||||||||||||||
| 10.7. Quality management - documentation | |||||||||||||||
If a user have any special request or doubt concerning data or metadata, it is possible to contact with the Science and Technology Unit (via electronic template) in order to obtain a more extended response or clarification. |
|||||||||||||||
|
|||
| 11.1. Quality assurance | |||
Quality assurance framework for the INE statistics is based on the ESSCoP, the European Statistics Code of Practice made by EUROSTAT. The ESSCoP is made up of 16 principles, gathered in three areas: Institutional Environment, Processes and Products. Each principle is associated with some indicators which make possible to measure it. In order to evaluate quality, EUROSTAT provides different tools: the indicators mentioned above, Self-assessment based on the DESAP model, peer review, user satisfaction surveys and other proceedings for evaluation. In order to guarantee quality information, the information received is processing following the steps listed below: - Control and manual filtering of the questionnaires by the units involved in the information collection, with the objective of recovering the possible lack of data, or of correcting errors in the questionnaires before they are recorded. - Interactive recording with filtering and correction of the errors in the information obtained by the units involved in the information collection. - Control of the information received by the unit responsible for the survey. - Control of the scope and processing of identification errors. - Validation of the quality of the information. - Imputation of the partial non-response. - Filtering and interaction correction of inconsistencies in the validated information. - Preparation of a first phase of results analysis tables. - Macro-publishing of the main aggregates to correct the errors not detected in the previous micro-filtering phase. - Data analysis. - Creation of the final data file. - Obtaining final results tables in the unit responsible for the survey, compiled using the final data file. |
|||
| 11.2. Quality management - assessment | |||
The general assessment is that the quality of the Spanish Innovation Survey is high. The following may be cited as being among the main strengths of this survey: 1) Quick collection, analysis and publication of the results at national level, in such a way that the data dissemination is carried out within the year that follows the end of the reference period. 2) As a survey that has been conducted annually since 2002, a comprehensive follow-up of the data may be performed so that possible inconsistencies therein may be detected, ensuring a time series that is consistent over time. 3) An effort has been made to collect the information online, resulting in more than 90% of the questionnaires collected this way. 4) High response rate. |
|||
|
||||||||||||||||||||||||||||||
Relevance is the degree to which statistics meet current and potential users needs. It includes the production of all needed statistics and the extent to which concepts used (definitions, classifications etc.) reflect user needs. The aim is to describe the extent to which the statistics are useful to, and used by, the broadest array of users. For this purpose, statisticians need to compile information, firstly about their users and their needs. The CIS is based on a common questionnaire and a common survey methodology, as laid down in the 3rd edition of Oslo Manual (2005 edition), in order to achieve comparable, harmonised and high quality results for EU Member States, EFTA countries, Candidates and Associated countries. |
||||||||||||||||||||||||||||||
| 12.1. Relevance - User Needs | ||||||||||||||||||||||||||||||
At European level, Eurostat contributes in identifying and defining the main topics/questions to be covered. At national level, main users (e.g. Observatorio Mujeres, Ciencia e Innovación (OMCI), Ministerio de Ciencia e Innovación (MICIN), …) are consulted for their needs and are involved in the process of the development of the model questionnaires at a very early stage. |
||||||||||||||||||||||||||||||
| 12.1.1. Needs at national level | ||||||||||||||||||||||||||||||
|
||||||||||||||||||||||||||||||
| 12.2. Relevance - User Satisfaction | ||||||||||||||||||||||||||||||
The INE has carried out general user satisfaction surveys in 2007, 2010, 2013, 2016 and 2019, and it plans to continue doing so every three years. The purpose of these surveys is to find out what users think about the quality (in terms of relevance, accuracy and reliabilitiy, timeliness and punctuality, coherence and comparability) of the statistical outputs disseminated by INE as well as other topics such as the accessibility of the information or to which extent their needs of information are covered by the current statistics. In the last user satisfaction survey, carried out, in 2019, the "Science and Technology" sector obtained more than 80% of positive assessment. |
||||||||||||||||||||||||||||||
| 12.3. Completeness | ||||||||||||||||||||||||||||||
The Innovation in Companies Survey meets all the requirements established in the national and international regulations related to science and technology statistics. Said statistics are governed by Commission Regulation no. 995/2012, of 26 October 2012. As a result, the rate of compulsory statistical information supplied is 100%. |
||||||||||||||||||||||||||||||
| 12.3.1. Data completeness - rate | ||||||||||||||||||||||||||||||
Not requested. |
||||||||||||||||||||||||||||||
|
||||||||||||||||||||||||||||||||||||||||||||||||||||
| 13.1. Accuracy - overall | ||||||||||||||||||||||||||||||||||||||||||||||||||||
Accuracy in the statistical sense denotes the closeness of computations or estimates to the exact or true values. Statistics are not equal with the true values because of variability (the statistics change from implementation to implementation of the survey due to random effects) and bias (the average of the possible values of the statistics from implementation to implementation is not equal to the true value due to systematic effects). |
||||||||||||||||||||||||||||||||||||||||||||||||||||
| 13.2. Sampling error | ||||||||||||||||||||||||||||||||||||||||||||||||||||
That part of the difference between a population value and an estimate thereof, derived from a random sample, which is due to the fact that only a subset of the population is enumerated. |
||||||||||||||||||||||||||||||||||||||||||||||||||||
| 13.2.1. Sampling error - indicators | ||||||||||||||||||||||||||||||||||||||||||||||||||||
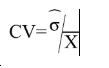
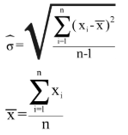
The main indicator used to measure sampling errors for CIS data is the coefficient of variation (CV).
Coefficient of Variation= (Square root of the estimate of the sampling variance) / (Estimated value) Formula: where
|
||||||||||||||||||||||||||||||||||||||||||||||||||||
| 13.2.1.1. Coefficient of variations for key variables | ||||||||||||||||||||||||||||||||||||||||||||||||||||
Coefficient of variation (%) for key variables by NACE categories and for enterprises with 10 and more employees
[1] = Coefficient of variation for the percentage of innovative enterprises (INN) in the total population of enterprises (ENT18) |
||||||||||||||||||||||||||||||||||||||||||||||||||||
| 13.2.1.2. Variance estimation method | ||||||||||||||||||||||||||||||||||||||||||||||||||||
See attached document. Annexes: Variance estimation method |
||||||||||||||||||||||||||||||||||||||||||||||||||||
| 13.3. Non-sampling error | ||||||||||||||||||||||||||||||||||||||||||||||||||||
Non-sampling errors occur in all phases of a survey. They add to the sampling errors (if present) and contribute to decreasing overall accuracy. It is important to assess their relative weight in the total error and devote appropriate resources for their control and assessment. |
||||||||||||||||||||||||||||||||||||||||||||||||||||
| 13.3.1. Coverage error | ||||||||||||||||||||||||||||||||||||||||||||||||||||
Coverage errors (or frame errors) are due to divergences between the target population and the frame population. The frame population is the set of target population members that has a chance to be selected into the survey sample. It is a listing of all items in the population from which the sample is drawn that contains contact details as well as sufficient information to perform stratification and sampling. |
||||||||||||||||||||||||||||||||||||||||||||||||||||
| 13.3.1.1. Over-coverage - rate | ||||||||||||||||||||||||||||||||||||||||||||||||||||
6% |
||||||||||||||||||||||||||||||||||||||||||||||||||||
| 13.3.1.2. Common units - proportion | ||||||||||||||||||||||||||||||||||||||||||||||||||||
Not requested. |
||||||||||||||||||||||||||||||||||||||||||||||||||||
| 13.3.1.3. Under covered groups of the target population | ||||||||||||||||||||||||||||||||||||||||||||||||||||
CIS covers every enterprise with 10 or more employees in the Core NACE economic sectors according to the regulation. |
||||||||||||||||||||||||||||||||||||||||||||||||||||
| 13.3.1.4. Coverage errors in coefficient variation | ||||||||||||||||||||||||||||||||||||||||||||||||||||
Coverage errors in coefficient variation are reflected by the increase in error due to:
The percentage of stratum changes is 4.70% We don’t asses their relative weight in the total error. The response rate is quite high, more than 80%, and for the units with 100 or more employees, the response rate is around 90%. |
||||||||||||||||||||||||||||||||||||||||||||||||||||
| 13.3.2. Measurement error | ||||||||||||||||||||||||||||||||||||||||||||||||||||
Measurement errors occur during data collection and generate bias by recording values different than the true ones. The survey questionnaire used for data collection may have led to the recording of wrong values, or there may be respondent or interviewer bias. |
||||||||||||||||||||||||||||||||||||||||||||||||||||
| 13.3.2.1. Measures for reducing measurement errors | ||||||||||||||||||||||||||||||||||||||||||||||||||||
Survey inspectors are responsible for theoretical and practical training of the staff involved in field work, and for controlling work relating to the collection of information. To this purpose, manuals and training documents are available. |
||||||||||||||||||||||||||||||||||||||||||||||||||||
| 13.3.3. Non response error | ||||||||||||||||||||||||||||||||||||||||||||||||||||
Non response occurs when a survey fails to collect data on all survey variables from all the population units designated for data collection in a sample or complete enumeration. There are two types of non-response: 1) Unit non-response, which occurs when no data (or so little as to be unusable) are collected about a population unit designated for data collection. a) Un-weighted unit non-response rate (%) = 100*(Number of units with no response or not usable response) / (Total number of in-scope (eligible) units in the sample) b) Weighted unit non-response rate (%) = 100*(Number of weighted units with no response or not usable response) / (Total number of in-scope (eligible) units in the sample) 2) Item non-response, which occurs when only data on some, but not all survey data items are collected about a population unit designated for data collection. a) Un-weighted item non-response rate (%) = 100*(Number of units with no response at all for the item) / (Total number of eligible, for the item, units in the sample i.e. filters have to be taken into account) |
||||||||||||||||||||||||||||||||||||||||||||||||||||
| 13.3.3.1. Unit non-response - rate | ||||||||||||||||||||||||||||||||||||||||||||||||||||
See below. |
||||||||||||||||||||||||||||||||||||||||||||||||||||
| 13.3.3.1.1. Un-weighted and weighted unit non-response rate by NACE categories and for enterprises with 10 or more employees | ||||||||||||||||||||||||||||||||||||||||||||||||||||
Un-weighted and weighted unit non-response rate by NACE categories and for enterprises with 10 or more employees
The number of eligible units is the number of sample units, which indeed belong to the target population. |
||||||||||||||||||||||||||||||||||||||||||||||||||||
| 13.3.3.1.2. Maximum number of recalls/reminders before coding | ||||||||||||||||||||||||||||||||||||||||||||||||||||
There are at least three reminders (by mail or by phone) to the non-responding enterprise, although the unit can be contacted again by different means. |
||||||||||||||||||||||||||||||||||||||||||||||||||||
| 13.3.3.2. Item non-response - rate | ||||||||||||||||||||||||||||||||||||||||||||||||||||
See below. |
||||||||||||||||||||||||||||||||||||||||||||||||||||
| 13.3.3.2.1. Item non-response rate for Turnover (in Core NACE: B-C-D-E-46-H-J-K-71-72-73 enterprises with 10 or more employees) | ||||||||||||||||||||||||||||||||||||||||||||||||||||
Item non-response rate for Turnover (in Core NACE: B-C-D-E-46-H-J-K-71-72-73 enterprises with 10 or more employees).
|
||||||||||||||||||||||||||||||||||||||||||||||||||||
| 13.3.3.2.2. Item non response rate for new questions | ||||||||||||||||||||||||||||||||||||||||||||||||||||
Item non-response rate for new questions in CIS t (in Core NACE: B-C-D-E-46-H-J-K-71-72-73 enterprises with 10 or more employees)
We cannot calculate the non-response rate because the unit are contacted by the agents until the questions have response. |
||||||||||||||||||||||||||||||||||||||||||||||||||||
| 13.3.4. Processing error | ||||||||||||||||||||||||||||||||||||||||||||||||||||
The information collection method is a mixed system based on postal mailings and interviewer participation, with significant telephone support for the collection thereof. A postal letter is sent to the respondants informing them that their enterprise belongs to the sample of the Innovation Survey INE is carrying out. The letter also provides them with the access rights (username/password) to the on-line questionnaire hosted on the INE servers. They are also informed that, if preferred, they can apply for the paper version which they can fill in and send back to the INE through mail, fax or e-mail. Most of the respondents (93.69% in the case of the 2018 Innovation Survey) use the on-line tool so the data entry method are, essentially, the responses through online questionnaires. |
||||||||||||||||||||||||||||||||||||||||||||||||||||
| 13.3.5. Model assumption error | ||||||||||||||||||||||||||||||||||||||||||||||||||||
Not requested. |
||||||||||||||||||||||||||||||||||||||||||||||||||||
|
|||
Timeliness and punctuality refer to time and dates, but in a different manner. |
|||
| 14.1. Timeliness | |||
The timeliness of statistics reflects the length of time between data availability and the event or phenomenon they describe. |
|||
| 14.1.1. Time lag - first result | |||
Timeliness of national data – date of first release of national level : 21/12/2020 |
|||
| 14.1.2. Time lag - final result | |||
Not requested. |
|||
| 14.2. Punctuality | |||
Punctuality refers to the time lag between the release date of data and the target date on which they were scheduled for release as announced officially. |
|||
| 14.2.1. Punctuality - delivery and publication | |||
Date of transmission of complete and validated data to Eurostat (Number of days between that data and 30 June 2020) : 29/06/2020 (1 day) |
|||
|
||||||||||||||||||||
Comparability aims at measuring the impact of differences in applied statistical concepts and definitions on the comparison of statistics between geographical areas, non-geographical domains, or over time. The coherence of statistical outputs refers to the degree to which the statistical processes by which they were generated used the same concepts (classifications, definitions, and target populations) and harmonised methods. Coherent statistical outputs have the potential to be validly combined and used jointly. |
||||||||||||||||||||
| 15.1. Comparability - geographical | ||||||||||||||||||||
We follow the international standards, concepts and definitions provided by Oslo manual and Eurostat guidelines at the whole territory and there is not discrepancy at nacional level and in comparison to remaining EU countries. |
||||||||||||||||||||
| 15.1.1. Asymmetry for mirror flow statistics - coefficient | ||||||||||||||||||||
Not requested. |
||||||||||||||||||||
| 15.1.2. National questionnaire – compliance with Eurostat model questionnaire | ||||||||||||||||||||
Methodological deviations from the CIS Harmonised Data Collection (HDC)
|
||||||||||||||||||||
| 15.1.3. National questionnaire – additional questions | ||||||||||||||||||||
Methodological deviations from the CIS Harmonised Data Collection (HDC)
|
||||||||||||||||||||
| 15.2. Comparability - over time | ||||||||||||||||||||
Due to important methodological changes in CIS 2018 driven by Oslo Manual 2018, the data 2018 cannot be directly compared with previous CIS waves. |
||||||||||||||||||||
| 15.2.1. Length of comparable time series | ||||||||||||||||||||
Not requested. |
||||||||||||||||||||
| 15.3. Coherence - cross domain | ||||||||||||||||||||
See the comparison between SBS and CIS data in the section 15.3.3 below. |
||||||||||||||||||||
| 15.3.1. Coherence - sub annual and annual statistics | ||||||||||||||||||||
Not requested. |
||||||||||||||||||||
| 15.3.2. Coherence - National Accounts | ||||||||||||||||||||
Not requested. |
||||||||||||||||||||
| 15.3.3. Coherence – Structural Business Statistics (SBS) | ||||||||||||||||||||
This part compares key variables for aggregated CIS data with SBS data
* Numbers are to be provided for the last year of the reference period (t) Note: Section K data is not available for SBS, and so CIS data is calculated without section K in order to maintain comparability. |
||||||||||||||||||||
| 15.4. Coherence - internal | ||||||||||||||||||||
Not requested. |
||||||||||||||||||||
|
|||
Confidential information on the production cost of the CIS. |
|||
|
|||
| 17.1. Data revision - policy | |||
Not requested. |
|||
| 17.2. Data revision - practice | |||
Not requested. |
|||
| 17.2.1. Data revision - average size | |||
Not requested. |
|||
|
||||||||||||||||||||||||||||||||||||||
| 18.1. Source data | ||||||||||||||||||||||||||||||||||||||
See below. |
||||||||||||||||||||||||||||||||||||||
| 18.1.1. Sampling frame (or census frame) | ||||||||||||||||||||||||||||||||||||||
The Central Businesses Directory (DIRCE) collects all Spanish businesses in a single directory. Its basic objective is to enable business-targeted sample surveys to be conducted, and consequently, it registers information such as identity data, location, main activity or number of employees. This information is obtained from administrative sources (Inland Revenue and Social Security) and complemented with data from common statistical operations. This directory is annually updated. Similarly, due to the coordination of the R&D and the Innovation Survey, the Directory of Enterprises that performed R&D or are potential R&D performers (DIRID) is also used. This register is annually updated by the following data: a) Enterprises receiving public support or grants for R&D activities (including not only Central Government but also almost all Autonomous Communities Governments). b) Enterprises performing R&D activities in previous surveys. |
||||||||||||||||||||||||||||||||||||||
| 18.1.2. Sampling design | ||||||||||||||||||||||||||||||||||||||
The total number of initial strata for 2018 data is 3,363 (3*59*19), including empty strata. Due to the coordination of the R&D and the Innovation Survey mentioned before, the final sample is obtained by adding up two sets of enterprises: 1) First, the set of all enterprises that have potentially carried out R&D activities in the reference year (i.e the enterprises contained in the DIRID). 2) Second, a stratified-sample of enterprises from the Central Businesses Directory (DIRCE) (where the enterprises in the 1) set have been previously removed) obtained from the crossing the following variables: a) Size of the enterprise: The following intervals are considered, depending on the number of employees: 10 to 49 50 to 199 200 or more employees The strata constituted by companies with 200 or more employees has been analyzed exhaustively. b) Main activity according to CNAE-2009: The 59 divisions or activity groups enumerated in Table 1. c) Autonomous Community where company headquarter is located. Annexes: Table 1 |
||||||||||||||||||||||||||||||||||||||
| 18.1.3. Target population and sample size | ||||||||||||||||||||||||||||||||||||||
|
||||||||||||||||||||||||||||||||||||||
| 18.1.4. Data source for pre-filled variables | ||||||||||||||||||||||||||||||||||||||
Variables and indicators filled or prefilled from other sources.
|
||||||||||||||||||||||||||||||||||||||
| 18.1.5. Data source and variables used for derivation and weighting | ||||||||||||||||||||||||||||||||||||||
|
||||||||||||||||||||||||||||||||||||||
| 18.2. Frequency of data collection | ||||||||||||||||||||||||||||||||||||||
According to the Commission Regulation (UE) 995/2012, the innovation statistics shall be provided to Eurostat every two years in each even year. The data collection takes place every second year in year t-2 preceding the data provision. |
||||||||||||||||||||||||||||||||||||||
| 18.3. Data collection | ||||||||||||||||||||||||||||||||||||||
See below. |
||||||||||||||||||||||||||||||||||||||
| 18.3.1. Survey participation | ||||||||||||||||||||||||||||||||||||||
Due to the inclusion of the Innovation Survey in the National Statistical Plan, it is considered as a statistic of obligatory compliance, and as a result, non-responding enterprises can be economically fined. |
||||||||||||||||||||||||||||||||||||||
| 18.3.2. Survey type | ||||||||||||||||||||||||||||||||||||||
The survey is collected by a combination of census and sample survey, as the Innovation surveys is collected combined with the R&D survey for Business sector. |
||||||||||||||||||||||||||||||||||||||
| 18.3.3. Combination of sample survey and census data | ||||||||||||||||||||||||||||||||||||||
As the Innovation and the R&D survey are carried out together, enterprises that are part of the DIRID (register of national enterprises with R&D activities or potentially R&D performers) as well as part of the frame population of the Innovation survey, are included in the sample. Those enterprises included in the DIRID are studied exhaustively. Taking account of this group of enterprises already selected and the frame population, a sample is extracted from the DIRCE (official, up-to-date, statistical business register) by crossing the following variables: size, economic activity and NUTS. In every stratum, a systematic selection randomly started is executed, sorting out the enterprises by size and location. The categories of the variables used to stratify are: |
||||||||||||||||||||||||||||||||||||||
| 18.3.4. Census criteria | ||||||||||||||||||||||||||||||||||||||
Enterprises that are part of the DIRID (register of national enterprises with R&D activities in previous surveys or are potentially R&D performers) are studied exhaustively. Besides, enterprises with 200 or more employees are studied through a complete enumeration. |
||||||||||||||||||||||||||||||||||||||
| 18.3.5. Data collection method | ||||||||||||||||||||||||||||||||||||||
Data collection method
|
||||||||||||||||||||||||||||||||||||||
| 18.4. Data validation | ||||||||||||||||||||||||||||||||||||||
Not requested. |
||||||||||||||||||||||||||||||||||||||
| 18.5. Data compilation | ||||||||||||||||||||||||||||||||||||||
Operations performed on data to derive new information according to a given set of rules. |
||||||||||||||||||||||||||||||||||||||
| 18.5.1. Imputation - rate | ||||||||||||||||||||||||||||||||||||||
Imputation is the method of creating plausible (but artificial) substitute values for all those missing. Definition of imputation rate: Imputation rate (for the variable x) (%) = 100*(Number of replaced values) / (Total number of values for a given variable) Definition of weighted imputation rate: Weighted imputation rate= 100*(Number of total weighted replaced values) / (Total number of weighted values for a given variable) |
||||||||||||||||||||||||||||||||||||||
| 18.5.1.1. Imputation rate for metric variables | ||||||||||||||||||||||||||||||||||||||
Imputation rate for metric variables by NACE categories and for enterprises with 10 or more employees:
(1) = Total turnover in the last year of the reference period (t) (TUR) (2) = Share of the turnover in the last year of the reference period (t) due to new or improved product new to the market in the total turnover for product innovative enterprises TUR_PRD_NEW_MKT/TUR(INNO_PRD) (3) = R&D expenditure performed in-house (EXP_INNO_RND_IH) |
||||||||||||||||||||||||||||||||||||||
| 18.5.2. Weights calculation | ||||||||||||||||||||||||||||||||||||||
Weights calculation method for sample surveys
Annexes: Estimators |
||||||||||||||||||||||||||||||||||||||
| 18.6. Adjustment | ||||||||||||||||||||||||||||||||||||||
No calibration method has been used. |
||||||||||||||||||||||||||||||||||||||
| 18.6.1. Seasonal adjustment | ||||||||||||||||||||||||||||||||||||||
Not requested. |
||||||||||||||||||||||||||||||||||||||
|
|||
|
|||
|
|||
| Spanish innovation survey- final results 2018 Spanish innovation survey- national questionnaire 2018 Spanish innovation survey- general methodology 2018 Spanish innovation survey- standardised methodological report 2019 (same 2018) |
|||