|
 |
|
| For any question on data and metadata, please contact: Eurostat user support |
|
|||
| 1.1. Contact organisation | Instituto Nazionale di Statistica - ISTAT National Statistical Institute of Italy - ISTAT |
||
| 1.2. Contact organisation unit | Direzione centrale per le statistiche sociali e il welfare Dipartimento per la produzione statistica Director for social statistics and welfare Statistics Production Department |
||
| 1.5. Contact mail address | Via Cesare Balbo, 16 – 00184 Rome, Italy |
||
|
|||
| 2.1. Data description | |||
The SES 2018 is based on the Council Regulation (EC) No 530/1999 concerning structural statistics on earnings and on labour costs and on the Commission Regulation 1738/2005. This quality report is compiled in accordance to the Commission Regulation 698/2006. The SES allows to produce comparable information on relationships between the level of remuneration, individual characteristics of employees (sex, age, occupation, length of service, highest educational level attained, etc.) and of their employer (economic activity and geographic location of the local unit; size of the enterprise). The target population is composed by all the enterprises and institutions belonging to the Private and Public sectors with at least 10 employees in the NACE Rev. 2 sections B to S. As for the previous edition, Italy provided also data related to section O (even if the extension to this section is still considered optional). |
|||
| 2.2. Classification system | |||
Statistical classification of economic activities in the European Community. NACE Rev. 2. International Standard Classification of Occupation ISCO -08 International Standard Classification of education ISCED 2011 Five size categories are distinguished: 10 to 49 employees, 50 to 249 employees, 250 to 499 employees, 500 to 999 employees and units having at least 1000 employees. Nomenclature of Territorial Units for Statistics (NUTS) - NUTS 1 level |
|||
| 2.3. Coverage - sector | |||
Enterprises and institutions belonging to the Private and Public sectors with at least 10 employees in the NACE Rev. 2 sections B to S. |
|||
| 2.4. Statistical concepts and definitions | |||
The variables provided follow the implementation rules for structure of earnings statistics in the “Structure of Earnings Survey 2018: Eurostat’s arrangements for implementing Council Regulation 530/1999 and Commission Regulations 1916/2000 and 1738/2005”. In particular, the variables provided are related to individual characteristics of employee (sex, age, occupation in the reference month, highest level of education and training, contractual working time, length of service in the enterprise, type of employment contract); to working time (number of hours actually paid during the reference month, number of overtime hours paid in the reference month, annual days of holiday leave), and to information on earnings (gross earnings in the reference month and year, annual bonuses and allowances not paid at each pay period, earnings related to overtime, special payments for shift work). |
|||
| 2.5. Statistical unit | |||
Employees and enterprises/institutions. |
|||
| 2.6. Statistical population | |||
The population of employees covered in the SES are those who received remuneration for the reference month (October), as requested by the Regulation, in the enterprises and institutions belonging to the Private and Public sectors with at least 10 employees in the NACE Rev. 2 sections B to S. |
|||
| 2.7. Reference area | |||
Data cover the entire country and aggregate estimates are disseminated at national level and NUTS 1 level. |
|||
| 2.8. Coverage - Time | |||
The reference year is 2018 and the reference month is October. |
|||
| 2.9. Base period | |||
Not applicable. |
|||
|
|||
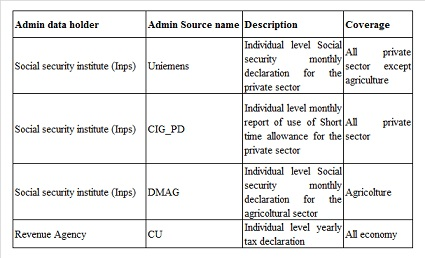
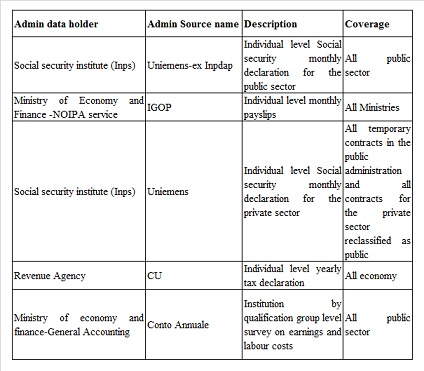
The statistical processes for the Private and Public sectors are quite different. For the Private sector, since SES 2014 edition, data from a direct statistical survey were combined with administrative sources in all major phases of the survey production process. The statistical process of the Public sector, on the other hand, was completely based on an intensive use of administrative and register data. In what follows, brief explanations of both are reported. Registers and administrative data The considerable progresses in the availability and use of Administrative data in the statistical production occurred over the last years in Italy is allowing the construction of a new Integrated System of Registers. Within it, the Labour Register (LR)- a micro level database with a Linked Employer Employee Database (LEED) structure with multiple information on labour activities,-will be at the heart of labour statistics. The Labour Register (LR) development in recent years has greatly enhanced the labour statistics either due to the production of output directly or by constituting a coordination framework able to provide a much greater coherence to the entire system for labour statistics. The setting up of such a register in Italy is extremely demanding as it is based on a plurality of administrative sources (see tables 3.1.1 and 3.1.2). The backbone of the system are the Social Security Institute (INPS) data and among them the UniEmens declarations. Moreover, the tax declarations, especially those submitted by the economic units for their workers (the new CU declarations) will be introduced both to guarantee a better coverage in term of units (e.g. is needed to ensure the coverage of not dependent jobs under an income threshold) and additional variables (e.g. those related to taxation and net income). In addition, the Ministry of Economy and Finance provides data on the composition of earnings and social security contributions, necessary for public sector estimates. For the production of SES 2018 two main registers (which can be viewed as subsets of the whole LR) have been used: for the private sector RACLI (which was also used for the 2014 edition of SES) and for the public sector LR-public. Table 3.1.1. Main sources for RACLI register
Table 3.1.2. Main sources for LR-public register
The availability of an employee level register has triggered, since the 2014 edition, a new sampling design compared to the previous editions. A more detailed explanation of the sampling scheme and of the calibration procedure is reported in the section on accuracy. The data derived from the RACLI and LR-public registers referred to earnings and hours do not provide all the information requested by the SES regulation. Thus, it has been necessary to complement them with other sources. Some sources have provided information either for the Private sector or for the Public sector. The level of education, at individual level, has been derived from the latest Census Information updated with data obtained by the Ministry of Education. Information at economic unit level (NACE, size class, group membership, economic control) have been derived from the system of Business Registers (ASIA, Public Institution Register, ASIA groups). For the rest of the information required by the SES regulation while the process of private sector has required a direct survey, the process of public sector has used only administrative sources and statistical methods.
|
|||
| 3.1. Source data | |||
The statistical process for the Private sector The survey for the private sector is a mixed register-sample survey process. In fact, thanks to the availability of the RACLI wage register an earlier version of the LR on the private sector, the Structure of Earnings Survey 2018, in the wake of what has already been done for the SES 2014 edition, has been designed introducing several solutions to allow a mutual integration between survey and register. In this approach the register data assists the survey in some phases of the process, and the survey’s results can be used to check the register data and provide details not available in the Register. The design of the process, therefore, was modelled also taking into account the timing of the availability of the register. Following the scheduled availability of Social Security data, the RACLI register is available as a provisional version in the autumn of year t+1 and, as a final version, in the spring of year t+2. So the provisional version was used for sampling, for prefilling the variables of the questionnaire and for checks during the data collection phase, while the final version was used for the post collection editing and imputation, including the imputation of non-responses, for calibration of the survey weights to known totals and for validation of the data. Moreover, the final data are used to evaluate comparatively the variables available in the register and those collected through the survey particularly to evaluate definitional issues. This approach was guided, since SES 2014 edition, by two main principles: the reduction in response burden, both the sample and the questionnaire were designed to obtain this objective, and the increase in the data quality, as it will be seen in the following paragraphs. The statistical process for the Public sector The public sector data is derived only from available registers and data sources. Referring to the economic units the frame list is built starting from the Public Institution register referred to 2018. Within the Education sector a complete list of schools has been compiled using the LR-public register. The data at the individual level on the core variables are derived for all employees from the LR-public register. The source that has been essential in providing SES-specific information is the IGOP payslip data. Processed by the service NOIPA of the Ministry of Economy and Finance, it provides detailed information on the composition of earnings (base salary, overtime payment, allowance, etc.) and social security contributions. However this source does not cover the entire public sector but only the personnel of the Administrations associated to NOIPA (basically the Ministries accounting for about 1.6 million of employees out to about 3.5 million total) The variables not available from the sources of the register, for all workers or for part of them, are obtained through statistical methods of imputation (e.g overtime hours, overtime earnings, earnings related to shifts) or by transcoding information available in the sources (e.g. occupation). The entire process is performed on the population of public employees. From it, a sample of employees is selected to provide the necessary file of microdata (see. Accuracy section). |
|||
| 3.2. Frequency of data collection | |||
The data collection occurs every four years. |
|||
| 3.3. Data collection | |||
The data collection phase has involved, as just mentioned, only the private sector, and consists of a very articulated survey process, managed through a detailed calendar, built around a Centralized data collection System the “Business statistical portal” and a dedicated Contact Center (CC) for inbound and outbound services involved to provide assistance to respondent units. The Business Statistical Portal operational since 2014, is a single entry point for Web-based data collection from enterprises which allows to organize the business surveys, optimizing the management and the control of the entire data collection process. The Portal is structurally designed in different specific areas and all the instruments useful for surveys are available inside the same environment. The portal covers the main functions of the entire data collection process: the Survey unit list management, the data collection management, the questionnaire, the communication facilities. The data have been gathered mainly through a Web-based questionnaire (CAWI ), the enterprises involved in the survey have to access to the questionnaire by portal through user IDs and passwords. Respondents can receive assistance in compiling the questionnaire by toll-free number and other asynchronous channels managed by the CC operators. In order to allow the operators to manage opportunely the assistance, Istat experts carried out specific training on both technical and thematic aspects of the survey. Furthermore, CC operators have been provided with detailed FAQs and instruction manual to be used during the contact with the respondents. In particular, during the inbound service, the CC provides assistance to compilers in the registration and navigation of statistical Portal, as well as on the general questions concerning the survey's content and on the most frequent issues. The instances more specific and complex not solvable by the CC are forwarded to Istat subject matter experts through a specific tool - the shared agenda. An outbound service was carried out before the end of the data collection period to re-contact the most relevant non-respondent units. The questionnaire design The questionnaire design of the survey's 2018 edition was guided by the same principles of the SES 2014 edition: to reduce the respondent burden by taking advantage of the availability of the employee-level register on wages (RACLI) and the other registers above mentioned. The variables available from these Registers able to satisfy the regulatory requirements are not included in the questionnaire while the core variables are prefilled. The respondents can correct the prefilled data if they notice errors and compile the sub items to provide the information not available in the Register. Thus variables not available in the admin data and items needed to reconstruct the statistical definition starting from the administrative one are included in the questionnaire. In this way the questionnaire does not request, at firm level, variables such as geographical location of the local unit in which the worker is employed, economic activity, and the enterprise size and, at the employee level, information on sex, age and the number of paid weeks in the year. Contractual working time, share of full-time hours, the number of workable hours in the month, the social security wage for the month of October and for the entire year are have been prefilled, and other variables not available in the Register, such as overtime hours and earnings and special payments for shift works, have been added to the questionnaire. The electronic questionnaire was composed, for each respondent enterprise by so many modules to compile as the number of sampled employees. To reduce measurement errors, in addition to traditional post-data-collection editing, the web-based questionnaire (CAWI) had built in checks (first level checks) that were tested before the data collection period. The questionnaire could not be submitted before all the values provide were congruent with the built in checks. More in detail, error messages accompanied by a red icon and an item number indicated an incorrect value. The icon was displayed directly near either the incorrect item and clicking on it a message explaining the kind of error appears near the incorrect value. An orange icon with an exclamation mark was used to signify soft errors. This kind of edits only notify users that an item should be assessed for its adequacy. In this case, the respondent could confirm or correct the value. The questionnaire could be submitted only if all errors with red icons were solved. The edit failures were shown at the end of the questionnaire after correcting also any edit, the list would reappear without the edit just corrected. In addition to the web questionnaire that requested to insert the data manually, the firms with a high number of employees could prepare a data file in a format compliant with the questionnaire structure, allowing them to extract the data from their business database and rearrange them in accord to the standard requested. The file, then had to be uploaded into the system and the respondents were asked to check data against the questionnaire built in rules. |
|||
| 3.4. Data validation | |||
Editing and imputation procedures In the editing and imputation procedures the RACLI data are used in several ways. In the data of respondents they have been used for: the edit rules that imply the consistency between a core component (from the register) and a sub-component (from the survey); the formation of more homogenous edit groups; and, providing the matching variables in the minimum distance imputation. For the non respondents, the register variables represent as the basis of the questionnaire. For all these reasons the private sector survey can be defined an “administrative data assisted survey”. For detail on measurement errors, see concept 6.3.2. The public sector data are total data since only admin based. |
|||
| 3.5. Data compilation | |||
The design weights depend on the two stage procedure for sampling (see sampling error). Thus the final design weight is the multiplication of a fist stage weight at the level of enterprise (institutional unit for the public sector) and a second stage at the level of employee. After the editing and the imputation phase only the subsample of workers paid for the entire month of October has been reweighted using known totals from the employees registers. The direct weights have been calibrated to reproduce the totals of the number of jobs, the number of paid hours, and earnings for the population of workers paid for the entire month of October. The calibration groups are formed by crossing sectors of economic activity (somewhat in between the division and sections of NACE rev2) and the sex of the worker with, alternatively, the size class of the enterprise, the NUTS1 region where the employee works, age of the worker in classes, the working time and ISCED groupings. The totals of the variables are mainly derived from the RACLI and RL-public registers respectively for the private and public segments of the population. This procedure also has allowed to calculate weights that produce estimates aligned with the final version of the register, since at the time of the sampling selection, only a provisional version of the RACLI register was available. |
|||
| 3.6. Adjustment | |||
Not requested. |
|||
|
|||
| 4.1. Quality assurance | |||
SES is based on the standard Istat systematic approach to quality following the International and European standards. Istat reference framework for quality policies relies on the European Statistics Code of Practice, adopted in 2005, revised in 2011 and, more recently, in November 2017 on Eurostat Quality Definition and on the recommendations of the Legislation on Quality, approved by the Members States of the European Union in 2001. The Data Quality Assessment Framework, developed by the International Monetary Fund, also represents an important reference, especially for economic statistics and for National Accounts. Following the principles of the European Statistics Code of Practice, Italy has adopted the Italian Code of Official Statistics, O.G. n. 240 of 13/10/2010, in order to promote quality improvements of the statistics produced by the Italian National Statistical System (more details at the link: https://www.istat.it/en/organisation-and-activity/institutional-activities/quality-commitment ). The Quality Committee, set up in 2010, is a high level body in charge of quality monitoring and quality auditing of statistical processes and products. Quality auditing and self-assessment are aimed at verifying the compliance of statistical processes and outputs to the principles stated in the Quality Guidelines. |
|||
| 4.2. Quality management - assessment | |||
Quality monitoring is based on the analyses of standard quality indicators, also managed in the Information System for Survey Documentation and Quality Control (SIDI/SIQual). Both qualitative information and quality indicators related to each single phase of the production process are managed. Regular reports to the top management on process quality are prepared also by analyzing information from the SIDI/SIQual system. Quality pilots, trained in process documentation and quality evaluation, are in charge of updating information and calculating standard quality indicators at process level. Starting from 2016, all ESS quality reports published at International level are published in SIDI/SIQual system, in particular under the section Labour and Wages there can be found the Structure of Earnings survey ones. The overall quality of the Italian SES can be considered good.
|
|||
|
|||
| 5.1. Relevance - User Needs | |||
The main users of the Structure of Earnings Survey data in Italy and abroad can be classified as follows: -National (internal) users:
-International users: Eurostat, International Labour Organisation, International Monetary Fund, United Nations Economic Commission for Europe
|
|||
| 5.2. Relevance - User Satisfaction | |||
At the moment, Istat collects no data on the level of satisfaction, gaps and redundancies in the information provided. |
|||
| 5.3. Completeness | |||
All the mandatory variables required by Eurostat regulations were provided. |
|||
| 5.3.1. Data completeness - rate | |||
100%. All data requested were transmitted to Eurostat. No missing values |
|||
|
|||
| 6.1. Accuracy - overall | |||
The sample of the private sector has been studied to be representative of the population of workers active even for very short periods of the year 2018. In this way the sample fulfills, on one side, the requirements of the SES regulation that requests data only for the workers paid for the entire month of October and, on the other side, produces auxiliary information for the Register also for workers present in other subperiods of the year. |
|||
| 6.2. Sampling error | |||
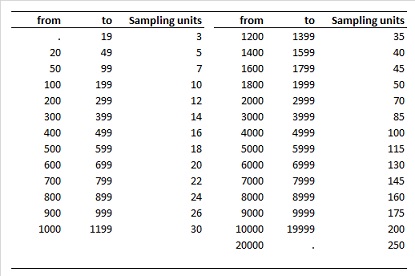
The sampling design for the SES 2018 survey is a two-stage sampling, separately performed for the private sectors and for the public sector. In the fllowing it is described the design for the private sector. The design for the public sector mimic it closely. In the first stage, the enterprises are selected within strata obtained by crossing 2 digit Nace sectors, size classes and NUTS1 regions. The enterprises with at least 250 employees belong to take all strata and have been selected with certainty. For the remaining enterprises the allocation has been performed using the Bethel multivariate technique that determines the optimal number of units per strata by minimizing the expected error of given target variables. In this case the driving variables used for the allocation are the enterprise average of the hourly wage and the total wage paid to each worker respectively in October and in the Year. The allocation has been obtained by constraining the precision of the estimates of these target variables to a maximum CV of 2.6% per estimation domain. The sampled enterprises are 22,099 out of the 189,123 enterprises with at least 10 employees contained in the Business Register ASIA (provisional version available at July 2018). In the second stage, a fixed number of employees was selected depending on the size of the enterprise as shown in the following table. Table 6.2.1. Number of selected employees by size of the enterprises
The above total number of sampled employees was split up into groups, within each enterprise, defined by Nuts1 localization of worker, working time (Full-time/part time), occupation (Blue collar/white collar), maintaining the proportion of the enterprise workforce. Here small adjustment to the sample size was made to ensure that each strata had at least one employee. The overall second stage sample size has been of 225942 sampled employees who were paid at least one hour in 2018. Of that number about the 70% was paid in October. The final sample of workers that have been paid for the entire month of October, resulting after the E&I stage, is 141138 out of 7598171 in the population. The sample of employees for the public sectors has been planned to mimic the design of the private sector resulting in a sample size of 107645 workers out of 3270749 in the target population. |
|||
| 6.2.1. Sampling error - indicators | |||
Coefficient of variation (CV) is value, of which the denominator is estimate of indicator and of which the numerator is standard error. Coefficients of variation (CV) concerning total gross earnings in the reference month and average gross hourly earnings in the reference month are broken down by:
Please refer to the attached document Coefficients of variation.
Table 6.2.1.1. Sampling errors for selected domains
Annexes: Coefficients_of_variation_ses2018 |
|||
| 6.3. Non-sampling error | |||
See below. |
|||
| 6.3.1. Coverage error | |||
The employees of the private businesses and institutions and public institutions with at least 10 employees belonging to the section B-S Nace Rev. 2 define the target population on which the survey has been designed. Including the section O. As mentioned in the previous paragraphs, since the public sector data are register based, there is no list or coverage errors by definition. As for the private sector, although a direct survey was issued, no information related to the target population (economic activity sector, size of the firm, status of employees) was asked to the firms, since in this framework this kind of information from the register are reputed the most reliable. The only causes of coverage errors may arise since the sampling frame is a provisional frame. However the differences due to the updating of the frame are negligible. Moreover, since the weights of the sample are calibrated to the final version of the frame, any possible misalignment between the selected sample and the final frame should be adjusted with the reweighting procedure. |
|||
| 6.3.1.1. Over-coverage - rate | |||
For the type of statistical process used it is considered that the data has no over-coverage. |
|||
| 6.3.1.2. Common units - proportion | |||
Not requested. |
|||
| 6.3.2. Measurement error | |||
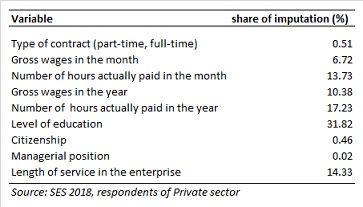
Measurement errors are defined as errors occurring at data collection time, while processing errors are those occurred in post-data-collection processes. While little information is gathered on processing errors some considerations can be drawn on measurement errors. First, we define measurement errors those considered such by our Editing and Imputation procedures. As above sketched, as for the public sector, all variables have been derived from registers directly or through estimation methods. In this section thus the focus is on the private sector. However since also the SES 2014 for the private sector is a mixed Register-Survey process it is important to describe how the editing process has been carried out. For the private sector most of the variables have been derived from the RACLI register. Some of them have been used to prefill the questionnaire and could be modified by the respondent. The variables not available in the registers have been moreover added to the questionnaire. All the variables, even those derived from the register, have then been passed to the editing and imputation procedures and edited when considered incorrect. Then the variables requested from the Regulation were obtained by adding and/or subtracting items. This implies that some of the target variables, those on total earnings and hours paid, are composed from a part derived from the register and a part derived from the questionnaire. The result of these procedures is that there are very different item imputation rates among the variables. In particular, the variables with the highest imputation rates are those completely not available in the register or those composed partially from the register and partially through the survey, since it is on them that the imputation of non respondents impact. However for the second group, since the part not available from the register is very small compared to the total, the imputation usually change the requested variable only slightly. In detail, in editing and imputation procedures used for the private sector the RACLI data play an important role. The private sector survey can be defined an “Admin data assisted survey”. RACLI data are used in several ways, limited to the respondents: - to supply the values applied in the edit rules to guarantee the consistency between the core component (from the register) and a sub-component (from the survey), - to build homogeneous edit groups, - to provide the matching variables in the minimum distance donor imputation. As concern the first item, the comparison between survey data and RACLI data represents the instrument for detecting and possibly correcting the former through deterministic rules. Whenever the prefilled values were changed by the respondents a first deterministic procedure is used to verify and correct the data against the RACLI values. In particular the procedure assesses: 1) the accuracy of the type of contract (full-time, part-time) and its associated share of full-time hours, 2) the precision of the quantitative variables as monthly wages, annual wages, number of workable hours in the month drawn from the survey and to quantify the possibly divergence. The procedure uses measures in level and per-hour data, and in case the survey data are out the chosen limits (cut-off), the Admin data substitute the survey ones and the sub-components are recalculated paying attention to preserve the existing proportion between the survey core variables and their sub-components. 3) the precision of information on individual characteristics of the employee, as level of education, citizenship, managerial position, length of service in the enterprise, and in case of doubt substitute them with Admin data. In most cases the data provided by the enterprise is changed back to the admin data value.
Table 6.3.2.1. Respondents in Private sector: some results on first deterministic imputation with RACLI
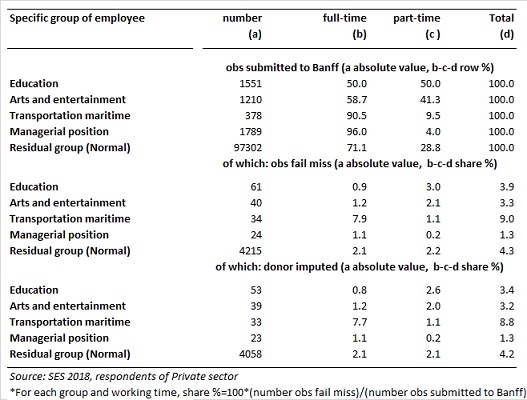
A second probabilistic procedure, built around the BANFF system (Statistics Canada) is used for automated editing and imputation of quantitative data on earnings (e.i. Gross earnings for the reference month and Earnings related to overtime, Gross annual earnings in the reference year, Annual bonuses and allowances not paid at each pay period, Annual payments in kind) and working period (e.i. number of hours actually paid, number of overtime hours paid). To take into account critical differences among the employees, the main edit rules into the system were written distinguishing for specific group of employees (Education, Arts and entertainment, Transportation maritime, Managerial position) respect to the others, and for type of contract (full-time, part-time) and the imputation is run within groups of employees with the same position in the enterprise (white collar/blue collar) and economic activity. The table 6.3.2.2 shows, for each group of employee and type of contract, at the top the value of total observations submitted to Banff procedures (102230 total units) and its row percentage, in the center the value of observation failed each edit and at the bottom the value of observation donor imputed, beside to the incidence on total observations.
Table 6.3.2.2. Respondents in Private sector: some indicators on donor imputation with BANFF
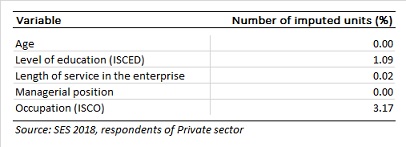
The qualitative variables are submitted to SCIA system for automated editing and imputation of data affected by errors, that applies a generalization of the error localization method of Fellegy and Holt (1976). The variables undergone to the procedure consist of individual characteristic of each employee (age, managerial position, level of education, length of service in the enterprise, occupation according ISCO classification). The table 6.3.2.3. shows the number of imputed units for each variable and the percentage calculated on 102230 total units treated.
Table 6.3.2.3. - Respondents in Private sector: some indicators on probabilistic imputation with SCIA
In this framework, the records for the employees belonging to non respondent enterprises have been compiled on one side from the variables available from the registers RACLI and on the other with values imputed through minimum distance donor methods. All this procedure has been applied to the questionnaire scheme. As the set of core information and the extra information from the subsample (respondents of private sector) have already been edited and imputed and that no consistency edits need to be applied, they are so used to estimate the non respondents. On 142075 total observations of private sector, the share of 28% represents the non respondents. The availability of the set of core information (Gross wages in the month, Gross wages in the year, number of hours paid in the month) for the entire sample drawn from RACLI lets to perform a massive imputation on the non respondents to obtain the extra components. For each group of employees with the same economic activity, position in the enterprise (white collar/blue collar) and type of contract (full-time, part-time), the share between the core variables and their components measured on respondents are donated to the non respondents with a massive imputation from the valid observation that is most similar to it according to matching fields (Gross earnings for the reference month, Gross annual earnings in the year, number of hours paid in the month). |
|||
| 6.3.3. Non response error | |||
For what has been said before non response errors affect only the process for the private sector. Since some of the variables, those derived from the register, are available for the entire sample, the unit response rate assumes the meaning of percentage of non respondents to the direct survey not that of units whose all values must be imputed.
|
|||
| 6.3.3.1. Unit non-response - rate | |||
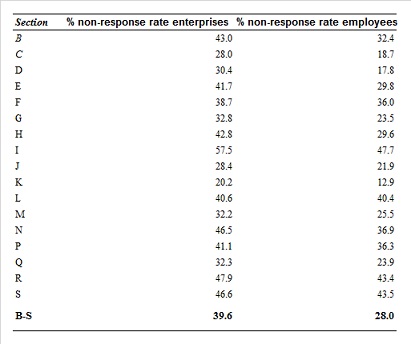
Unit response rates are calculated, following the indication of regulation n. 698/2006 as follows. r=100x (number of in scope respondents / number of in scope sample units) The units in the sample that are deemed in scope are those belonging to the statistical register RACLI with data on the entire population of employees of the private sectors referred to 2018. The non-response rate in terms of enterprises is 39,6%, while in terms of sampled employees is about 28,0%. These non response rates presented are related to employees who received remuneration during the reference month. The results are shown in Table 6.3.3.1. Table 6.3.3.1. Private sector: unit non - response rates in terms of enterprises and employees.
|
|||
| 6.3.3.2. Item non-response - rate | |||
Since the questionnaire could not be sent even if only a single variable was not filled in, there are no item non responses for the respondents and the item non response rates correspond to unit non responses. |
|||
| 6.3.4. Processing error | |||
See below. |
|||
| 6.3.4.1. Imputation - rate | |||
The item imputation rate is calculated as the ratio of values imputed for a specific variable over the total number of values for that variable. For the variable Gross earnings in reference month, code B42 in SES classification, the item imputation rate is 8%. The overall imputation rate is calculated as the ratio of values imputed for any SES mandatory variable over the total values for mandatory variables. Among the 20 variables measured at the level of employees it amounts to 15.1%. |
|||
| 6.3.5. Model assumption error | |||
Model assumption errors may affect editing and imputation rules. The imputation of the records for the employees belonging to non respondent enterprises, have been compiled on one side from the variables available from the the RACLI register and on the other with values imputed through minimum distance donor methods. |
|||
| 6.4. Seasonal adjustment | |||
Not requested. |
|||
| 6.5. Data revision - policy | |||
Not requested. |
|||
| 6.6. Data revision - practice | |||
Not requested. |
|||
| 6.6.1. Data revision - average size | |||
Not requested. |
|||
|
|||
| 7.1. Timeliness | |||
The data first appeared in Eurostat database on 20 November 2020. The length of time between the end of the reference year (2018) and the first publication of data is of 21 months as for the Eurostat release. The pandemic, which has had its effects on Italian society since February 2020, has strongly influenced data collection. Many companies were closed in the period March-May 2020, while those in operation were strongly committed to adapting their activities to this emergency. In many cases the staff involved in compiling the questionnaire worked remotely and had difficulties in accessing the data needed to fill it. Therefore, the survey deadline was postponed by 3 months (from 24 March to 30 June), to allow companies to complete the questionnaires. This led to a data releasing later than in the previous edition. |
|||
| 7.1.1. Time lag - first result | |||
Not requested. |
|||
| 7.1.2. Time lag - final result | |||
Not requested. |
|||
| 7.2. Punctuality | |||
As concerning the fieldwork, data collection period was scheduled from 31 October 2019, to 23 March 2020. During this period, several reminders (8/11/2019; 18/12/2019; 16/01/2020; 25/02/2020) were sent to non-respondent units contacting both by ordinary and certificated e–mail. As regards the EU deadlines, Italy delivered the data on 30 September 2020 with three months delay with respect to the regulation deadline (30 June 2020). This delay was mainly due to a very poor response rate experimented until the first survey deadline (23 March 2020), due to the enterprises closure for pandemic. Further data transmission has been necessary due to review in data subset. |
|||
| 7.2.1. Punctuality - delivery and publication | |||
Not requested. |
|||
|
|||
| 8.1. Comparability - geographical | |||
The SES 2018 complies with the standard set up on the Council Regulation (EC) No 530/1999, concerning structural statistics on earnings and on labour costs, and with the definitions of variables adopted in the Commission Regulation 1737/2005. The sampling unit in the first stage is the enterprises, but the register information allows to localize the worker in the region in which he is employed. |
|||
| 8.1.1. Asymmetry for mirror flow statistics - coefficient | |||
Not requested. |
|||
| 8.2. Comparability - over time | |||
As for the private sector, SES 2018 and SES 2014 survey process is implemented according to the same approach based on the use of register data in all major survey (questionnaire design, sampling and editing & imputation). These principles have guided the questionnaire design, the sampling design, and the procedures of E&I, therefore these two editions should be comparable. These two editions are broadly comparable with the previous 2010 for what concerns large breakdowns on earnings variables, but some of estimates may have some problems of comparability due to the different approach used in SES 2010 edition when registers were not yet available to be used to support the survey. An area in which there might be problems of comparability between 2014 and 2018 is the public sector. Since 2014 the entire process is based on registers and administrative data but in 2018 edition many administrative sources have been added and all the entire process has been reviewed. As in SES 2014 in 2018 edition the hourly earnings (SES code B43) have been calculated, for the employees with a standard monthly payroll (that are the large majority of employees), dividing the monthly earnings (B42) by a measure of the hours that have been calendar adjusted, and not for the number of hours paid in the month (B32). This is allowed by the regulation that requests only that the hourly earnings must be consistent with the ratio of earnings and hours, not equal to that ratio, and compliant with the implementation arrangement 2018 that allows for a discrepancy between the hourly earnings and the ratio of earnings and hours of up to +-10%. At the same time this way of providing the data is a) compliant with the regulation that states in relation to the Number of hours actually paid during the reference month that “What is required here is the number of hours actually paid during the reference month, not the number of hours in a standard working month”; b) more respectful of Italian payment system that for the category of employees above mentioned establishes that the monthly earning does not depend on the calendar c) more in line with the spirit of the regulation that requires, according to us, a hourly earning that should not be dependent on the calendar. |
|||
| 8.2.1. Length of comparable time series | |||
Not requested. |
|||
| 8.3. Coherence - cross domain | |||
Not requested. |
|||
| 8.4. Coherence - sub annual and annual statistics | |||
Not requested. |
|||
| 8.5. Coherence - National Accounts | |||
This paragraph reports on the comparisons between the SES variable ‘Gross annual earnings in the reference year’, expressed per employee, and the National Account variable ‘Wages and salaries’ per employee in 2018. The NA figures are those reviewed in September 2020 and released officially on I.STAT Data Warehouse. The data are shown by NACE Rev 2 Section in the table 8.5.1. Wages and salaries presents values lower than Gross annual earnings in almost all the Nace sections. The main reason is the difference in definitions and coverage (all the enterprises in NA; enterprises with 10 and more employees in SES). Being the remuneration increasing with enterprise size, SES estimates appear higher in almost all NACE sectors. A further factor explaining the difference in favour of SES is the fact that the NA statistics include also irregular employees which have compensation much lower than regular employees. Another reason could be that the reference population in SES variables is related to employees that have actually received remuneration in the reference month while NA estimates are related to all employees included less steady ones with lower remunerations.
Table 8.5.1. – Gross annual earnings in the reference year (SES) and wages and salaries per employee (NA). Compensation of employees per employee: NA vs SES. Year 2018
|
|||
| 8.6. Coherence - internal | |||
Not requested. |
|||

|
|||
Each data release and report publication respect a clear and understandable form, supported by metadata and guidance. All information is available and accessible on an impartial basis. A national release of aggregate data on 2018 is scheduled to be published by April 2021. As for the micro data they will be released, anonimyzed, by Eurostat as SES scientific use files. Moreover access to confidential data will be ensured through the Eurostat Safe center. Similar accesses will be ensured at national level, by Istat. No results will be sent back to responding units included in the sample. |
|||
| 9.1. Dissemination format - News release | |||
Not requested. |
|||
| 9.2. Dissemination format - Publications | |||
The online dissemination of the main results of SES 2018 will be available on the ISTAT website. The report will be published by April 2021, compatibly with the schedule of ISTAT publications currently being updated. |
|||
| 9.3. Dissemination format - online database | |||
Italian data provided to Eurostat are available from 20 November 2020 on the Eurostat Database – section Population and social conditions – Labour market – Earnings https://ec.europa.eu/eurostat/data/database |
|||
| 9.3.1. Data tables - consultations | |||
Not requested. |
|||
| 9.4. Dissemination format - microdata access | |||
The Italian SES unanonymised microdata (secure use files) can be accessed via the Safe Center at Eurostat's premises in Luxembourg as soon as available. At Istat, the microdata will be available to scholars through the ADELE secure Research Data Centre https://www.istat.it/en/information-and-services/researchers/laboratory-for-elementary-data-analysis. The rules of access to the laboratory for data analysis may vary according to collective health protection measures. Furthermore, the microdata for a subset of variables (usually the variables provided to Eurostat) will be available in a repository of the Institute, called ARMIDA. Institutions belonging to the national statistical system can acquire these data because of a substantiated request. Independent researchers or other scholars may request anonymous micro-data by submitting a research project and by signing a declaration of commitment on the correct use of the data in compliance with statistical confidentiality. |
|||
| 9.5. Dissemination format - other | |||
No results are sent back to reporting units included in the sample. |
|||
| 9.6. Documentation on methodology | |||
Every way of diffusion of data, above mentioned, includes the proper information on the metadata and on the methodological scheme and the glossary of every definition implemented by the survey. Information about the survey is available on the ISTAT website at the address https://www.istat.it/it/archivio/204531 |
|||
| 9.7. Quality management - documentation | |||
The availability of this quality report is advertised in the methodological note published by Eurostat with the first publication of the data. Furthermore, the Italian SES quality report, sent to Eurostat, can be found at the Survey Quality Documentation System (SiQUAL) http://siqual.istat.it/SIQual/lang.do?language=UK
|
|||
| 9.7.1. Metadata completeness - rate | |||
Not requested. |
|||
| 9.7.2. Metadata - consultations | |||
Not requested. |
|||
|
|||
Not requested. |
|||
|
|||
|
|||
| 11.1. Confidentiality - policy | |||
Not requested. |
|||
| 11.2. Confidentiality - data treatment | |||
Not requested. |
|||
|
|||
Improvements proposed for Structure of Earnings Survey 2022 Further development in exploiting both administrative and fiscal sources, is planned for the next edition. The aim is to optimize the integration of other sources in order to achieve as much information as possible on the available information on the economic variables, from administrative and fiscal data. This project would imply the strong reduction of the statistical burden on the units and of the cost of the data collection and processing. |
|||
|
|||
|
|||