|
 |
|
| For any question on data and metadata, please contact: Eurostat user support |
|
|||
| 1.1. Contact organisation | National Institute for Statistics and Economic Studies (Insee) |
||
| 1.2. Contact organisation unit | DIRECTORATE OF DEMOGRAPHIC AND SOCIAL STATISTICS Department for Employment and Working Income Wages and Earned Incomes Division
|
||
| 1.5. Contact mail address | TIMBRE DG75-F240 - 88 avenue Verdier – CS 70058 – 92541 MONTROUGE CEDEX - FRANCE |
||
|
|||
| 2.1. Data description | |||
The 2018 Structure of Earnings Survey, hereinafter also referred to as SES 2018, the results of which were submitted to Eurostat by INSEE on 31 July 2020 in the form of a provisional version, followed by a final version on 13 November 2020, was the result of the concatenation of the data from the annual Structure of Earnings Surveys (SES) from 2017 and 2018, following an update to the financial information gathered in 2017 to ensure that they were representative of 2018. These annual surveys cover the private sector, the public hospital service, and the national civil service. In addition to these two surveys, (SES 2017 and SES 2018), an additional survey, conducted among State civil service employees (FPE 2018), was provided for 2018. This survey, therefore, supplements the coverage of the SES, allowing section O (public administration) to also be covered; an area that remains optional according to the above-mentioned EU regulations, but which is to be included according to the implementation guidelines: “Structure of Earnings Survey 2018; Eurostat’s arrangements for implementing the Council Regulation 530/1999, the Commission Regulations 1916/2000 and 1738/2005”. |
|||
| 2.2. Classification system | |||
The nomenclature used is that indicated in the guidelines for the implementation of the regulation concerning the structure of earnings statistics: “Structure of Earnings Survey 2018; Eurostat’s arrangements for implementing the Council Regulation 530/1999, the Commission Regulations 1916/2000 and 1738/2005”.
|
|||
| 2.3. Coverage - sector | |||
The coverage of the survey extends to the employees and establishments of companies with at least 10 employees that are based in France (excluding Mayotte) in sections B to S of the economy according to the NACE rev 2 classification.
|
|||
| 2.4. Statistical concepts and definitions | |||
The concepts and definitions of the variables follow the guidelines for the implementation of the regulation concerning the structure of earnings statistics: “Structure of Earnings Survey 2018; Eurostat’s arrangements for implementing the Council Regulation 530/1999, the Commission Regulations 1916/2000 and 1738/2005”. |
|||
| 2.5. Statistical unit | |||
The statistical units are the establishments (also known as “local units”) and the employees.
|
|||
| 2.6. Statistical population | |||
The file for the SES 2018 survey (SES 2017 and 2018, FPE 2018) contains records relating to 39,163 establishments and 256,600 employees who responded to the survey. |
|||
| 2.7. Reference area | |||
The reference population is comprised of employees who received positive remuneration in 2018 during a reference month. In the case of France, the reference month is an average month during the year. |
|||
| 2.8. Coverage - Time | |||
see 2.6 |
|||
| 2.9. Base period | |||
Not applicable.
|
|||
|
|||
| 3.1. Source data | |||
Sources The SES 2018 survey is based on the following sources: the annual Structure of Earnings Surveys (SES 2017 and SES 2018), the four-yearly supplementary survey of State civil service employees (FPE 2018) and comprehensive administrative sources.
The SES 2017 and 2018 surveys The SES are annual surveys, conducted during the first two years of the four-yearly cycle of the ECMOSS scheme (Enquête sur le Coût de la Main d’Œuvre et la Structure des Salaires: two annual “SES” surveys on wage structure conducted during the first two years, followed by two annual “ECMO” surveys on labour costs conducted during the following two years). These surveys cover the establishments and employees in the private sector, the public hospital service and the national civil service. Supplementary Survey on the State Civil Service 2018 (FPE 2018) In order to provide the full coverage requested by Eurostat, in 2019, INSEE conducted a survey among those employed in the State civil service in 2018. The majority of these employees work in education (section P) and public administration (section O), and to a lesser extent in human health and social work activities (section Q). Administrative Sources The comprehensive administrative databases serve both as a sampling frame for the surveys and as sources of information to complement the surveys, which reduces their burden. The following databases are used: Nominative Social Declarations (Déclarations Sociales Nominatives – DSN): these declarations replace the Annual Social Data Declarations Déclarations Annuelles de Données Sociales – DADS) in the private sector. They concern all employees within the company who receive a salary or a wage, regardless of the amount or how long they have been employed, and are intended primarily for use by social security bodies and the tax authorities. The social security bodies use them to calculate certain contributions due from employers, to check that all contributions have been paid and to identify employees’ entitlements to pensions and health insurance. INSEE is also an official recipient of these declarations for the purpose of compiling a statistical file. The statistical file is established by INSEE on the basis of these declarations, after performing some checks – most notably of their integrity, statistical formatting (concepts), statistical checks and adjustments. The System for Information on Civil Servants (Système d’Information sur les Agents des Services Publics – SIASP): this comprehensive statistical file is compiled in particular on the basis of the payroll files of employees of the State civil service and the Annual Social Data Declarations (DADS) for the public hospital service and the national civil service. It should be noted that, as is the case for the private sector, the DSN will replace these sources in the public sector, but at a later date (between 2020 and 2022). The SIASP system is the reference source used to measure the number of employees, payrolls and hours paid in the public sector. In both the DSN and SIASP, information regarding remuneration serves as a basis for tax and social security calculations. Considering these challenges, they are considered to be of good quality and indeed are. The DSN and SIASP form the local unit and employee sampling frames for the SES surveys. The sampling frame for State civil servants is established on the basis of SIASP.
The Company Register: The Statistical Business Register (“système d’identification au répertoire des unités statistiques” – SIRUS), a statistical register that establishes a list of all companies and local units (establishments), allows the sample of establishments to be supplemented with information that is not included in the DSN, such as the department and the market or non-market nature of the establishment’s business.
These administrative databases are used upstream of the survey to define the sampling frames at the employee, establishment and company level, as well as to calculate the allocation of the number of establishments and employees to be sampled per stratum (see below). They also provide downstream calibration bases (see 6.3.3) and additional information not requested in the surveys or indeed compared with the survey responses (see point 8).
Sampling
The Sample for the SES 2017 and 2018 Surveys The sampling method used for SES 2017 and 2018 is a stratified two-stage sampling plan, with the 1st stage made up of establishments, then a 2nd stage made up of the employees within those establishments. Both stages involve simple random sampling from within the strata, with guaranteed negative coordination with previous versions of these surveys, as well as with other business surveys conducted recently by the French Official Statistical Service. A new stratification has been developed for the establishment sampling frame in order to limit the dispersion of the weightings through the use of a new breakdown of variables: – the business sector (20 modalities): sections at level 1 of NAF rev. 2, 2008 with section C (Manufacturing) being subdivided into 3 modalities;[1] – company size (5 groups:10-49/50-249/250-499/500-999/1000+); – establishment size (6 groups:1-9/10-19/20-99/100-499/500-999/1000+); – geographical location (14 modalities: new administrative regions established in 2016 – NUTS1, with the overseas departments being combined in a single modality).
The strata correspond to groupings of the intersections of these modalities (groupings established to obtain strata of size higher than a minimum threshold). For the stratification of the employee sampling frame, a manager/non-manager criterion is added. The way in which establishment and employee allowances are calculated has also been changed. Allowances are calculated on the basis of the administrative databases and in accordance with the two-stage surveys conducted according to Neyman’s allocation, subject to constraints: reduction to a minimum of the variance in the average hourly wage estimator (hourly wage calculated as the gross wage observed in the DSN/SIASP relative to the number of paid hours observed in the DSN/SIASP) and subject to constraints. At the 1st stage, a minimum number of establishments to be sampled per stratum is calculated (with the minimum threshold set at 3 establishments), then, at the second stage, a minimum number of employees to be sampled is determined for each stratum. At the employee level, allocation takes place by separating managers from non-managers within each of the previously defined strata. A further constraint (to limit the collection burden on respondents): a maximum of 24 employees may be sampled per establishment. The allocations are calculated separately for the private and public sectors.
Ultimately, for each of the two surveys, SES 2017 and SES 2018, approximately 18,000 establishments were surveyed in connection with 160,000 employees.
Clarifications Regarding the Sampling Frames From Which These Samples Have Been Drawn: For SES 2017, within the scope of the switch to the DSN for the private sector, it was not possible to establish a sampling frame equivalent to those used in previous years (i.e. an annual adjusted database of all employees in post as at 31 December of year N-1 – in this case 2016) in time for the survey. The sampling frame was constructed using data from the DADS 2015 (rather than the 2016 version) for the private sector and SIASP 2016 for the public sector (Public Hospital Service (Fonction Publique Hospitalière – FPH) and National Civil Service (Fonction Publique Territoriale – FPT)); for the employees, those in post as at 31 December were used. Due to the difference in the age of the sampling frame used for the private sector, short-term or recent contracts and employees of recently formed companies were under-represented for the private sector within the sample used for SES 2017 (more precisely, contracts and new companies less than a year old in 2017 were not included in the sampling frame). For SES 2018, the sampling frame for FPH and FPT employees was established using SIASP 2017 (employees in post as at 31 December 2017), and the sampling frame for the private sector was established using a non-adjusted DSN file from December 2017. Short-term contracts and employees of recently created companies were over-represented within the private sector sample for SES 2018, which compensated for their under-representation in the sampling frame used for SES 2017. In addition, the criterion aimed at not including employees identified as having completed periods of ancillary activities in the sampling frame has been adapted to take account of the new source used (DSN) in 2018: observations relating to monthly periods of work amounting to fewer than 10 hours or fewer than 2.5 days are not included in the part of the sampling frame established using the DSN file relating to December 2017.
The Sample for the FPE 2018 Survey The FPE survey covers the whole of metropolitan France and the overseas departments, with the exception of Mayotte. It therefore excludes FPE staff posted abroad, such as embassy staff working in foreign countries. The “historical” overseas departments (Guadeloupe, Martinique, French Guiana and Reunion) have been covered since the previous version of the survey (FPE 2014). The department of Mayotte cannot be integrated into the survey at present due to the impossibility of establishing a sampling frame there that is of sufficient quality (the coverage of the studies and publications based on SIASP is also France excluding Mayotte). The employers covered by the FPE survey are legal units (SIREN) identified as belonging to the State civil service in the SIASP source, which serves as the sampling frame. These are primarily ministries and public administrative establishments, which fall into legal categories 71 to 74 in the French nomenclature of legal categories.
Coverage does not extend to: - military personnel and recruits: insufficient quality of “defence” sources, and in particular the absence of addresses, precludes their inclusion in the coverage of the survey; - elected officials; - FPE civil servants not working on French territory (ambassadors, etc.); - staff paid by the overseas communities; - employees living abroad, in the overseas communities or in Mayotte; - student civil servants; - employees under the age of 15.
The sampling frame for drawing the sample for the FPE survey is therefore established on the basis of SIASP 2017, in which only the principal occupations (activities not considered to be ancillary) of employees active as at 31 December 2017 are retained.
The drawing of the sample is not stratified as such, but the sampling weights are the same as those used for simple, stratified random sampling (with Neyman’s allocation calculated on the basis of paid hours worked) on the intersections of the variables listed below:
i education, higher education and research, sports and youth; ii justice, interior, defence (excluding military); iii economy and finances, industry, labour and employment; iv other ministries (primarily those responsible for ecology, social affairs and agriculture) or national public institutions;
i the ministries responsible for education, higher education and research, sports and youth; ii other ministries or national public institutions (including state ministries and economy ministries).
Sampling is ultimately carried out with the defined sampling weights and balanced according to the Cube method (Deville, J.-C. & Tillé, Y., Biometrika, 2004). Efficient Balanced Sampling: The Cube Method. Biometrika, Vol 91, No 4, pp 893-912) on the (non-crossed) variables listed above, as well as on the gross hourly wage that can be calculated in the administrative source serving as a sampling frame. The sample selected in this manner comprises 33,000 individuals.
Enrichment of Surveys The administrative data from DSN and SIASP are used downstream of the survey to provide additional information (valid for year N for the survey for year N). SIASP is used as the source for the variables relating to remuneration and paid hours for State civil service (FPE) employees. In the case of SES surveys, certain variables from the DSN source, which are also included in the survey questionnaire, are used during the adjustment phase to address partial non-response or to check the quality of the variables. This includes in particular total gross pay, the number of paid hours, the pay period in days and working time. [1]Section C is broken down as follows: the first subdivision comprises divisions 10-12, the second subdivision comprises divisions 19, 29-30, 13-23, 24-25, 31-33, and the third subdivision comprises divisions 27-28. [2]The indeterminate categories (contractors, etc.) are included in hierarchical category B for the purposes of stratification, as there are fewer of them and they are closer to this category in terms of the average hourly wage. |
|||
| 3.2. Frequency of data collection | |||
The supplementary FPE survey is conducted every 4 years. The SES surveys are conducted on two consecutive years every 4 years. The statistical databases (made up on the basis of the monthly DSNs on the one hand and SIASP on the other hand) provide annual information. |
|||
| 3.3. Data collection | |||
SES 2017 and 2018 are employer surveys. The establishments can respond by paper questionnaire, computer file (for large companies) or by internet (new method introduced since the previous edition). Internet collection takes place via the Coltrane (COLlecte TRANsversale d’Enquêtes – transversal collection of surveys) portal for establishments in which fewer than 5 employees are being surveyed. Establishments receive an “establishment” questionnaire, together with questionnaires concerning one or more of their employees who are specifically named (between 1 and 24). It is therefore the employers who fill in the “employees” questionnaires. The collection takes place from March to December for each collection year (2018 for SES 2017 and 2019 for SES 2018).
The FPE 2018 survey is sent directly to the State civil service employees selected for the sample; unlike the SES surveys, it is, therefore, the employees themselves who fill in the questionnaire and not their employers. To start with, data are collected exclusively via the internet using the new online collection portal for INSEE’s household surveys; however, respondents are still offered the option of filling in a paper questionnaire in the second and final reminders. In fact, almost 90% of responses were collected via the internet. The FPE 2018 survey was conducted from 9 September to 6 December 2019. |
|||
| 3.4. Data validation | |||
With a view to limiting measurement errors during collection, INSEE has integrated a data monitoring tool into the computer application (called “batch d’expertise” – expertise batch), which allows the SES surveys to be monitored. During the collection, this tool allows anomalies to be identified in the consistency of the data collected, such that outliers can be quickly detected and corrected by the management team. An automatic check is carried out, for example, to ensure that the elements included in a grand total do not exceed that total. In addition, orders of magnitude are checked using the distributions of the data from the previous survey. This makes it possible to detect and correct data entry and scanning errors, totals taken from the company’s accounts rather than the establishment and even calculation errors made by respondents that can go as far as multiplying or dividing a total by 10. Following collection, INSEE and DARES (the statistical service of the Ministry of Labour) carry out adjustments (alignment, calibration, handling of non-responses) and in-depth validation based on comparisons with the previous edition, as well as with other administrative or survey-based data sources (see Section 8). |
|||
| 3.5. Data compilation | |||
Not available. |
|||
| 3.6. Adjustment | |||
Treatments Applied to Update the 2017 Data for 2018 The Eurostat database contains some observations surveyed for the year 2017 and others for the year 2018. The remuneration variables observed in 2017 are adjusted (or updated) to make them representative of 2018 by applying the change to the average gross hourly pay (by stratum) estimated in the DSNs conducted between 2017 and 2018. The strata used to calculate the change in the average gross wage are the following intersections: – the economic activity sector (A21); – the geographical location in 3 modalities (Île-de-France, rest of metropolitan France and the overseas departments grouped together in a single modality); – the size of the company in 3 modalities (10-249, 250-999, 1000+).
The remuneration variables affected by this update are gross annual reference salaries, annual bonuses and premiums, gross monthly reference salaries, overtime payments, exceptional income, average income during the reference month. Conversely, neither the variables linked to the time worked (hours, working time or length of service) nor the individual’s characteristic variables are adjusted.
The other adjustments made to the surveys (adjustment of total and partial non-response) are described in Section 8. |
|||
|
|||
| 4.1. Quality assurance | |||
With a view to evaluating their relevance, the SES and FPE surveys are reviewed every 4 years by the National Council for Statistical Information (Conseil national de l’information statistique – CNIS) and the Official Statistics Quality Label Committee (Comité du label de la statistique publique). These two entities verify the relevance and statistical quality of the operation, its process, the statistical and accounting standards and the test questionnaires carried out prior to the survey. They also ensure that consultation has indeed taken place with the partners concerned. They issue an opinion on the appropriateness of the survey and general interest and statistical quality label. The Label Committee may also apply an obligation to respond, which ensures that the results of the survey are as representative as possible. The CNIS issued a favourable opinion on the appropriateness of the SES 2017 and 2018 surveys, as well as of the FPE 2018 survey (opinion numbers 67 of 8 June 2017 and 66 of 16 June 2017). The Official Statistics Quality Label Committee awarded these surveys the general interest and statistical quality label and made them mandatory under visa numbers 2019X081EC for the FPE 2018 survey, 2018A044EC for the SES 2017 survey and 2018A089EC for the SES 2018 survey. |
|||
| 4.2. Quality management - assessment | |||
In addition to this ex-ante labelling procedure, the SES 2018 is also subject to evaluation by different departments within INSEE during the validation of the findings (see Sections 3.4 and 8). Following adjustment by INSEE and the statistical service of the Ministry of Labour (see Section 3.4), INSEE performs an in-depth validation of the data by comparing them with the previous edition, or by using external sources (National Accounts, DSN/SIASP statistical reference databases, the labour cost index (LCI) and the continuous Labour Force Survey (enquête emploi en continu – EEC), see Section 8).
|
|||
|
|||
| 5.1. Relevance - User Needs | |||
Many national stakeholders use the SES 2018: INSEE, the Ministry of Labour (in particular its studies and statistics department, “DARES”) and researchers. DARES uses the SES surveys, in particular, to respond to numerous requests relating to the various components of remuneration and the organisation of working time (statistics by type of collective bargaining agreement, characteristics of employees earning the minimum wage, salary saving schemes, overtime, working hours, etc.). Information from these surveys is also used for INSEE’s national accounts. Social science researchers also use this source of data on both establishments and their employees to study the wage practices implemented by companies. |
|||
| 5.2. Relevance - User Satisfaction | |||
Not applicable.
|
|||
| 5.3. Completeness | |||
All of the mandatory variables requested by the Eurostat legislation have been provided.
|
|||
| 5.3.1. Data completeness - rate | |||
see 5.3
|
|||
|
|||
| 6.1. Accuracy - overall | |||
Not available. |
|||
| 6.2. Sampling error | |||
See below |
|||
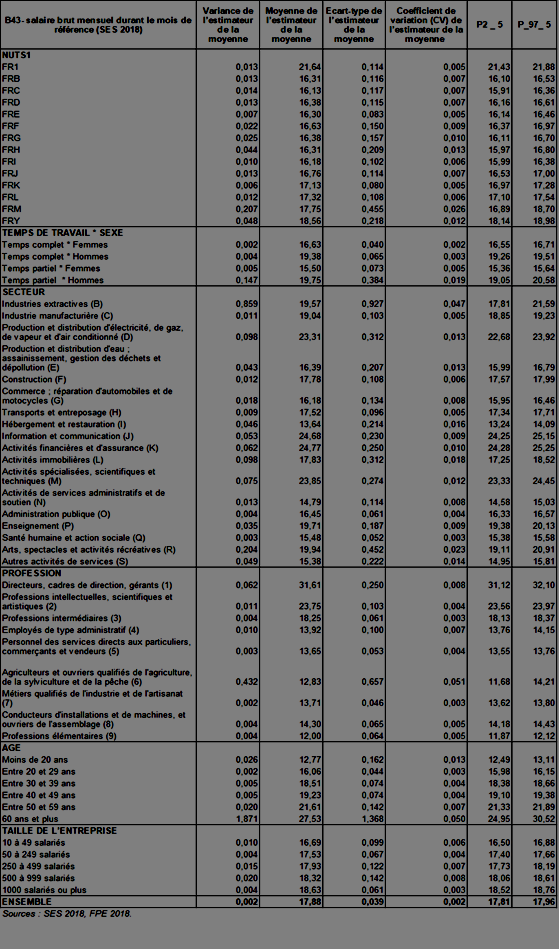
| 6.2.1. Sampling error - indicators | |||
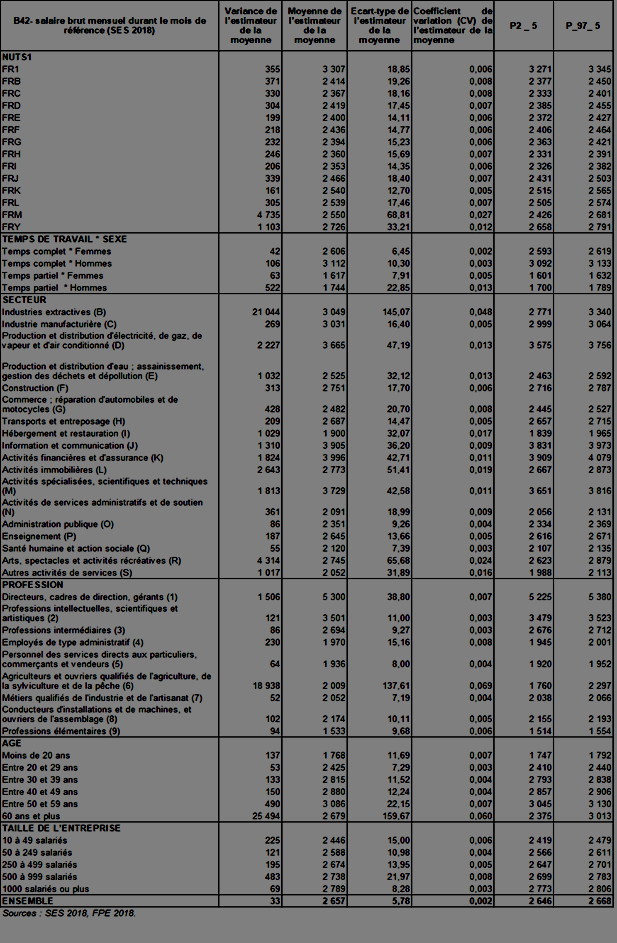
The SES 2018 databases are made up of variables available at the employee level (256,600 employees) and variables available at the establishment level (39,163 establishments in total). The variance in the estimators of the mean of the variables of interest was calculated empirically using the bootstrap method. Tables 6-1 and 6-2 below show the empirical precision elements obtained for SES 2018 using the bootstrap method with 1,000 replications of identical size (where CV = the coefficient of variation, p_2_5 and p_97_5 are the 2.5 and 97.5 percentiles of the distribution of the bootstrap replications, respectively, and therefore represent the lower and upper bounds of the 95% confidence intervals) for the estimators of the mean for the main variables of interest in the survey: gross wage during the reference month and gross hourly wage during the reference month. Table 6-1: For Hourly Wages (Variable B43)
Table 6.2: For the Gross Wage During the Reference Month (Variable B42)
|
|||
| 6.3. Non-sampling error | |||
See below |
|||
| 6.3.1. Coverage error | |||
The central social security bodies (CNAM, CNAV, etc.) are in the sampling frame (which was not the case for the previous edition). In practice, civil servants in the French armed forces are not covered by the survey.[1] The sampling for a survey for year N is based on employees in post as at 31 December in year N-1 (in general); employees who start work during year N are therefore not surveyed. This lack of coverage is corrected by the final calibration performed on the comprehensive statistical files (DSN, SIASP) for year N at the end of processing. In addition, the lack of coverage specific to SES 2017 – linked to the fact that its sample could only be drawn from among employees in post as at 31 December 2015 (and not 31 December 2016) – was compensated for by an over-representation of the populations concerned in the SES 2018 sample (see Section 3.1). |
|||
| 6.3.1.1. Over-coverage - rate | |||
To avoid over-coverage errors, during the adjustment stages, an initial step is carried out to eliminate the “out of scope” employee questionnaires that relate to a position ended prior to 2018 in SES 2018 (approximately 4% of cases) and prior to 2017 in SES 2017 (approximately 12% of cases). The out-of-scope rate for 2017 is higher due to the age of the sampling frame used (see Section 3.1): the sampling frame is normally made up of files for positions in N-1 in order to obtain a database of employees in post as at 31 December N-1. This database was not available for SES 2017 due to the switch from the old annual social data declarations (DADS) to the DSN. The sampling frame was therefore established on the basis of the DADS 2015 for the private sector (and SIASP 2016 for the public sector (Public Hospital Service (Fonction Publique Hospitalière – FPH) and National Civil Service (Fonction Publique Territoriale – FPT)). This means that, in the private sector, the companies present in the sampling frame and then in the SES 2017 sample could have closed and their employees could have left in 2016, meaning that they are actually out of scope. |
|||
| 6.3.1.2. Common units - proportion | |||
Not applicable. |
|||
| 6.3.2. Measurement error | |||
Thanks to the data monitoring tool, inconsistencies can be detected and quickly corrected by the management team during the collection process (see also Section 3.4). The central variables of the survey (gross wage and number of paid hours) are mainly checked using individual data from the comprehensive statistical files from administrative sources (DSN or SIASP) and other variables of the survey, within the scope of a consistency analysis conducted at the individual level and potentially resulting in adjustments being made to the declared variables (and imputations where these are missing, see Section 6.3.3). A second adjustment is carried out following the above-mentioned adjustments and imputations to satisfy the constraints imposed by Eurostat, namely strict compliance with the limits for several variables (working hours and valuation of overtime, for example) and the absence of partial non-responses (removal of individuals for whom certain variables are still missing after imputation). See Section 6.3.4.1 for the table setting out the adjustment rates for each variable and Section 6.3.3 for details of the imputation methods. |
|||
| 6.3.3. Non response error | |||
As was the case with the SES 2017 and 2018 surveys, the final weighting for the FPE 2018 survey was obtained in two steps: the initial sampling weights were corrected for total non-response and then modified by means of calibration. Response Rate For the three surveys, SES 2017, SES 2018 and the additional FPE 2018 survey, 352,004 individual employee questionnaires were sent out and 266,996 usable responses were received, which represents a response rate of 75.8%. Treatment Applied for Total Non-Response The files are corrected for total non-response by means of post-stratification. Where a unit is non-respondent, its weight is reallocated to the respondent units within the same sampling stratum in a homogeneous manner. Treatments Applied for Partial Non-Response Eurostat does not accept partial non-response; imputation is used where possible. The principles generally applied for imputation are: – the value collected by the questionnaire is retained, even where it is inconsistent with the DSN value, since the responses given to the other questions within the questionnaire are consistent with one another. – where outliers, missing values and inconsistencies, either internal or with the DSN data, are detected. Certain variables are adjusted by means of deterministic imputations using the DSN variables, while others are adjusted by means of modelling (statistical imputation). Consistency tests are also applied to the non-core variables of the survey (bonuses, overtime, etc.). Regardless of the source (questionnaire or enrichment), remuneration data are considered to be more reliable than duration-related data, so it is the durations that are modified in the event of an inconsistency. The duration variable taken from the administrative data is one of the variables for which a break in series is observed during the transition from DADS to DSN. The core variables of the survey (gross salary and number of paid hours) are therefore primarily checked using the DSN. In the case of qualification and seniority data, imputation takes place by means of hot deck imputation (a method of imputing data using values from other survey respondents with the same characteristics): same age group, working in the same business sector, same location (Île-de-France/Province), etc. See Section “6.3.4.1. Imputation – Rate” for the detailed table of imputation rates by variable. Treatment of the Weights of Influential Units A programme for treating influential units is then applied to the SES 2017 and 2018 files in order to monitor the influence of individuals who, as a result of their responses and their weighting, may bias the value of the group to which they belong, even if their response is not incorrect. The influential units are treated using the Kokic and Bell method (“Optimal winsorizing cut-offs for a stratified finite population estimator”, Journal of Official Statistics, vol. 10, no. 4: 419-435, 1994). It modifies the weight of the individual so as to remove the risk of bias without losing the information from the response provided by that individual. This improves the precision of the hourly wage estimators, particularly in groups with significant variation in hourly wages or in groups containing small numbers of employees. Calibration of the Data for Calculating the Final Weights Data from the SES 2017 and SES 2018 surveys The SES 2017 and 2018 files are combined in 2 tables: one for employees and one for establishments. The variables from the DSN, observed for the sample of respondents, are calibrated to the margins from the comprehensive DSN 2018 files to ensure that the SES 2018 is representative of 2018. The calibration principle applied is the one introduced in Deville and Särndal (Journal of the American Statistical Association, 1992). The following calibration variables are used for employees:
– socio-professional category in 4 modalities * gender; – full time/part time; – geographical location (divided into 13 regions – NUTS – with Corsica grouped together with the Provence-Alpes-Côte d'Azur region on the one hand and the overseas territories grouped together on the other hand); – company size * business sector (the size is aggregated to a greater or lesser degree depending on the business sector; the business sector corresponds to the NACE rev 2 section).
– socio-professional category * gender; – full time/part time; – whether or not they are paid a fixed rate (primarily contractual regimes involving fixed daily or hourly rates); – geographical location (divided into 13 regions – NUTS – with Corsica grouped together with the Provence-Alpes-Côte d'Azur region on the one hand and the overseas territories grouped together on the other hand); – company size, in 5 bands; – business sector (NACE rev 2 section),
– socio-professional category; – gender; – full-time/part-time. The calibration variables for establishments are the number of establishments broken down by: – geographical location (divided into 13 regions – NUTS – with Corsica grouped together with the Provence-Alpes-Côte d'Azur region on the one hand and the overseas territories grouped together on the other hand); – company size * business sector (size is broken down into three categories: fewer than 50 employees, between 50 and 500 employees and more than 500 employees; the sector is broken down into NACE sections). The sections in which there are too few employees are then grouped together in a stratum of the same size; – public/private sector (financial control variable based on the repositories of the Register of companies with majority control by the State (Répertoire des entreprises contrôlées majoritairement par l’État – RECME) that makes it possible to differentiate between establishments that are primarily FPT and FPH and those that primarily belong to the private sector). Data From the FPE 2018 Survey Calibration has also been performed for the data from the FPE 2018 survey, which are employee-level data. The variables from the survey and observed for the sample of respondents are calibrated to the margins from SIASP 2018. The number of employees is calibrated by: – age band * gender; – statutory category (A, B, C) * status (permanent or temporary); – geographical location (broken down into 3 groups: Île-de-France/overseas departments/rest of metropolitan France); – ministries grouped into 4 modalities (Ministries of Education, economic ministries, state ministries, other ministries). Gross wage and the number of paid hours are also calibrated and broken down by: – age band * gender (6 modalities); – statutory category (A, B, C) * status (permanent or temporary); – ministries grouped into 4 modalities (Ministries of Education, higher education and research, sports and youth; Ministry of the Economy and finances, industry, labour and employment; state ministries (Justice, interior and defence (excluding military)); other ministries, primarily those responsible for ecology, social affairs and agriculture or national public institutions. |
|||
| 6.3.3.1. Unit non-response - rate | |||
Not applicable.
|
|||
| 6.3.3.2. Item non-response - rate | |||
Not applicable.
|
|||
| 6.3.4. Processing error | |||
Not applicable.
|
|||
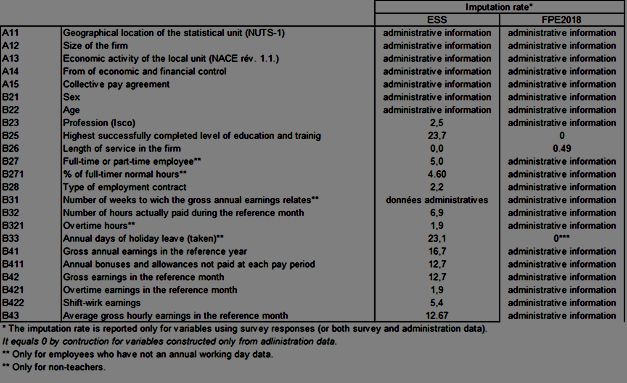
| 6.3.4.1. Imputation - rate | |||
The adjustment/imputation rates in Tables 6-3 and 6-4 below show the number of individuals (not weighted in this case) whose response was imputed/adjusted against the total number of individuals contributing to the estimate. The high rate of adjustment for variable B271 (working time) can be partly explained by the conversion of days into hours or vice versa in the case of the fairly large number of declarations in which the working time is not declared in the unit stipulated in the section provided for this purpose. The high rate of adjustment for the hourly wage variable (B43) can be largely explained by the adjustments carried out with regard to overtime and/or overtime pay, which are generally less well reported by companies. Table 6-3: Imputation rate for SES and FPE 2018
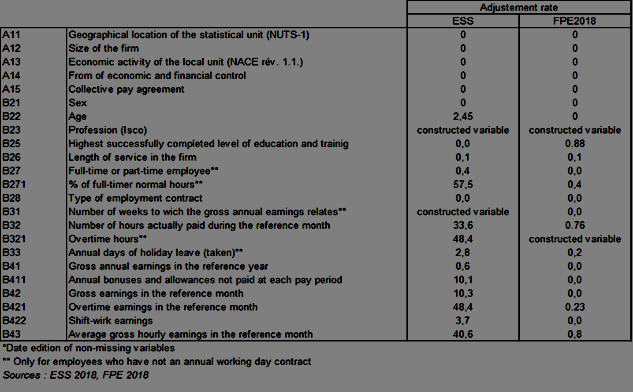
Table 6-4: Adjustment rate for SES and FPE 2018
|
|||
| 6.3.5. Model assumption error | |||
Not applicable.
|
|||
| 6.4. Seasonal adjustment | |||
Not applicable.
|
|||
| 6.5. Data revision - policy | |||
Not applicable.
|
|||
| 6.6. Data revision - practice | |||
Not applicable.
|
|||
| 6.6.1. Data revision - average size | |||
Not applicable.
|
|||
|
|||
| 7.1. Timeliness | |||
SES 2018 can be used and published from the end of 2020.
|
|||
| 7.1.1. Time lag - first result | |||
Eurostat started publishing the initial findings of SES 2018, in particular the French data, from 1 October 2020. In the case of France, these findings were based on provisional data submitted to Eurostat on 31 July 2020. Subsequent updates have been made to take account of the final version of the data submitted to Eurostat on 13 November 2020. The first national publications will be produced by INSEE and DARES (Ministry of Labour) in 2021 (DARES-Analysis, INSEE Focus and INSEE Résultats containing detailed tables). |
|||
| 7.1.2. Time lag - final result | |||
Not applicable. |
|||
| 7.2. Punctuality | |||
The collection schedules were complied with. More precisely, for SES 2018, the schedule for conducting the survey was as follows: – March 2019: sending of announcement letters; – mid-May 2019: first Coltrane assessments (online collection portal); – July 2019: sending of reminder letters to registered offices; – September 2019: sending of formal notice letters; – October 2019: sending of non-response notifications; − 31 December 2019: closure of the survey portal on Coltrane; – 10 January 2020: closure of the survey management application. From the sending of the questionnaires to the completion of collection, a team of managers provides a point of contact and responds to requests from companies (answering questions, granting additional time, etc.). The team also checks the questionnaires and follows up with companies in the event of serious errors. To avoid following up with companies too long after they have returned their questionnaires, data entry took place on a continuous basis from the time that the first responses were received from the establishments. The schedule for the SES 2017 survey was very similar to that described above for SES 2018, but one year earlier. The schedule for the FPE 2018 survey was as follows: – 10 September 2019: sending of announcement letters and opening of the online response site; – October 2019: first reminder to respondents; – 5 November 2019: second reminder to respondents with the sending of a paper questionnaire; – mid-December 2019: end of the collection of paper questionnaires (6 December) then closure of the online collection site (11 December); The data coding, imputation, adjustment, calibration and validation phases then took place up until the data were sent to Eurostat. SES 2018 was originally due to be submitted to Eurostat on 30 June 2020. This initial deadline proved impossible to meet for two reasons: firstly due to the dates on which the administrative data on 2018 wages were provided (April 2020 for the Nominative Social Declaration – DSN 2018), for which assessment work still needed to be carried out (with regard to their comparability with the annual social data declarations used in the past), albeit to a lesser degree than that carried out for 2016 and used to produce the French section of the Labour Cost Survey 2016; secondly – and most importantly – due to the lockdown period imposed in France from March to May 2020 as a result of the COVID-19 pandemic, which disrupted the planned progress of the work. In spite of these difficult circumstances, INSEE succeeded in submitting an initial version of the SES 2018 data with a few weeks delay on 31 July 2020. A second version was then submitted on 13 November 2020 to correct an anomaly in the hours worked, which mainly brought about an inconsistency in the hourly wage of part-time employees. |
|||
| 7.2.1. Punctuality - delivery and publication | |||
see 7.2
|
|||
|
|||
| 8.1. Comparability - geographical | |||
European Comparison The NUTS (region where the establishment is located), TAILLE (size of the company) and NACE (economic activity at divisional level) variables are taken from the register of companies. The age, gender and pay period in days of the employees covered by the SES survey (not including State civil servants covered by the FPE survey) are taken from the DSN. For State civil servants, in addition to this information, variables relating to remuneration and paid hours are taken from SIASP. The remaining variables are taken from responses by establishments to employee questionnaires that concern the private sector, the public hospital service and the national civil service (SES surveys), and the responses provided by the employees themselves in the case of State civil servants (FPE survey). The annual Structure of Earnings Surveys (SES 2017 and SES 2018) offer establishments three different collection methods: via an online questionnaire, a paper questionnaire or a computer file deposit and withdrawal service. The FPE survey also offers two collection methods: online and paper questionnaire. The questionnaires are identical regardless of the collection method used. The reference month is not a specified month, but corresponds to an average month during the year. |
|||
| 8.1.1. Asymmetry for mirror flow statistics - coefficient | |||
Not applicable. |
|||
| 8.2. Comparability - over time | |||
Comparability Between the SES 2018 Survey and the SES 2014 Survey When compared with 2014, the SES 2018 surveys include the following: - New stratification of the establishment sampling frame to limit the dispersion of weights. A new grouping has been created using a new breakdown for the business sector variables. - New adjustment chain for employee data: improved control and readability of successive adjustment operations and improved monitoring of adjustments through the use of standardised monitoring variables. - The number of days of leave is imputed differently when compared with 2014. The implementation rules for SES 2018 clearly specify that a number of statutory leave days must be allocated to employees, “be they taken or not”. It is therefore these statutory leave days that are provided in SES 2018 rather than the number of days of leave actually taken, as was the case for SES 2014 (since the measurement of the latter was of poorer quality).
- Improvements to the coding of occupations using ISCO classifications: a question concerning the main occupation of the employee has been added to the SES surveys to code occupations more finely and to improve the correlation within the survey between the national classification of occupations (PCS) and the international classification of occupations, which is required in SES 2018 (ISCO). - Change to the calibration margins for employee data: Certain differences in the types of intersections on which calibration was carried out: – In 2018, statutory category * gender * full time/part time * whether paid a fixed rate or not * company size * NUTS. Versus: in 2014: statutory category * gender * (whether paid a fixed rate or not), business sector * company size * department * (whether paid a fixed rate or not), full time/part time * (whether paid a fixed rate or not). – Addition of full-time equivalents into the calibrated variables – Change to the calibration of NACE sections D and E. For SES 2018, calibration was performed separately in each of these two sectors rather than together as was the case in the previous edition. In the survey of State employees: – Change to the calibration margins: In the FPE 2014 survey, only the number of employees was calibrated. In 2018, the calibration also extended to gross wages and hours.
|
|||
| 8.2.1. Length of comparable time series | |||
see 8.2 |
|||
| 8.3. Coherence - cross domain | |||
The coherence analysis is described in Sections 8.5 (external comparison) and 8.6 (internal comparison). |
|||
| 8.4. Coherence - sub annual and annual statistics | |||
Not available. |
|||
| 8.5. Coherence - National Accounts | |||
Validations are based on comparisons of the level of and changes in individual (micro) variables and the main aggregates obtained (wage, duration, paid hours) between survey years and with external sources: DADS/DSN, SIASP, LFS (Labour Force Survey), LCI (Labour Cost Index), NA (National Accounts).
– Comparison of Micro Data
The levels of the SES 2018 variables and the way in which they changed between SES 2014 and SES 2018 were compared with the variables for the “closest” concepts included in the DSN and in SIASP with the same coverage. It should be noted that the concepts of earnings as defined by Eurostat and those calculated on the basis of the DSN do not fully overlap.
The gross salary calculated on the basis of the DSN for a period t comprises: basic salary and bonuses, benefits in kind, overtime pay, severance pay (redundancy or retirement pay over and above the statutory minimum), employee savings relating to the period t-1,sums paid by third parties (excluding daily allowances and training), benefits linked to social and cultural activities and other additional allowances.
The salary as defined in the SES 2018 survey comprises: basic salary and bonuses, benefits in kind, overtime pay, all severance pay, and employee savings relating to the period t.
Variable B41 (gross annual earnings) includes all of these elements of remuneration, whereas variable B42 (gross earnings for the reference month) does not include bonuses paid on a non-regular basis (year-end bonuses, severance pay).
Variable B43 (hourly pay) also does not take account of such exceptional bonuses. Comparisons at the level of paid hours are also dependent on the imputations carried out in SES 2018 for employees being paid a fixed rate.
Variable B31 (number of weeks worked, see Table 8-1): declines in almost all sectors for B31. Variable B31 is largely imputed using administrative data, as it is not always completed in the questionnaire. There was a break in series in the administrative data associated with the transition to the DSN and it is now of better quality, particularly when it comes to short-term contracts (see Section 8.5, improved declaration of periods of employment in the administrative data). The declaration of periods of employment is actually much improved in the DSN when compared with the administrative sources used previously, which has led in particular to the exclusion of days within certain periods of employment that were, in fact, not worked, particularly in the context of short-term contracts, thereby allowing the estimate of their average duration to be revised downwards. Table 8-1: Number of Weeks Worked (B31)
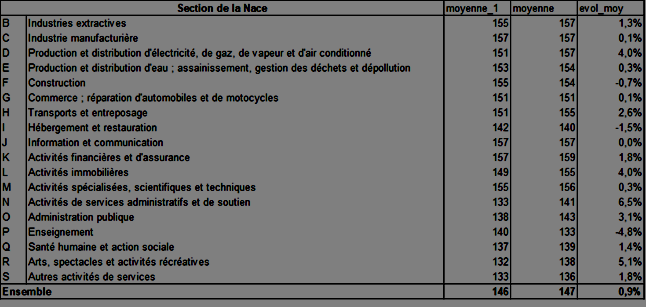
Variable B32 (Number of hours paid during the reference month, see Table 8-2): B32 is also affected as it is partly based on the administrative variable. Table 8-2: Number of Hours Paid (B32)
– Comparison of Aggregates SES 2018 covers companies with more than 10 employees, but excludes those employed by private individuals and in the agriculture sector. The data provided by the national accounts cover the entire scope, including companies with fewer than 10 employees and those employed by private individuals. The administrative files (DSN and SIASP) are used here on the one hand with the coverage that comes as close as possible to that of the survey and on the other hand with a coverage similar to that of the national accounts for the purposes of calibrating the comparisons.
The Main Findings The most notable findings are summarised below:
First, we will compare the gross annual wage (B41) per (average) employee between sources, as required by Regulation 698/2006.
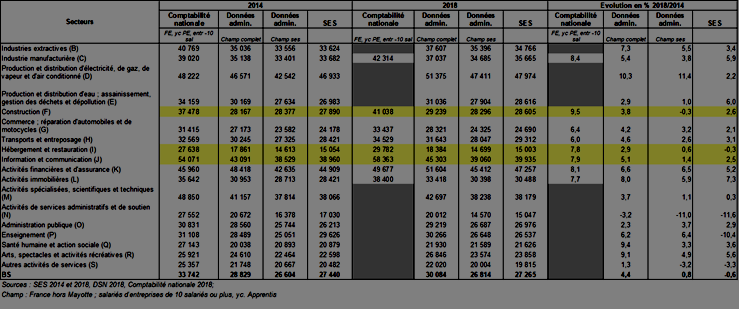
Variable B41 (see Table 8-3): average change of −0.6% in the survey compared with +0.8% in the administrative sources. The largest discrepancies are in sections D (+2.2% for the survey compared with +11.4% in the administrative sources) and P (−10.4% in the survey compared with 6.4% in the DSN). These differences are largely due to the improvements made to the data calibration procedure (see Section 8.2) and reflect the differences in levels in the previous edition (between SES 2014 and the corresponding administrative data), particularly in the two sections mentioned above.
The greatest differences between the levels in the national accounts and the survey are found in sections I (Accommodation and food service activities), J (Information and communication), M (Professional, scientific and technical activities) and N (Administrative and support service activities). These discrepancies are not specifically attributable to the SES survey, since they are also found when comparing the national accounts and administrative sources (remaining within the coverage of the SES). The downward trends in section N for the most part reflect a compositional effect attributable to the large increase in temporary employment in France during the 2015-2018 period.
Table 8-3: Comparison of Annual Earnings per Employee According to Source (B41)
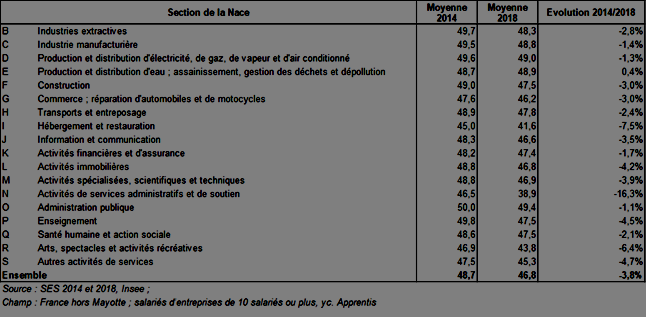
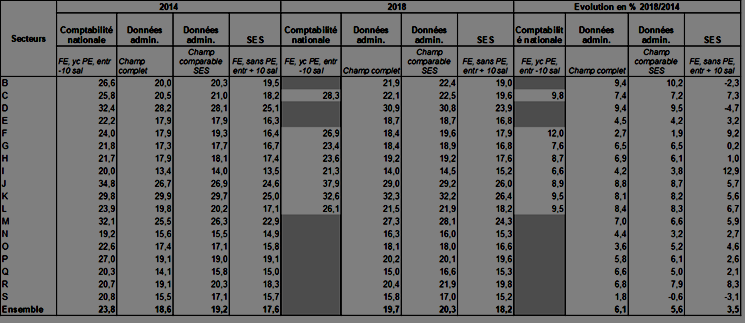
Variable B43 (see Table 8-4): change of +3.5% in the survey compared with +5.6% in the administrative data. The largest discrepancy is in section D (–4.7% in the survey compared with 9.5% for the DSN): impact of the improved calibration, differences in changes that largely reflect differences in levels in the previous edition (between SES 2014 and the corresponding administrative data).
Table 8-4: Comparison of Hourly Wage (B43) According to Source (Mean)
Structural Comparison with the Labour Force Survey
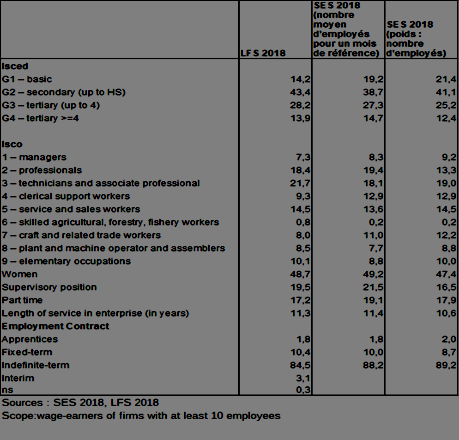
Structures by gender (B21), age bracket (B22), single-figure ISCO occupation (B23), managerial position (B24), qualification (B25), seniority in the company (B26), part time (B27), type of employment contract (B28) in SES 2018 and in the Labour Force Survey 2018 are compared with a coverage similar to that of SES 2018 (all employees working in a public or private-sector company with more than 10 employees, including paid executives and excluding employees of private individuals). The greatest differences are found in the distribution by qualification (see Table 8-5): there are fewer G2 (secondary up to High school) in the SES than in the Labour Force Survey (39% vs 43%) and slightly more people with few qualifications (G1 – basic) (19% vs 14%). The two sources also present some moderate discrepancies in the distribution by occupation (single-figure ISCO): there are slightly more office workers (13% vs 9%) and slightly fewer technicians (18% vs 22%) in the SES. Looking beyond the fact that the coding of qualifications and occupations is based on more variables and is therefore finer and of better quality in the Labour Force Survey (LFS), the differences in the structure of qualifications and occupations of the two sources can also be explained by the fact that the data are collected from employers for the SES (whereas they are collected directly from employees for the LFS) and that the socio-professional category taken from the administrative bases (also used to perform adjustments/imputations within the SES) differs from that taken from a household survey. The proportion of employees in managerial positions (survey response in both cases) is slightly higher in SES 2018 than in LFS 2018 (21.5% versus 19.5%). Finally, the share of part-time work is slightly higher in SES 2018 than in the LFS, which can be at least partly explained by the main job approach taken by the LFS compared with the work position approach taken in the SES. Table 8-5: Comparison of the Structure of SES 2018 and LFS 2018
|
|||
| 8.6. Coherence - internal | |||
Eurostat has requested that the changes in a certain number of statistics between 2018 and 2014 are checked, crossed by: • Age group: under 30, 30-39, 40-49, 50-59, 60 plus; • Gender; • NACE: section groups: BN, BF, GN, PS, BS_O; • ISCO: single-digit coding (9 modalities), then groups 1-5 (non-manual work) 6-8 (manual work); • Full-time/part-time.
Any change that exceeds 10% or deviates too far from the mean change is examined. The surveys are compared with a similar scope: in this case, the coverage is the private and public sector, excluding the overseas departments and social security bodies, but including public institutions (legal category 73), as there have been some changes to legal categories (71 and 73) in the wake of the law on university autonomy, which occurred between 2010 and 2014.
– Change in the Number of Employees The most significant changes were seen in: Section N: better account is taken of temporary workers. All of the ISCOs: Improved ISCO coding. The main job variable has been added to the questionnaire. Age bracket: over the 60s.
– Change in the Number of Establishments
Comparisons of the number of establishments in sections D and E are not relevant, as SES 2014 was calibrated with sections D and E combined, which resulted in the fine sector findings being rather erratic.
– Other Variables Eurostat has requested that the changes between SES 2014 and SES 2018 be checked with regard to the following statistics: – B41 (gross annual earnings): mean, median, d1, d9; – B411 (annual bonuses not paid at each pay period): overall mean, mean for employees for whom B441>0; – B33 (annual days of holiday leave): mean; – B42 (gross earnings in the reference month): mean, median, d1, d9; – B421 (overtime earnings): overall mean, mean for employees for whom B421>0; – B422 (shift work earnings): overall mean, mean for employees for whom B422>0; – B43 (average gross earnings in the reference month= B42/B32): mean, median, D1, D9 and by NACE section: mean; – B32 (paid hours): overall mean; – B321 (overtime hours): overall mean, mean for employees for whom B321>0; – Nb of employees: weighted total (see above); – Nb of local units: weighted total (see above); – Proportion of “low-wage workers” based on B42 (<50% overall median). |
|||
|
|||
| 9.1. Dissemination format - News release | |||
Not applicable.
|
|||
| 9.2. Dissemination format - Publications | |||
SES 2018 will form the subject of national publications by INSEE and by the Official Statistical Service of the Ministry of Labour (DARES) from 2021. |
|||
| 9.3. Dissemination format - online database | |||
See below |
|||
| 9.3.1. Data tables - consultations | |||
The data are available and can be consulted on the Eurostat website. |
|||
| 9.4. Dissemination format - microdata access | |||
A file of anonymised individual SES 2018 data for France will be made available to researchers via the Eurostat “data centre”. Different individual files are made available at INSEE: – Each of the annual SES surveys and additional FPE surveys is made available to the Official Statistical Service (Service statistique public – SSP: INSEE and Ministerial Statistical Offices) for statistical purposes. – Production and research files (fichiers de production et de recherche – FPR) at the “employee” level regarding the SES and the FPE are made available to researchers via the Quételet centre; not only are these anonymised, but in order to guarantee the greatest possible confidentiality, certain variables are not available or are provided in an “aggregated” format (more aggregated level of the nomenclature for the business sector, for example). More complete files are also made available to researchers via the Remote Secure Data Access Centre (Centre d’Accès Sécurisé Distant aux Données – CASD), also known as the French datacenter, following the approval of the French Statistical Confidentiality Committee. These files will be available in 2021. |
|||
| 9.5. Dissemination format - other | |||
Detailed tables on wage structure will be available on INSEE’s website in 2021 (INSEE-Résultats) and will accompany the publications mentioned in Section 9.2. |
|||
| 9.6. Documentation on methodology | |||
The SES surveys form part of the ECMOSS system (which combines the SES Structure of Earnings Surveys with the ECMO labour cost surveys); this system is described on INSEE’s website (https://www.insee.fr/en/metadonnees/source/serie/s1221) as well as on the National Council for Statistical Information’s (CNIS) website (see Section 9.7).
The FPE survey is also described on INSEE’s website (https://www.insee.fr/en/metadonnees/source/serie/s1263) and on the CNIS’ website (see Section 9.7).
|
|||
| 9.7. Quality management - documentation | |||
The opinion on appropriateness, the general interest and statistical quality labels, and the granting of mandatory status by the label committee can be viewed on the CNIS’ website.
For the SES 2017 and SES 2018 surveys
For the FPE 2018 survey |
|||
| 9.7.1. Metadata completeness - rate | |||
Not available. |
|||
| 9.7.2. Metadata - consultations | |||
Not available. |
|||
|
|||
For the SES, companies are surveyed in relation to an average of 8.7 employees. The average response time is estimated at 30 minutes for the establishment questionnaire and 20 to 25 minutes for each employee questionnaire. For the FPE survey, the average time to complete the questionnaire is estimated at around 20 minutes.
|
|||
|
|||
The SES and FPE surveys have been declared to the National Commission on Informatics and Liberty (Commission Nationale de l’Informatique et des Libertés – CNIL). For more information on the SES, see the order of 10 March 2006 establishing an automated processing system for personal information relating to a statistical survey on the structure of earnings and labour costs, published in the Official Journal (NOR: ECOS0650011A). With regard to the FPE, see the order of 21 September 2011 establishing an automated processing system for personal information relating to surveys of State employees to complement the annual labour costs and structure of earnings surveys, published in the Official Journal (NOR: EFIS1125542A). |
|||
| 11.1. Confidentiality - policy | |||
The published results comply with the rules on statistical confidentiality. |
|||
| 11.2. Confidentiality - data treatment | |||
Not applicable.
|
|||
|
|||
- |
|||
|
|||
|
|||