|
|
||||||||||||||||||||||||||||||||||||||||||||||||||||||||||||||||||||||||||||||||||||||||||||||||||||||||||||||||||||
| For any question on data and metadata, please contact: Eurostat user support |
|
|||
| 1.1. Contact organisation | Eurostat, the statistical office of the European Union |
||
| 1.2. Contact organisation unit | E2: Environmental statistics and accounts; sustainable development |
||
| 1.5. Contact mail address | 2920 Luxembourg LUXEMBOURG e-mail contact: ESTAT-CIRCULAR-ECONOMY@ec.europa.eu |
||
|
|||
| 2.1. Metadata last certified | 08/07/2022 | ||
| 2.2. Metadata last posted | 08/07/2022 | ||
| 2.3. Metadata last update | 08/07/2022 | ||
|
|||
The indicator is part of the Circular Economy indicator set. It is used to monitor progress towards a circular economy on the thematic area of 'Global sustainability and resilience'. The Consumption Footprint addresses domestic and spill-over/transboundary environmental impacts through imported goods. Current trends of increasing consumption intensities and changes of patterns among areas of consumption result in an increasing EU consumption footprint. Circular economy strategies changing consumption patterns and the environmental profile of products might decrease EU’s consumption footprint. |
|||
|
||||||||||||||||||||||||||||||||||||
| 4.1. Data description | ||||||||||||||||||||||||||||||||||||
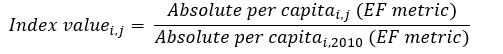
The indicator consumption footprint estimates the environmental impacts of EU and Member States consumption by combining data on consumption intensity and environmental impacts of representative products. The Consumption Footprint is a set of 16 LCA-based indicators (also available as a single score) whose purpose is to quantify the environmental impacts of consumption at EU and Member State level. It is based on the combination of: i) the emissions to air, soil and water as well as the resources used along the life cycle of circa 160 representative products, belonging to 5 areas of consumption (food, mobility, housing, household goods, and appliances); ii) the consumption intensities of those products; iii) the Environmental Footprint (EF) impact assessment method, which translates emissions and resource consumption into potential environmental impacts. Per capita: reports the per capita total value in the metrics of the impact categories of the Environmental Footprint method. Note that the single weighted score is calculated as the sum of the characterized value (absolute) of each impact category (i) divided by a normalization factor quantifying the global impact (Crenna et al., 2019) and multiplied by the EF weighting set (Sala et al., 2018). Index (base = 2010): reports the Consumption Footprint compared to 2010 as reference year. The index of a given impact category (i) for the respective year (j) is calculated as the relation between the absolute value for that year divided by the reference in 2010.
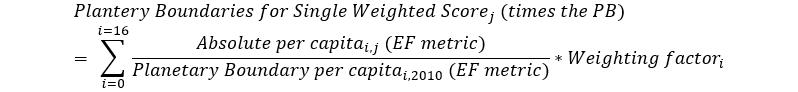
Planetary Boundaries: reports the number of times that the planetary boundary is transgressed for that impact category, country and year. The planetary boundaries for a given impact category (i) for the respective year (j) is calculated as the relation between the absolute value for that year divided by the Planetary Boundary per capita (as in 2010) (Sala et al., 2020).
Regarding the single weighted score, a weighted average is performed to express the overall transgression of planetary boundaries using the EF weighting factors set.
|
||||||||||||||||||||||||||||||||||||
| 4.2. Unit of measure | ||||||||||||||||||||||||||||||||||||
|
||||||||||||||||||||||||||||||||||||
| 4.3. Reference Period | ||||||||||||||||||||||||||||||||||||
Calendar year. |
||||||||||||||||||||||||||||||||||||
| 4.4. Accuracy - overall | ||||||||||||||||||||||||||||||||||||
Indicator from non-ESS source. For assessment of accuracy please refer to the original source (see link to external data source and metadata in "Annexes"). |
||||||||||||||||||||||||||||||||||||
| 4.5. Source data | ||||||||||||||||||||||||||||||||||||
|
EC -Joint Research Center (JRC) Note that Eurostat is not the producer of these data, only republishes them. These data are not considered European statistics. Joint Research Centre. Consumption Footprint Platform. Link to public dataset: https://eplca.jrc.ec.europa.eu/ConsumptionFootprintPlatform.html |
||||||||||||||||||||||||||||||||||||


|
|||
| 5.1. Frequency of dissemination | |||
| Every year Indicator is updated every year. |
|||
| 5.2. Timeliness | |||
| > T+2 years New data points are disseminated within three years after the reference year. |
|||
|
|||
| 6.1. Reference area | |||
| All EU MS Data are presented for Member States and European aggregates, plus United Kingdom |
|||
| 6.2. Comparability - geographical | |||
| All EU MS Data are comparable between all EU Member States respectively other presented countries. |
|||
| 6.3. Coverage - Time | |||
| > 10 years Data are available from year 2010. |
|||
| 6.4. Comparability - over time | |||
| > 4 data points Data are comparable over time, since the methodology used to calculate the values is the same. |
|||
|
|||
| 7.1. Dissemination format - Publications | |||
Analysis of indicator is presented in Commission Staff Working Document. |
|||
| 7.2. Dissemination format - online database | |||
| 7.3. Dissemination format - other | |||
Eurostat dedicated section on Circular Economy. JRC, Consumption Footprint Platform |
|||
|
|||
Copyrights: Eurostat Copyright/Licence Policy is applicable. |
|||
|
|||
|
|||
|
|||