
27/01/17
![]()
Accessibility tools
Service tools
Language
Navigation path
The Net International Investment Position (NIIP) is the stock of external assets minus the stock of external liabilities. In other words it is the value of foreign assets owned by private and public sector of a country minus the value of domestic assets owned by foreigners. NIIP is usually expressed in relation to an economy's size – NIIP to GDP ratio.
NIIP is a sum of past current account deficits or surpluses adjusted for regular valuation changes, i.e.:
Financial investors use NIIP to GDP ratio to gauge the creditworthiness of a country. The more negative the NIIP to GDP, the more country becomes vulnerable to volatility in international financial markets. Many countries that accumulated a large negative NIIP in the run-up to the crisis lost access to financial markets when the crisis struck and needed to accept international financial assistance to cover the deficit in their budgets.
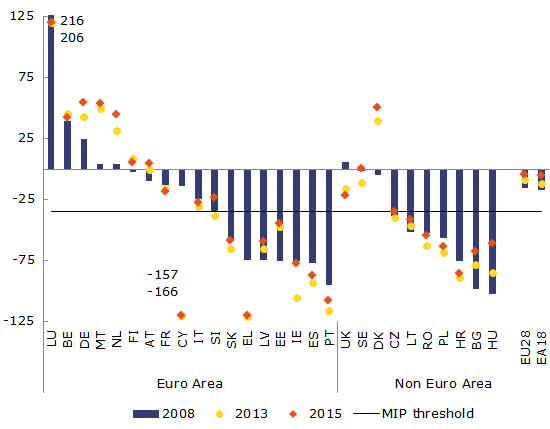
Source: DG ECFIN, Alert Mechanism Report
The graph above shows that the range of external liabilities in the EU is very wide and the risks to financial sustainability remain high in many member states.
Most of the economies with the largest negative international investment positions (NIIP) managed to reduce their large current account deficits or even shifted to external surpluses, which are sufficient to stabilise and slowly reduce their net external indebtedness over the medium term. This is notably the case for Ireland, Spain, Latvia, Romania and Portugal.
However, a mere stabilisation of external indebtedness may not be enough to restore full confidence, in particular for countries where the large NIIPs essentially reflect high level of debt (as opposed to countries where large negative NIIP is driven by significant inflows of FDIs). To reduce the NIIP to safer levels over the next decade, moderate to relatively large surpluses is necessary are all these countries.
Have a look at the full set of scoreboard indicators:
Find the latest Alert Mechanism Report on our MIP page:
Read more about the economy of your country:

Macroeconomic Imbalance Procedure
Economies of the Member States
EU Response to the economic and financial crisis
Alert Mechanism Report 2014![]()
![]() (13 Nov 2013)
(13 Nov 2013)
Additional tools