DG Regio has released a new draft regional Social Progress Index (SPI) for stakeholder feedback and public comments. It aims to measure the social progress level for 272 European regions as a complement to traditional measures of economic progress based on GDP, income and employment. Measuring social progress can inform the development strategies of the EU regions. The index scores absolute performance on a scale of 0-100 for each of the 50 indicators included to measure the Index componen
Figuring out social progress
- 01 April 2016
DG Regio has released a new draft regional Social Progress Index (SPI) for stakeholder feedback and public comments. It aims to measure the social progress level for 272 European regions as a complement to traditional measures of economic progress based on GDP, income and employment.
Measuring social progress can inform the development strategies of the EU regions. The index scores absolute performance on a scale of 0-100 for each of the 50 indicators included to measure the Index components.
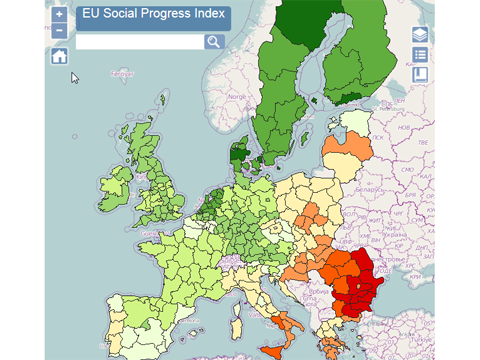
The latest figures show that overall SPI is lowest in the Romanian and Bulgarian regions and highest in the Nordic and Dutch regions. Social progress levels are also high in Austria, Germany, Luxembourg, Ireland and the UK. Belgium, France and Spain score well, although some of their regions score significantly lower than the rest of the country. In Greece and Southern Italy some regions have very low scores. In contrast, Estonia, several Czech regions and Eastern Slovenia scores are quite high despite their relatively low level of development.
Comparing SPI to Gross Domestic Product (GDP) per head, one measure of economic activity, shows a strong and positive link between the two which grows weaker at higher levels of GDP per head. This is particularly obvious in capital regions. For example, Bucharest, Bratislava, Prague, Brussels, Luxembourg and London all have a relatively low level of SPI relative to their GDP per head. Other regions score higher than their GDP per head would imply. This is the case for the Nordic regions and most Dutch regions, but also for Podlaskie in Poland and Cornwall and West Wales and the valleys in the UK.
The SPI was set up to help regions explore their strengths and weaknesses relative to regions of similar economic performance. These can be investigated in greater details using the regional scorecards which are available online at: http://ec.europa.eu/regional_policy/en/information/maps/social_progress
How it works
The index is built up from three dimensions: 1) basic human needs; 2) foundations of well-being; and 3) opportunity. Maps of the three dimensions can be viewed at: http://ec.europa.eu/regional_policy/mapapps/social_progress/spi.html
Each dimension has four thematic components. The resulting 12 components show significant variations both within and between EU Member States. They cover topics such as access to health care, the quality and affordability of housing, personal safety, access to higher education, and environmental pollution.
The index is the result of cooperation between the European Commission’s Directorate-General for Regional and Urban Policy, the Social Progress Imperative and Orkestra –Basque Institute of Competitiveness. It follows the overall framework of the global Social Progress Index, which has been customised for the EU. However, this index is not created for the purpose of allocating funding and does not bind the European Commission.
This draft index is being shared in order to collect feedback from stakeholders on the topics, the indicators included and the way these indicators are combined into a single final score for each region.
Please send comments and suggestions to: REGIO-B1-PAPERS@ec.europa.eu
A revised version of the regional Social Progress Index will be released in October 2016.
More Information