The EU fish market - 2016 edition

date: 29/09/2016
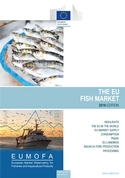
"The EU Fish Market" provides a snapshot of our fisheries and aquaculture industry's economy. It is published once a year by the European Market Observatory for Fisheries and Aquaculture Products and is available in five languages.
A major market for seafood
EU consumers spent 54 billion euro for buying fisheries and aquaculture products in 2015, reaching the highest amount ever recorded. A general positive trend was recorded in almost all Member States.
Consumption per capita rising between 2013 and 2014
Per capita fish consumption per year increased to 25,5 kg, as EU consumers ate one kg of fish more than in 2013. Tuna was the most-consumed product in the EU, with a per capita consumption of 2,6 kg in 2014, followed by cod, whose per capita consumption increased 22% from 2012 to 2014.
Growth of EU self sufficiency
The seafood supply in the EU grew by almost 650.000 tonnes between 2013 and 2014 (+4,5%). The main driver was internal production, which rose by 570.000 tonnes, mostly originating from fishing activities. The EU’s self-sufficiency improved, moving from 44,5% to 47,5%.
Record level of fish imports
Fish alone represents almost 20% of the overall EUR 120 billion worth of food products imported by the EU. The trade balance deficit of 2015 was the largest ever, confirming the EU as a net importer of fisheries and aquaculture products. The value of imported fish grew 6% from 2014 and reached EUR 22,3 billion. This was mainly determined by imports of cod, shrimps and salmon.
Increasing value of exports to extra-EU countries
In 2015, the EU exported less fisheries and aquaculture products in volume (-11%) compared with 2014, but their value rose to EUR 4,5 billion (+3%), the highest amount ever registered. This value increase was driven by exports of bluefin tuna from Spain and fishmeal from Denmark.
Pivotal role of intra-EU trade
Almost half of the fish products trade within and outside the EU consists of exchanges between EU Member States. In 2015, they were 4 times higher than exports to extra-EU countries, and totalled the all-time peak of 6 million tonnes worth EUR 22,5 billion.
EU landings
In 2014, the value of products landed in the EU was EUR 7,3 billion, 8% higher than its 10-year average. While in 2013 shrimps were the most valued species, hake surpassed them in 2014, thanks to a substantial increase registered by Spain and France. In volume terms, EU landings totalled 4,5 million tonnes which was a 7-year peak.
Main market trends and dynamics
The EU is the largest importer in the world. In 2015 its trade deficit reached EUR 17,8 billion, i.e. EUR 6 billion more than the United States deficit and EUR 7 billion more than the Japanese one. Retail prices for fish and seafood products have been rising from 2010 to 2015, with the highest annual growth registered in 2011. The continued import-ban imposed by Russia that contributed to the need of re-directing trade-flows previously going to Russia to either other export markets or internally within the UE. The appreciation of the Euro against the Norwegian Krone, the US dollar and the Chinese Yuan rates drove both prices trends and volume shift. Parallel to a growing importance in imports from Iceland, the Euro depreciated against the Icelandic króna.
