
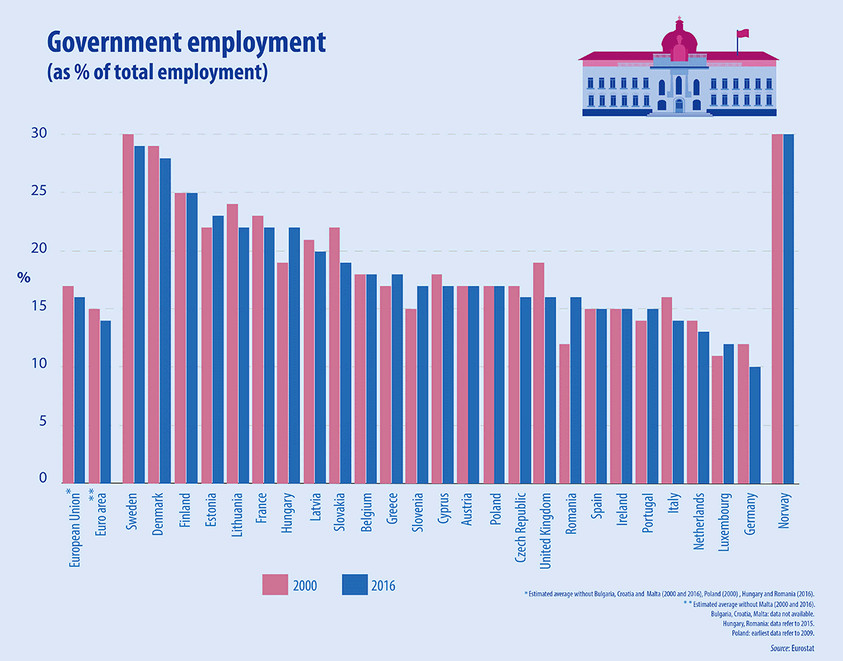
Government employment accounted for 16 % of employment in the EU in 2016. This share has remained more or less stable at between 15 % and 17 % of total employment since 2000. Government employment includes civil servants and other government employees (at national, regional and local level) as well as armed forces. It should be noted that the limits of the government sector vary across Member States for example, jobs in education or health are part of government employment in some countries, while they are not in others.
The share of people employed in the government sector in 2016 varied among the Member States, with the highest proportions recorded in Sweden (29 % of total employment), Denmark (28 %), Finland (25 %), Estonia (23 %), Lithuania, France and Hungary (2015) (all 22 %) and the lowest in Germany (10 %), Luxembourg (12 %), the Netherlands (13 %), Italy (14 %), Portugal, Ireland and Spain (all 15 %).
Do you want to know more about how a wide range of other economic issues have changed since the start of the millennium? Then take a look at the new digital publication The European economy since the start of the millennium!
To contact us: estat-user-support@ec.europa.eu.