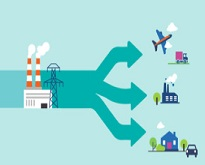
Do you think tables and datasets on energy are too complicated? Do you prefer intuitive tools and graphical answers to your questions? Then the interactive Eurostat Sankey tool is made for you!
This tool is now updated with new energy data for the year 2015!
With the Sankey tool you can easily visualise energy balances, determine how much energy is imported or produced in the EU or in your country, see where the energy is consumed or determine which renewable sources are the most important. Answers to these and many other questions are just a click away!
You can build and customise your own diagram by playing with different options (country, year, fuel, level of detail, etc.) and share your preferred views with your contacts using social media.
Further information is provided in the Statistics Explained article on Sankey diagrams


