Tutorials
Log in
Statistics Explained
menu
search
search
Navigation
Main page
Statistical themes
Glossary
Categories
Statistics 4 beginners
Tutorials
Help
Eurostat home
Education corner
Online publications
Regional yearbook
Sustainable development
Full list
Tools
User contributions
Logs
View user groups
Special pages
search
Navigation
Main page
Statistical themes
Glossary
Categories
Statistics 4 beginners
Tutorials
Help
Eurostat home
Education corner
Online publications
Regional yearbook
Sustainable development
Full list
Tools
User contributions
Logs
View user groups
Special pages
Navigation
Main page
Statistical themes
Glossary
Categories
Statistics 4 beginners
Tutorials
Help
Eurostat home
Education corner
Online publications
Regional yearbook
Sustainable development
Full list
Tools
User contributions
Logs
View user groups
Special pages
Uploads by Marcumc
This special page shows all uploaded files.
File list
Items per page:
20
50
100
250
500
Search for media name:
Username:
Include old versions of files
Go
First page
Previous page
Next page
Last page
Date
Name
Thumbnail
Size
Description
Versions
11:32, 11 September 2020
Demographic balance, 1 January 2019-1 January 2100 (thousands).png
(
file
)
82 KB
1
11:15, 11 September 2020
Projected population, EU-27, 1 January 2019-2100 (2019 = 100).png
(
file
)
36 KB
1
18:58, 14 August 2020
Population structure and ageing YB2020.xlsx
(
file
)
148 KB
1
16:15, 14 August 2020
Median age of population, 2009-19 (years).png
(
file
)
98 KB
2
16:11, 14 August 2020
Projected total-age and old-age dependency ratio, EU-27, 2019-2100 (%).png
(
file
)
43 KB
1
16:11, 14 August 2020
Population age structure indicators, 1 January 2019 (¹) (%).png
(
file
)
71 KB
1
18:50, 22 July 2020
Mortality and life expectancy statistics YB2020.xlsx
(
file
)
100 KB
1
18:43, 22 July 2020
Life expectancy at age 65, 1980-2018 (years).png
(
file
)
132 KB
1
18:39, 22 July 2020
Infant mortality, 2008 and 2018 (deaths per 1 000 live births).png
(
file
)
71 KB
1
18:38, 22 July 2020
Life expectancy at age 65, gender gap, 2018 (years, female life expectancy - male life expectancy).png
(
file
)
77 KB
1
18:34, 22 July 2020
Life expectancy at birth, 1980-2018 (years).png
(
file
)
131 KB
2
18:32, 22 July 2020
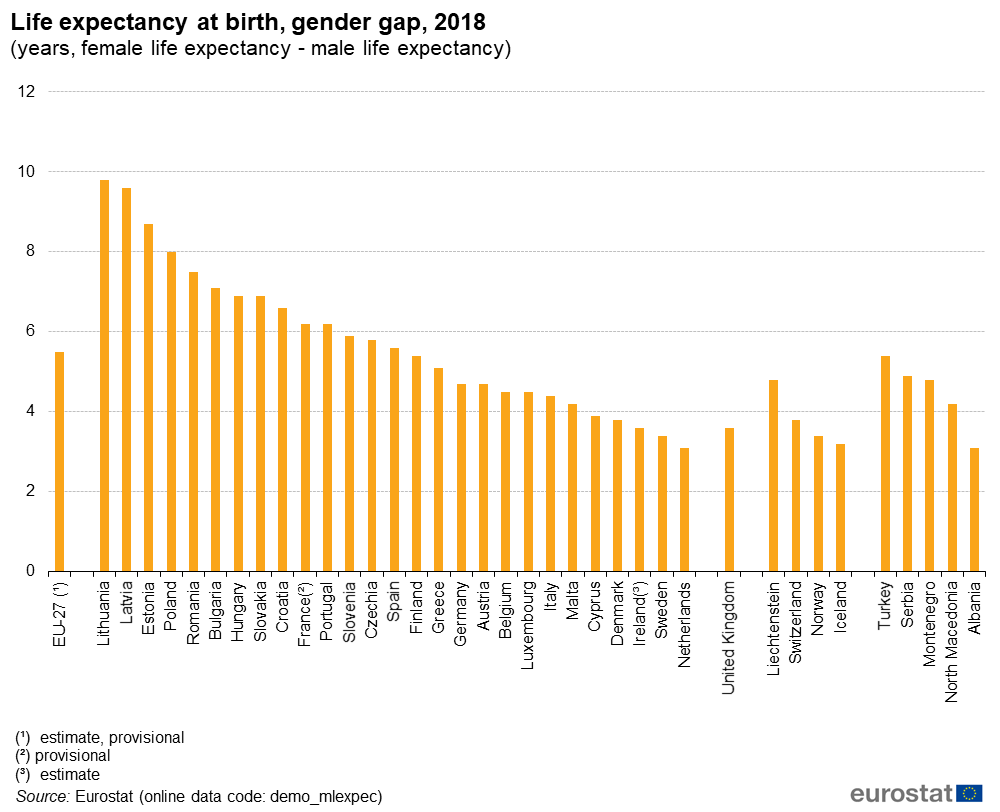
Life expectancy at birth, gender gap, 2018 (years, female life expectancy - male life expectancy).png
(
file
)
76 KB
1
18:31, 22 July 2020
Life expectancy at birth, EU-27, 2002-2018 (years).png
(
file
)
37 KB
1
18:30, 22 July 2020
Number of deaths, EU-27, 1962-2018 (million).png
(
file
)
31 KB
1
15:12, 8 July 2020
Population and population change statistics YB2020.xlsx
(
file
)
89 KB
1
15:11, 8 July 2020
Population, EU-27, 1960-2020 (at 1 January, million persons).png
(
file
)
39 KB
2
14:14, 8 July 2020
Crude rates of population change, 2017-19 (per 1 000 persons).png
(
file
)
102 KB
3
14:11, 8 July 2020
Contribution of natural change and net migration (and statistical adjustment) to population change, 2019.png
(
file
)
38 KB
1
11:31, 8 July 2020
Demographic balance, 2019 (thousands).png
(
file
)
102 KB
1
11:31, 8 July 2020
Births and deaths, EU-27, 1961-2019 (million).png
(
file
)
40 KB
1
11:30, 8 July 2020
Population change by component (annual crude rates), EU-27, 1960-2019 (per 1 000 persons).png
(
file
)
72 KB
2
09:07, 12 May 2020
Fertility statistics YB2020.xlsx
(
file
)
77 KB
updated EU27 in Table 1.
3
09:01, 12 May 2020
Total fertility rate, 1960–2018 (live births per woman).png
(
file
)
82 KB
corrected EU27 values
3
13:56, 11 May 2020
Fertility indicators, EU-27, 2001–2018.png
(
file
)
52 KB
2
13:56, 11 May 2020
Fertility indicators, 2018.png
(
file
)
54 KB
2
13:55, 11 May 2020
Fertility rate by mother's age group, EU-27, 2001, 2010 and 2018.png
(
file
)
59 KB
2
09:46, 11 May 2020
Share of live births by birth order, 2018 (%).png
(
file
)
98 KB
1
09:40, 11 May 2020
Number of live births, EU-27, 1961–2018 (million).png
(
file
)
35 KB
1
11:17, 16 January 2020
Contribution of natural change and net migration (and statistical adjustment) to population change, 2018.png
(
file
)
37 KB
3
18:14, 8 July 2019
Crude rates of population change, 2016-18 (per 1 000 persons).png
(
file
)
69 KB
1
18:13, 8 July 2019
Population change by component (annual crude rates), EU-28, 1960-2018 (per 1 000 persons).png
(
file
)
39 KB
1
18:05, 8 July 2019
Population, EU-28, 1960-2019 (at 1 January, million persons).png
(
file
)
23 KB
1
18:04, 8 July 2019
Demographic balance, 2018 (thousands).png
(
file
)
72 KB
1
17:29, 8 July 2019
Births and deaths, EU-28, 1961-2018 (million).png
(
file
)
25 KB
1
15:34, 7 March 2019
Number of live births, EU-28, 1961–2017 (million).png
(
file
)
21 KB
1
18:38, 24 January 2013
Crude divorce rate, 1960-2011 (1) (per 1 000 inhabitants).png
(
file
)
25 KB
1
18:37, 24 January 2013
Crude marriage rate, 1960-2011 (per 1 000 inhabitants).png
(
file
)
28 KB
1
17:58, 23 October 2012
Life expectancy at age 65, selected years (years).png
(
file
)
51 KB
1
17:57, 23 October 2012
Life expectancy at birth, selected years (years).png
(
file
)
54 KB
2
15:15, 23 October 2012
Total fertility rate, selected years (live births per woman).png
(
file
)
34 KB
1
15:38, 22 October 2012
Median age of population, 1991 and 2011 (years).png
(
file
)
12 KB
2
15:33, 22 October 2012
Change in the share of the population aged 65 years or over between 1991 and 2011 (percentage points).png
(
file
)
10 KB
2
18:38, 19 October 2012
Demographic balance, 2011 (thousand persons).png
(
file
)
42 KB
1
18:37, 19 October 2012
Births and deaths, EU-27, 1961-2011 (1) (million persons).png
(
file
)
14 KB
1
15:33, 18 October 2011
European population compared with other regions of the world 2012.xls
(
file
)
143 KB
2
15:03, 18 October 2011
Old-age dependency ratio (1) (population aged 65 years and over as % of population aged 15-64).png
(
file
)
10 KB
2
15:01, 18 October 2011
Fertility and mortality (1).png
(
file
)
8 KB
2
14:59, 18 October 2011
Population (1) (1960=100).png
(
file
)
3 KB
2
14:57, 18 October 2011
Population and population density.png
(
file
)
8 KB
2
14:55, 18 October 2011
World population.png
(
file
)
9 KB
2
First page
Previous page
Next page
Last page
Special page
ISSN 2443-8219
.png)
.png)
.png)
.png)
_(%25).png)
.png)
.png)
.png)
.png)
.png)
.png)
.png)
.png)
.png)
_to_population_change,_2019.png)
.png)
.png)
,_EU-27,_1960-2019_(per_1_000_persons).png)
.png)


.png)
.png)
_to_population_change,_2018.png)
.png)
,_EU-28,_1960-2018_(per_1_000_persons).png)
.png)
.png)
.png)
.png)
_(per_1_000_inhabitants).png)
.png)
.png)
.png)
.png)
.png)
.png)
.png)
_(million_persons).png)
_(population_aged_65_years_and_over_as_%25_of_population_aged_15-64).png)
.png)
_(1960%3D100).png)

