SDG 5 - Gender equality
Achieve gender equality and empower all women and girls
Data extracted in April 2023.
Planned article update: June 2024.
Highlights

This article is a part of a set of statistical articles, which are based on the Eurostat publication 'Sustainable development in the European Union — Monitoring report on progress towards the SDGs in an EU context — 2023 edition'. This report is the seventh edition of Eurostat's series of monitoring reports on sustainable development, which provide a quantitative assessment of progress of the EU towards the SDGs in an EU context.
SDG 5 aims to achieve gender equality by ending all forms of discrimination, violence and any harmful practices against women and girls. It also calls for the full participation of women and equal opportunities for leadership at all levels of decision-making.
Full article
Gender equality in the EU: overview and key trends
Ending all forms of discrimination against women and girls and empowering women are crucial to accelerating sustainable development in the EU. Thus, monitoring SDG 5 in an EU context focuses on the topics of gender-based violence, access to quality education, participation in employment, equal payment and a balanced representation in leadership positions. Over the assessed five-year period, the EU has made strong progress in most of these areas. The gender gaps for certain labour market-related indicators have narrowed, even though stronger progress will be needed to reach the 2030 target of halving the gender employment gap. Moreover, the EU has improved in terms of women occupying leadership positions, but differences between women and men remain far from parity. The situation is reversed in the area of participation in education. While the gender gap for early school leaving is narrowing, men continue to fall further behind women in terms of tertiary educational attainment levels.
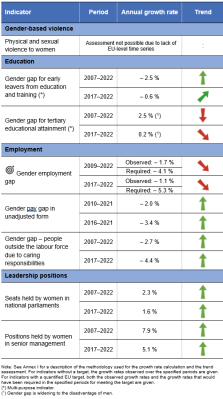
Table 1: Indicators measuring progress towards SDG 5, EU
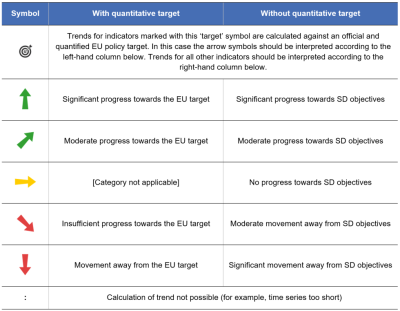
Table 2: Explanation of symbols for indicating progress towards SD objectives and targets


Gender-based violence
Gender-based violence is a brutal form of discrimination and a violation of fundamental human rights. It is both a cause and a consequence of inequalities between women and men. Physical and sexual violence against women affects their health and well-being. Moreover, it can hamper women's access to employment and harm their financial independence and the economy overall.
One in three women in Europe has experienced physical and/or sexual violence since the age of 15
In 2012, a survey from the European Union Agency for Fundamental Rights (FRA) revealed that 8 % of women in the EU had experienced physical and/or sexual violence by a partner or non-partner in the 12 months prior to the interview. Younger women were more likely to report having been subjected to violence; 12 % of women aged 18 to 29 had experienced physical or sexual violence in the 12 months prior to the interview, whereas 5 % of women aged 50 to 59 had been affected. Over a longer time period, every third woman (33 %) in the EU reported having experienced physical or sexual violence since the age of 15 in the FRA survey from 2012 [1] In 2022, Eurostat published the first results of a new EU survey on gender-based violence against women. While the full sample of this new data collection is not yet available, the released data for the first batch of countries show that in France, Austria and the Netherlands more than a third of women have experienced physical or sexual violence during their adulthood, with the highest share of more than 40 % in the Netherlands [2]. Women with disabilities are even more likely to be a victim of physical and/or sexual violence, at a rate that is two to five times higher than the rate for women without disabilities [3].
Data from official crime statistics on intentional homicide and sexual offences show that women are much more likely to be a victim of such crimes than men. In 2020, 49 out of 100 000 women were victims of sexual assault, and 28 out of 100 000 women were victims of rape. The rates were significantly lower for men, with 9 per 100 000 men for sexual assault and 3 out of 100 000 men for rape [4]. Moreover, women are about twice as likely as men to be a victim of intentional homicide by family and relatives or their intimate partner. In 2020, 0.4 out of 100 000 women were victims of such homicide, compared with only 0.2 per 100 000 men [5]. In Western Europe this type of homicide notably increased during the pandemic [6].
The prevalence of violence varies greatly across the EU. However, caution is needed when comparing countries' official crime statistics. Their comparability can be affected, for example, by different legal and criminal justice systems or criminal law and legal definitions such as those concerning offenders, victims or prosecutable age. Also, aspects such as the organisation and efficiency of the police, prosecution and courts or recording and reporting systems contribute to cross-country differences [7]. The limitations of comparability also include the stigma associated with disclosing cases of violence against women in certain settings and to certain people, including to interviewers. In addition, Member States that rank highest in terms of gender equality also tend to report a greater prevalence of violence against women. This may indicate a greater awareness and willingness of women in these countries to report violence to the police or to an interviewer [8].
Education
Education is a driving force for social change and a condition for the achievement of fundamental human rights. Also, equipping people with the right skills allows them to find quality jobs and improve their chances in life and thus combat the risks of social exclusion. Economic independence also makes it easier to leave a difficult situation, such as a violent home [9]. In education and training, it is important to eliminate gender stereotypes and promote gender balance in traditionally 'male' or 'female' fields. In general, equal access to quality education and training is thus an important foundation for gender equality and an essential element of sustainable development.
Young women outperform men in terms of education
Women overall tend to perform better than men when it comes to early leaving from education and training in the EU. In 2022, 11.1 % of men and 8.0 % of women aged 18 to 24 had left education and training earlier, meaning with at most lower secondary education while not being in further education and training. Although this gap narrowed between 2002 and 2016, it widened again over the following four years. Since 2020, women's early leaving rate has stagnated at 8.0 %, while the rate for men fell by 0.8 percentage points. As a result, the gender gap in 2022 was slightly below the value recorded five years earlier, but remained substantial, at 3.1 percentage points.
A major expansion in higher education systems has taken place in the EU since the early 2000's, when the Bologna process put in motion a series of reforms to make European higher education more compatible, comparable, competitive and attractive for students. As a result, the share of the population aged 25 to 34 who completed tertiary education increased steadily between 2002 and 2022. The increase was particularly strong for women, whose tertiary educational attainment rate rose from 25.3 % in 2002 to 47.6 % in 2022. For men, the increase was slower, from 21.0 % to 36.5 %. This caused the gender gap to surge from 4.3 percentage points to 11.1 percentage points between 2002 and 2022.
Employment
Ensuring high employment rates for both men and women is one of the EU's key targets. Reducing the wide gender employment gap, which measures the difference between the employment rates of men and women aged 20 to 64, is important for equality and a sustainable economy. The European Pillar of Social Rights Action Plan consequently includes the target of at least halving the gender employment gap by 2030 compared with 2019. Women tend to be more highly educated than men in most EU countries. Despite this, women are still paid less, as evidenced by the persistent gender pay gap. Women in the EU are over-represented in low-paid sectors and under-represented in well-paid sectors. Because of the gender pay gap, and interrupted and shorter working lives, women earn less over their lifetime than men. The correlation between women's lower employment rate and caring responsibilities aggravates women's risk of poverty and social exclusion, especially in old age, as employment and pay gaps largely influence the gender pension gap.
Women are still less likely to be employed than men, and the EU is not on track to halving its gender employment gap by 2030
Employment rates for women are an indication of a country's social customs, attitudes towards women in the labour force and family structures in general [10]. Parenthood and caring responsibilities, limited access to quality childcare and monetary disincentives to participate in the labour market have a negative impact on the gender employment gap [11]. Parenthood and caring responsibilities, limited access to quality childcare and monetary disincentives to participate in the labour market have a negative impact on the gender employment gap [12].
In the EU, the employment rate for women grew from 60.6 % in 2009 to 69.3 % in 2022. For men, the rate started from a higher value and increased more slowly, from 74.0 % in 2009 to 80.0 % in 2022 (see the article on SDG 8 'Decent work and economic growth' for more detailed analyses on employment rates). As a result, the gender employment gap narrowed by 2.7 percentage points between 2009 and 2022. Most of this decrease took place in the period leading up to 2014, with the gap remaining at just over 11 percentage points until 2020 and further decreasing during the next two years. Although the drop to 10.7 percentage points in 2022 represents a new record low, it also means that the proportion of working-age men in employment still considerably exceeds that of women. Moreover, the gap is not narrowing quickly enough for the EU to be on track to meeting its 2030 target of at least halving the gender employment gap compared with 2019. Meeting this target would require the difference between men's and women's employment rates to be reduced to 5.6 percentage points or lower.
An analysis by degree of urbanisation shows a variation in the gender employment gap between cities, towns and suburbs and rural areas. In 2022, the gap was smallest in cities, at 8.9 percentage points, while it amounted to 11.8 percentage points in rural areas and 12.1 percentage points in towns and suburbs [13].
There is also a clear difference between employed women and men aged 20 to 64 when looking at the rate of part-time working. In 2022, 27.8 % of women in this age group worked part-time, while this was the case for only 7.6 % of men. This difference resulted in a gender gap of 20.2 percentage points for part-time employment. Caring responsibilities for children or for adults with disabilities were a main reason for this gap. In 2022, 27.1 % of women working part-time reported caring responsibilities as the main reason for doing so, compared with only 6.3 % for men [14]. The gender gap for employed persons with temporary contracts was much less pronounced, at 2.5 percentage points in 2022 (12.4 % of women and 9.9 % of men) [15].
The COVID-19 pandemic further highlighted ongoing challenges related to women's participation in the labour market. According to the Joint Employment Report 2022, there is no evidence of a stronger negative impact on employment rates of women compared with men, but women experienced a steeper fall in working hours than men during confinement periods. Reasons behind these developments can be found in differences in the representation of women and men in sectors and occupations affected by the crisis, but also in gender differences in working from home [16] and the fact that women took on the larger share of caring responsibilities [17]. In addition, single women with children experienced larger employment losses during the pandemic than those without children. This underlines the importance of child-care and long-term care services to increase the labour market participation of women [18].
The gender pay gap has decreased slightly in recent years but remains considerable
Women do not only have lower employment rates than men, they also tend to earn less. Between 2016 and 2021, the gender pay gap narrowed by 2.4 percentage points in the EU. However, in 2021, women's gross hourly earnings in the EU were still on average 12.7 % below those of men.
There are various reasons for the existence and size of the gender pay gap. A part of the difference in earnings between men and women may be explained by the 'sectoral gender segregation', meaning that women tend to be concentrated in the low-paying economic sectors such as education and health, whereas men tend to work more in the finance and IT sectors. Similarly, the 'occupational gender segregation' may also explain the difference in earnings between men and women because men are more likely to be promoted to supervisory and management positions than women due to discrimination or self-restraints. The term 'glass ceiling' is usually used as a metaphor to describe an invisible barrier that keeps women from rising beyond a certain level in an enterprise's hierarchy [19]. Moreover, the inequalities that women face in gaining access to work, career progression and rewards, along with the consequences of career breaks or part-time work due to caring responsibilities, labour market segregation, the parenthood penalty and stereotypes about the roles of men and women are inevitably linked to the persistent gender pay gap.
More women than men are outside the labour force due to caring responsibilities
Women still tend to take on a larger share of caring responsibilities for children and other family members. In 2022, 0.9 % of the total population (aged 20 to 64) was outside of the labour force due to caring responsibilities, which can be attributed to the lack of available, accessible and quality formal care services, especially for children [20]. By comparison, 1.5 % of women were economically inactive due to caring responsibilities in 2022, which was five times higher than the rate of 0.3 % for men. This resulted in a gender gap of 1.2 percentage points. The overall inactivity rate due to caring responsibilities has stagnated at around 1.0 % since 2017. For women, the rate fell by 0.3 percentage points, while the share of men being outside the labour force due to caring responsibilities remained at 0.3 % over the past five years. As a result, the gender gap has narrowed by 0.3 percentage points since 2017.
Leadership positions
Traditional gender roles, a lack of support to allow women and men to balance care responsibilities with work, and political and corporate cultures are some of the reasons why women are underrepresented in decision-making processes. Promoting equality between women and men in this area is one of the priorities the EU has set for achieving gender equality.
The increase in the share of seats held by women in national parliaments stalled in 2022
Women held 32.5 % of seats in national parliaments in the EU in 2022. This share increased steadily between 2003 and 2021, but experienced a decline in 2022 compared with the peak in 2021 of 33.1 %. While differences between Member States vary greatly, from 46.4 % seats held by women in Sweden to 13.1 % in Hungary, there was no single EU country in 2022 where women held the most seats. Contributing to this under-representation is the fact that women seldom become leaders of major political parties, which are instrumental in forming future political leaders. Another factor is that gender norms and expectations reduce the pool of female candidates for selection as electoral representatives. The share of female members of government (senior and junior ministers) in the EU was still lower than for men at 33.9 % in 2022, although this was an 11.3 percentage point increase from 22.6 % in 2003. The number of female heads of government in EU countries has also shown an increase. In 2022, there were on average six female heads of government compared with none in 2003. Over the whole period from 2003 to 2022, the highest share of female heads of government was observed in 2022 with 22.2 %, meaning that there were never more than six women in this executive position at the same time [21].
In 2022, almost a third of board members of the largest listed companies were women
Women held 32.2 % of board positions in the largest listed companies in 2022. This level of representation was achieved after a steady 24.0 percentage point increase since 2003. However, the numbers mean the clear majority of board members of the largest listed companies are still men. The data nevertheless provide evidence of the positive impact of legislative action on the issue of female representation in boards [22].
Presentation of the main indicators
Physical and sexual violence to women

This indicator is based on the results of a survey by the European Union Agency for Fundamental Rights (FRA). Women were asked whether they had experienced physical and/or sexual violence within the 12 months prior to the interview.
_2023.png)
Source: European Union Agency for Fundamental Rights (FRA), Eurostat (sdg_05_10)
_2023.png)
Source: European Union Agency for Fundamental Rights (FRA), Eurostat (sdg_05_10)
Gender employment gap

The gender employment gap is defined as the difference between the employment rates of men and women aged 20 to 64. The employment rate is calculated by dividing the number of people aged 20 to 64 in employment by the total population of the same age group. The indicator is based on the EU Labour Force Survey (EU-LFS).
.png)
.png)
Source: Eurostat (sdg_05_30)
Gender pay gap in unadjusted form

The gender pay gap in unadjusted form represents the difference between average gross hourly earnings of male paid employees and of female paid employees as a percentage of average gross hourly earnings of male paid employees. The indicator has been defined as unadjusted because it gives an overall picture of gender inequalities in terms of pay and measures a concept which is broader than the concept of equal pay for equal work. The gender pay gap is based on the methodology of the structure of earnings survey (SES), which is carried out every four years.
.png)
Source: Eurostat (sdg_05_20)
.png)
Source: Eurostat (sdg_05_20)
People outside the labour force due to caring responsibilities

The population outside the labour force comprises individuals who are not working, not actively seeking work or not available to work even if they have found a job. Therefore, they are neither employed nor unemployed. This definition used in the EU Labour Force Survey (EU-LFS) is based on the guidelines of the International Labour Organization. The reasons for economic inactivity covered by this indicator include 'care of adults with disabilities or children' and 'other family or personal reasons'.
.png)
Source: Eurostat (sdg_05_40)
_2023.png)
Source: Eurostat (sdg_05_40)
Seats held by women in national parliaments

This indicator refers to the proportion of women in national parliaments in both chambers (lower house and upper house, where relevant). The data stem from the Gender Statistics Database of the European Institute for Gender Equality.
.png)
Source: European Institute for Gender Equality (EIGE), Eurostat (sdg_05_50)
.png)
Source: European Institute for Gender Equality (EIGE), Eurostat (sdg_05_50)
Positions held by women in senior management

This indicator measures the share of female board members in the largest publicly listed companies. The data presented in this section stem from the Gender Statistics Database of the European Institute for Gender Equality.
.png)
Source: European Institute for Gender Equality (EIGE), Eurostat (sdg_05_60)
.png)
Source: European Institute for Gender Equality (EIGE), Eurostat (sdg_05_60)
Direct access to
More detailed information on EU SDG indicators for monitoring of progress towards the UN Sustainable Development Goals (SDGs), such as indicator relevance, definitions, methodological notes, background and potential linkages, can be found in the introduction of the publication 'Sustainable development in the European Union — Monitoring report on progress towards the SDGs in an EU context — 2023 edition'.
Further reading on gender equality
- European Union (2022). Gender pay gaps in the European Union – a statistical analysis. Publications Office of the European Union, Luxembourg
- European Commission (2023), Joint Employment Report 2023, Directorate-General for Employment, Social Affairs and Inclusion, Brussels.
- European Commission (2023), 2023 Report on gender equality in the EU.
- European Institute for Gender Equality (2021), Gender inequalities in care and consequences for the labour market.
- Encinas-Martín, M. and M. Cherian (2023), Gender, Education and Skills: The Persistence of Gender Gaps in Education and Skills, OECD Skills Studies, OECD Publishing, Paris.
- UN Women (2022), Gender equality for health and well-being: Evaluative evidence of interlinkages with other SDGs.
- UN Women (2022), Progress on the Sustainable Development Goals: The gender snapshot 2022.
- World Economic Forum (2022), The Global Gender Gap Report 2022.
Further data sources on gender equality
Notes
- ↑ European Union Agency for Fundamental Rights (2014), Violence against women: an EU-wide survey, Main results, Publications Office of the European Union, Luxembourg, p. 17.
- ↑ Source: Eurostat (gbv_any_type).
- ↑ European Parliament (2018), European Parliament resolution of 29 November 2018 on the situation of women with disabilities (2018/2685(RSP)).
- ↑ Source: Eurostat (CRIM_HOM_SOFF).
- ↑ Source: Eurostat (CRIM_HOM_VREL).
- ↑ United Nations Office on Drugs and Crime (2022), Gender-related killings of women and girls (femicide/feminicide).
- ↑ For more information see Eurostat metadata on Crime and criminal justice (crim).
- ↑ European Union Agency for Fundamental Rights (2014), Violence against women: an EU-wide survey, Main results, Publications Office of the European Union, Luxembourg, p. 25-26, 32.
- ↑ European Institute for Gender Equality (2016), Gender in education and training, p. 3.
- ↑ International Labour Organisation (2015), Key Indicators of the Labour market: Full report, Ninth Edition, International Labour Office, Geneva, p. 17.
- ↑ International Labour Organisation (2015), Key Indicators of the Labour market: Full report, Ninth Edition, International Labour Office, Geneva, p. 17.
- ↑ European Commission (2019), Proposal for a Joint Employment Report from the Commission and the Council accompanying the Communication from the Commission on the Annual Sustainable Growth Survey 2020, COM(2019) 653 final, Brussels.
- ↑ Source: Eurostat (TEPSR_LM230).
- ↑ Source: Eurostat (LFSA_EPGAR).
- ↑ Source: Eurostat (LFSI_PT_A).
- ↑ See also Eurofound (2020), Living, working and COVID-19, COVID-19 series, Publications Office of the European Union, Luxembourg.
- ↑ See also OECD (2021), Caregiving in crisis: Gender inequality in paid and unpaid work during COVID-19.
- ↑ European Commission, Directorate-General for Employment, Social Affairs and Inclusion (2021), Proposal for a Joint Employment Report 2022, Brussels.
- ↑ Eurostat (2021), Gender pay gaps in the European Union - a statistical analysis. Publications Office of the European Union, Luxembourg.
- ↑ European Commission (2017), Draft Joint Employment Report from the Commission and the Council accompanying the Communication from the Commission on the Annual Growth Survey 2018, COM(2017) 674 final, Brussels, p. 57.
- ↑ European Institute for Gender Equality, Gender Statistics Database (National governments: presidents and prime ministers).
- ↑ European Commission (2021), Report on gender equality in the EU, p. 37.