European Neighbourhood Policy - East - indicators for sustainable development goals
Data extracted in February 2023.
Planned article update: April 2024.
Highlights
Infant mortality decreased in all European Neighbourhood Policy – East (ENP-East) countries over the period 2010-2020. Ukraine had the lowest infant mortality rate among the ENP-East countries in 2020 but this was still twice the rate in the EU.
The unemployment rate in 2021 was lower for women than for men in Armenia, Moldova and Georgia. In the EU, female unemployment was higher than male in 2021.
Among the ENP-East countries, the youth unemployment rate in 2021 was the lowest in Moldova at 9.2 %, followed by Azerbaijan at 14.2 % and Ukraine at 19.1 %. It was higher in Georgia at 30.5 % and Armenia at 42.9 %. In the EU, the youth unemployment rate in 2021 was 16.6%.
Infant mortality rate, 2010-2020 (per thousand live births)
This article is part of an online publication; it presents information for five European Neighbourhood Policy-East (ENP-East) countries, namely, Armenia, Azerbaijan, Georgia, Moldova and Ukraine, compared with the European Union (EU). Georgia, Moldova and Ukraine also all became enlargement countries in 2022, the European Council giving the three a European perspective and granting Moldova and Ukraine candidate status on 23 June 2022. This article does not contain any data on Belarus, as statistical cooperation with Belarus has been suspended as of March 2022.
Data shown for Georgia exclude the regions of Abkhazia and South Ossetia over which Georgia does not exercise control. The data managed by the National Bureau of Statistics of the Republic of Moldova does not include data from Transnistria over which the government of the Republic of Moldova does not exercise control. Since 2014, data for Ukraine generally exclude the illegally annexed Autonomous Republic of Crimea and the City of Sevastopol and the territories which are not under control of the Ukrainian government. The latest statistics in this Statistics Explained article cover the calendar year 2021, before Russia’s invasion of Ukraine. Data on Ukraine for the year 2021 is limited due to exemption under the martial law from mandatory data submission to the State Statistics Service of Ukraine, effective as of 3 March 2022.
This article covers a selection of the sustainable development goals, their indicators and the data available to measure progress towards the goals in the ENP-East countries and the European Union. It starts with an outline of the SDGs and the EU’s approach to them. It continues with outline data on the following SDGs: SDG 1 - Ending poverty in all of its forms across the world; SDG 3 - Ensuring healthy lives and promote well-being; SDG - 7 Ensure access to affordable, reliable, sustainable and modern energy for all; SDG 8 - Promoting sustained, inclusive and sustainable economic growth, full and productive employment and decent work for all; and SDG 17 - Strengthening the means of implementation and revitalising the global partnership for sustainable development.
Full article
Sustainable development goals
In September 2015, the United Nations (UN) adopted an agenda titled Transforming our world: the 2030 agenda for sustainable development.
In order to keep track of the European Union (EU)’s progress for delivering this 2030 agenda in a systematic and transparent way, Eurostat, together with other services of the European Commission (EC), seeks to highlight, through the release of a wide range of official statistics, the progress being made and the challenges being faced with respect to the 17 sustainable development goals (SDGs).
Both the UN and the EU have established detailed indicator lists for regular monitoring of the SDGs. This article presents ad-hoc information for ENP-East countries and is based on indicators that currently form part of Eurostat’s regular data collection exercise for ENP-East countries, rather than a specific data collection exercise related to SDGs. The data can be found in Eurostat’s online database (Eurobase).
This article follows a descriptive approach, presenting a statistical picture for sustainable development goals that have been selected primarily on the basis of data availability. In consequence, the article covers only 5 of the 17 SDGs. It provides a summary of the targets developed by the UN for each of these five goals and presents specific indicators — among those selected by the UN — to measure progress being made towards achieving these goals.
Ending poverty in all of its forms across the world
Sustainable Development Goal 1 is concerned with ‘Ending poverty in all of its forms across the world’. One of the targets measuring progress concerns reducing by at least half the proportion of men, women and children of all ages who are living in poverty, according to national definitions, by 2030 (Target 1.2). To do so, the UN has defined Indicator 1.2.1 as the proportion of population living below the national poverty line, by sex and age.
The at-risk-of-poverty rate is the proportion of the population with an equivalised disposable income below the at-risk-of-poverty threshold. This indicator can be calculated both before and after social transfers; the difference between the two reflects the proportion of the population moved above the threshold as a result of receiving social transfers. Social transfers comprise benefits such as old-age and survivors’ (typically widows’ and widowers’) pensions; unemployment, family-related, sickness and invalidity, education-related and other benefits; housing allowances; and social assistance.
The proportion of the population considered to be at-risk-of-poverty after social transfers is presented in Figure 1; this share is calculated in relation to those living with an income that is below 60 % of the national median equivalised income, the most commonly used definition for the poverty line. This is a relative measure because it is calculated separately for each country. A person who is below the poverty line in one country might have the same income as someone above the poverty line in another country. As the poverty threshold is set independently for each country, the at-risk-of-poverty indicators reflect low incomes in comparison with other residents of the same country. This does not necessarily imply an absolute low standard of living for all those below the threshold.
The data shown in Figure 1 is presented as following any redistribution of income, so includes social transfers. Among the ENP-East countries for which data on the at-risk-of-poverty rate after social transfers is available for 2021 (or latest available data), the highest rate was observed in Armenia at 27.0 % (2020 data), followed by Ukraine at 23.4 %; Moldova, at 22.6 %; and Georgia, at 18.9 %.
Most of the ENP-East countries for which data is available showed a decline in the proportion of the population at risk of poverty after transfers over the period 2011-2021, although most countries made changes to the data series during this period. A decline of 8.0 percentage points (pp) was recorded in Armenia between 2011 and 2020 (no data available for 2020), still the highest among the ENP-East countries. Georgia had the next largest reduction of 4.1 pp in the ten years to 2021. The decline was moderate in Ukraine, at 0.9 pp. Moldova showed an increase of 2.4 pp in the proportion of the population at risk of poverty after transfers. Data for Azerbaijan are not available.
In the EU, the share of the population that was living at risk of poverty in 2021 was 16.8 % after social transfers were taken into account. This was 0.1 pp lower than the rate estimated in 2011, although there was a break in the data series in 2020.
Statistics on poverty for the ENP-East are discussed in greater detail in the dedicated Statistics Explained article on European Neighbourhood Policy – East living conditions statistics.
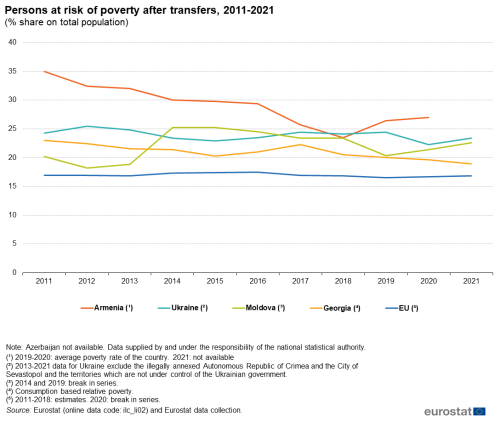
(% share on total population)
Source: Eurostat (ilc_li02) and Eurostat data collection.
Ensure healthy lives and promote well-being

Sustainable Development Goal 3 seeks to ‘ensure healthy lives and promote well-being’. Within this context, Target 3.2 is focused on child mortality, including ending preventable deaths of new-born children by 2030. All countries aim to reduce neonatal mortality to 12 deaths or fewer per 1 000 live births.
Traditionally, official statistics have measured the infant mortality rate, which is based on the number of children dying before their first birthday per 1 000 live births. SDG indicator 3.2.2 instead measures the neonatal mortality rate: deaths of new-borns during the first 28 days of life. As with the infant mortality rate, the results for the neonatal mortality rate are expressed per 1 000 live births.
Figure 2 shows that infant mortality rates fell in all the ENP-East countries over the period 2010-2020. The smallest fall occurred in Azerbaijan, where the infant mortality rate declined by 1.3 per 1 000 live births to 9.8 in 2020, the highest level among the group of countries. In Moldova, the infant mortality rate in 2010 was 11.8 per 1 000 live births, the highest among the ENP-East countries in that year. Moldova then recorded a fall of 3.1 per 1 000 live births over the decade to 8.7 per 1 000 live births in 2020. Georgia had a similar decline of 3.3 per 1 000 live births over 2010-2020 to 7.9 per 1 000 live births. Armenia saw a fall of 4.1 per 1 000 live births during 2010-2020, the largest among the ENP-East countries, to 7.3 per 1 000 live births. Ukraine recorded the lowest infant mortality rate among the ENP-East countries in 2020, at 6.8 per 1 000 live births in 2020, a decline of 2.4 per 1 000 live births from 2010. For comparison, the EU infant mortality rate fell over 2010-2020 by 0.7 per 1 000 live births to 3.3 per 1 000 live births.
Data for neonatal mortality rates following SDG indicator 3.2.2 are presented in Figure 3 for 2010 and 2020. This statistic is not available for the EU as a whole, as data for some Member States are not available. Instead, the figure shows available data for the individual EU Member States with the highest and lowest rates in 2020.
As with the data for infant mortality rates, EU Member States and the ENP-East countries generally reported a fall in their neonatal mortality rates over the period 2010 to 2020. The exceptions were Luxembourg, where the rate is quite volatile due to its small population size, and Sweden, where the rise was marginal.
Among the ENP-East countries, the highest infant mortality rate in 2020 occurred in Moldova with 6.3 deaths per 1 000 live births, a decline of 1.2 deaths per 1 000 live births from 2010. The second highest rate was reported by Armenia with 5.6 deaths per 1 000 live births, 1.6 deaths per 1 000 live births lower than in 2010. The fall in infant mortality was most notable in Georgia, down 2.9 deaths per 1 000 live births to 5.2 deaths per 1 000 live births in 2020. Azerbaijan had 4.8 deaths per 1 000 live births in 2020, a decline of 1.6 deaths per 1 000 live births from 2010. Ukraine had the lowest neonatal mortality rate among these countries in 2020, at 4.6 deaths per 1 000 live births, a decline of 1.0 deaths per 1 000 live births from 2010.
All of the ENP-East countries and EU Member States that are shown in Figure 3 had neonatal mortality rates that were well below the UN target for Indicator 3.2.2: a rate of no more than 12 deaths per 1 000 live births.
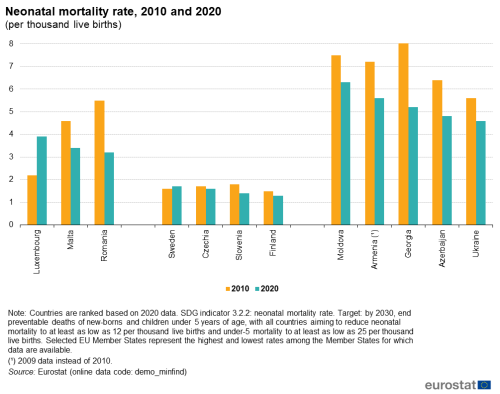
per thousand live births
Source: Eurostat (demo_minfind)
Ensure access to affordable, reliable, sustainable and modern energy for all
SDG 7 seeks to ‘ensure access to affordable, reliable, sustainable and modern energy for all’. SDG Target 7.3 aims to, ‘by 2030, double the global rate of improvement in energy efficiency’. SDG indicator 7.3.1 examines progress on Target 7.3 by measuring energy intensity in terms of primary energy and GDP. Another associated SDG target is 7.2: ‘by 2030, increase substantially the share of renewable energy in the global energy mix’. SDG indicator 7.2.1 accordingly measures the share of renewable energy in total final energy consumption.
The level of energy intensity in a country can be affected by factors such as climate or economic structure, as well as by energy efficiency measures. Over time, a change in the mix of economic activities can also affect energy intensity. Taking these issues into account, reduction in energy intensity is used as a proxy for increased energy efficiency. Energy intensity is defined as the gross inland consumption of energy in relation to constant price gross domestic product (GDP). The indicator therefore measures the energy supplied to the economy per unit of economic output. If the ratio declines in a country over time, this indicates that less energy is required and so the economy has improved its energy efficiency. Energy intensity is here measured in kilogrammes (kg) of oil equivalent per € 1 000 GDP in volume terms, measured at 2010 base year prices.
Figure 4 shows energy intensity for reporting ENP-East countries: data is available only for Azerbaijan for 2011-2021. In Azerbaijan in 2021, energy intensity was 360 kg oil equivalent / € 1 000 GDP. This was higher than in 2011, when the measure of energy intensity was 320 kg oil equivalent / € 1 000 GDP. This corresponded to an increase in energy intensity of 12.5 %. The level of hydrocarbon production strongly affects these figures, as this sector dominates the economy in Azerbaijan.
In the EU, energy intensity decreased by 16.1 % over the period 2011-2021, from 139 to 117 kg of oil equivalent / € 1 000 GDP. Although this trend suggests that the economy was becoming more energy efficient, it may also be affected by changes in the mix of economic activities.
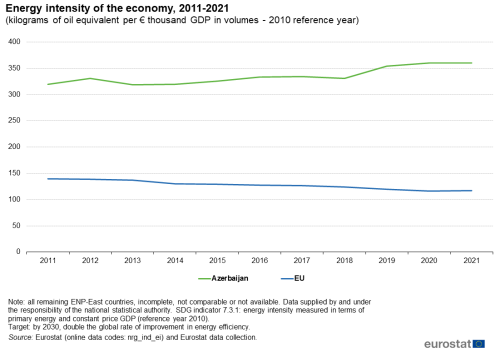
(kg of oil equivalent per € thousand GDP in volumes (2010 base year))
Source: Eurostat (nrg_ind_ei) and Eurostat data collection.
Figure 5 measures the share of energy from renewable sources as a percentage of gross final energy consumption over the period 2011-2021. The shares of renewable energy can fluctuate in any single year, reflecting the amount of wind, sun and rainfall available. Increases in renewable energy generating infrastructure show up as a trend over a longer period.
The highest shares of renewable energy in total energy consumption among the ENP-East countries were recorded in Georgia with 23.0 % (in 2020, latest data available) and by Moldova with 21.3 % in 2021. The shares of both countries were comparable to that of the EU, at 21.8 % in 2021. In Ukraine, the share of renewable energy was 9.2 % in 2020 (latest available data), an increase of 6.2 pp from 2011. This was the only substantial increase among the ENP-East countries, on the basis of available data. In Armenia, the share of renewable energy in final energy consumption was 8.4 % in 2020 (latest available data) and in Azerbaijan only 1.3 % in 2021. The low rate in Azerbaijan reflects the importance of the hydrocarbons sector in the economy.
This data needs to be viewed in the context of the ENP-East countries’ energy sectors, which are the subject of the dedicated Statistics Explained article on Energy statistics of the ENP-countries.
Promote sustained, inclusive and sustainable economic growth, full and productive employment and decent work for all
SDG 8 aims to ‘promote sustained, inclusive and sustainable economic growth, full and productive employment and decent work for all’.
Target 8.2: Productivity
Target 8.2 promotes ‘Higher levels of economic productivity through diversification, technological upgrading and innovation, including through a focus on high value added and labour-intensive sectors.’ Indicator 8.2.1 examines progress on this target as ‘Annual growth rate of real GDP per employed person’, a measure of productivity growth.
As shown in Figure 6, data showed that real GDP per person employed grew over the period 2011-2021 (or as available) in most of the ENP-East countries. Moldova (2011-2021) and Armenia (2011-2020) reported higher average annual growth in GDP per person employed than in other ENP-East economies over the period, with annual average increases of 4.8 % and 4.7 %, respectively. Georgia reported an annual average gain over 2011-2021 of 3.8 %. There was an average increase in productivity of 1.8 % in Ukraine during 2011-2021. For Azerbaijan, there was zero average productivity change over 2011-2021.
Most ENP-East countries recorded a fall in GDP per person employed in 2020. The exception was Ukraine, where there was minimal growth in this measure of productivity. These observations appear to be a consequence of the Covid-19 pandemic. In 2021, all ENP-East countries for which data is available reversed the 2020 fall, as their economies recovered. All observed their largest labour productivity growth of the period.
GDP per person employed rose by an average of 0.6 % in the EU over 2011-2021. There was a decline in the measure of productivity in 2020 and a partial recovery in 2021.

(annual rate of change, %)
Source: Eurostat (nama_10_lp_ulc), and (enpe_nama_10_lp)
Target 8.5: Employment and equal pay
SDG Target 8.5 concerns ‘achieving full and productive employment and decent work for all women and men, including for young people and persons with disabilities, and equal pay for work of equal value by 2030’. These developments are monitored though Indicator 8.5.2: unemployment rates by sex and age and for persons with disabilities.
The unemployment rate is defined as the share of unemployed persons in the labour force. The data for the EU Member States and for the ENP-East countries on unemployment mainly conform to internationally agreed definitions, based on the methodology of the International Labour Organisation (ILO).
Figure 7 shows the unemployment rate by sex for 2011 and 2021 for the ENP-East countries and the EU. In three of the ENP-East countries, Moldova, Armenia and Georgia, the unemployment rate for women was lower than the rate for men in 2021. In the EU, female unemployment rate was higher than male.
The overall unemployment rate in Georgia rose by 3.3 pp from 2011 to 2021, when it was the highest in the region at 20.6 %. Male unemployment rates increased more than female, so the male unemployment rate in 2021 was 22.7 %, higher than female at 17.8 %.
Although the overall unemployment rate in Armenia declined slightly by 1.1 pp from 2011 to 15.5 % in 2021, taking into account a change in definition, it remained the second highest in the region for both sexes and in total. The female unemployment rate had been higher than the male unemployment rate in 2011 but it fell by 2.8 pp over the period to 15.2 % in 2021. Meanwhile, the male unemployment rate rose by 0.4 pp to 15.7 % in 2021, now higher than female.
Azerbaijan recorded an increase in the overall unemployment rate of 0.6 pp between 2011 and 2021 to 6.0 %. This trend affected both men and women almost equally. The female unemployment rate was at 7.0 % in 2021 and remained higher than male, which was 4.9 %.
Ukraine’s total unemployment rate increased by 1.9 pp in the decade from 2011 to 9.8 % in 2021, although the data definition had been altered in the interim. The male unemployment rate increased during this period by 0.7 pp to 9.5 %, while the female unemployment rate rose more strongly by 3.3 pp to 10.1 %. While female unemployment was lower than male in 2011, it was higher in 2021.
In Moldova, the total unemployment rate fell by over half its previous rate to 3.2 % in 2021. The male unemployment rate fell more strongly by 3.8 pp to 3.9 %. The female unemployment rate went down by 3.1 points to 2.5 % over this time period, so it remained lower than male.
EU unemployment rates stood at 6.7 % for men, at 7.4 % for women and 7.0 % total in 2021. Male unemployment declined slightly more than female over the period 2011-2021, while the overall decline was 3.1 pp.

(% of persons aged 15-74)
Source: Eurostat (une_rt_a) and (enpe_lfsa_urgan)
SDG indicator 8.5.2 also requires an analysis of unemployment rates by age. Policy makers tend to focus their attention on both ends of working life, analysing employment opportunities for the young and the retention of older members of the workforce up to and beyond any official retirement age.
As shown in Figure 8, all of the ENP-East countries showed a decline in youth unemployment from 2011 to 2019. From 2019 to 2020, as a consequence of the Covid-19 pandemic, there was an increase for all the countries except Armenia, although the increase in Moldova was small. From 2020 to 2021, youth unemployment fell in all ENP-East countries except Georgia, although the decline in Ukraine was marginal. While definitions differ among ENP countries, youth unemployment appears to be considerably higher in Georgia and Armenia than the other ENP-East countries in both 2011 and 2021.
The fall in youth unemployment in Georgia over 2011-2019 was considerable at 9.4 pp. The trend was reversed during 2019-2021, with a very large increase of 12.5 pp to 42.9 %. Youth unemployment was among the highest among the ENP-East countries throughout the period.
Taking the period 2011-2017, before a break in the data series, youth unemployment in Armenia had fallen by less than 1.0 pp. From 2018 to 2021, there was a decline of 3.0 pp, although youth unemployment was still very high in 2021 at 30.5 %.
The country with the third highest youth unemployment rate in 2021 was Ukraine at 19.1 %. Over the comparable period 2014-2019, prior to the Covid-19 pandemic, youth unemployment declined by 7.7 pp. From 2019 to 2021, the rate increased by 3.7 pp.
Azerbaijan’s youth unemployment rate was relatively stable throughout the time period: the figure for 2021 was 14.2 %. Moldova had declining youth unemployment over the period. In 2021, the value was 9.2 %, the lowest among the ENP-East countries. Breaks in the data series in 2014 and 2019 should be noted.
The unemployed made up 16.6 % of all young people aged 15-24 years who were economically active, so either employed or unemployed, in the EU in 2021. This marked a reduction of 8.6 pp from the peak of 25.2 % recorded in 2013 and an increase of 1.0 pp from 2019.

(% of persons aged 15-24 years)
Source: Eurostat (une_rt_a) and (enpe_lfsa_urgan)
Further analysis of employment and unemployment in the ENP-East countries can be found in the dedicated Statistics Explained article on European Neighbourhood Policy - East - labour market statistics.
Strengthening the means of implementation and revitalising the global partnership for sustainable development

SDG 17 has the goal of ‘strengthening the means of implementation and revitalising the global partnership for sustainable development’. In recent decades, the internet has become an increasingly important tool for providing access to information: it can help foster access to and share knowledge of science, culture, technology and innovation. As part of this, Target 17.6 aims to ‘enhance north-south, south-south and triangular regional and international cooperation on and access to science, technology and innovation and enhance knowledge-sharing on mutually agreed terms, including through improved coordination among existing mechanisms, in particular at the United Nations level, and through a global technology facilitation mechanism’. The means of monitoring progress within this domain is provided by Indicator 17.6.1: the number of fixed internet broadband subscriptions per 100 inhabitants.
Figure 9 illustrates the progressive adoption of fixed broadband internet services in the ENP-East countries. These services started from lower levels than in the EU and rose at a much faster pace over the period 2011 to 2021. In Azerbaijan the ratio almost tripled, from 30 to 85 per 100 inhabitants. Since this includes mobile subscriptions, it is not comparable with the data for other countries. In Moldova, internet penetration rose from 20 per 100 inhabitants in 2016 to 29 in 2021. In Ukraine the ratio increased from 7 to 13 over 2010-2018, the latest year for which data is available.
The number of fixed broadband subscriptions per 100 inhabitants in the EU increased from 27 in 2011 to 38 in 2021.

(number per hundred inhabitants)
Source: Eurostat (demo_gind), Eurostat data collection and the International Telecommunication Union
Source data for tables and graphs
Data sources
The data presented in this article for ENP-East countries are supplied by and under the responsibility of the national statistical authorities of each country on a voluntary basis. The data result from an annual data collection cycle that has been established by Eurostat. These statistics are available free-of-charge on Eurostat’s website, together with a range of additional indicators for ENP-East countries covering most socio-economic topics.
Context
Sustainable development is a global concern that is linked to a wide range of economic, social and environmental challenges present within the world. However, sustainable development also provides opportunities, such as the potential to eliminate extreme poverty or measures that are designed to stimulate a sustainable path to economic growth.
In September 2015, the UN adopted a new agenda titled ‘Transforming our world: the 2030 agenda for sustainable development’. This is a long-term policy framework designed to bring about a systemic change in the way that economic growth, social cohesion and environmental protection go hand in hand. It addresses both poverty eradication and the economic, social and environmental dimensions of sustainable development, underpinned by good governance.
The agenda covers a set of 17 sustainable development goals (SDGs) — each designed to address a range of global challenges:
- no poverty;
- zero hunger;
- good health and well-being;
- quality education;
- gender equality;
- clean water and sanitation;
- affordable and clean energy;
- decent work and economic growth;
- industry, innovation and infrastructure;
- reduced inequalities;
- sustainable cities and communities;
- responsible consumption and production;
- climate action;
- life below water;
- life on land;
- peace, justice and strong institutions;
- partnerships for the goals.
In March 2016, the United Nations Statistical Commission (UNSC) agreed on a global list of 241 SDG indicators as a practical starting point to monitor the 17 SDGs and 169 targets at a global level (of these, nine indicators are repeated for different targets). The SDG indicators framework is refined annually, while a comprehensive review by the UN Statistical Commission will take place in 2025. In March 2020, it approved a list of 231 indicators, 12 of which are repeated for different targets. For more information on work being conducted in this area and the approach adopted by UN for the development of SDG indicators, please refer to UN’s SDG indicators website. The UN releases quarterly updates of its global database for SDG indicators; it is available at online.
Sustainable development is a fundamental and overarching objective of the EU, enshrined in Article 3 of the Treaty on European Union. The EU has committed to implementing the UN 2030 agenda for sustainable development, both in its internal and external policies. In November 2016, the European Commission made a proposal for a new European consensus on development — our world, our dignity, our future (COM(2016) 740 final) which highlighted the possibilities available for developing a new framework for achieving sustainable development and poverty eradication. This proposal states that the 2030 agenda should be used to guide EU actions with neighbouring countries, including those covered by the revised European Neighbourhood Policy (ENP). Furthermore, the Communication also proposes that the EU should seek to boost the statistical capacity of developing countries, including: strengthened capacity for the production and analysis of data (disaggregated where possible by income, gender, age and other factors); information on marginalised, vulnerable and hard-to-reach groups; inclusive governance; investment in stronger statistical institutions at national and regional level; the promotion and use of new technologies and data sources.
In November 2016, the European Commission also adopted a Communication titled Next steps for a sustainable European future — European action for sustainability (COM(2016) 739 final), identifying that the EU’s global strategy on foreign and security policy had clear links with the UN 2030 agenda for sustainable development, whereby links and benefits for the EU could be achieved by promoting security and prosperity in surrounding regions, including enlargement and ENP countries. Furthermore, the Communication foresees the development of an SDG indicator framework, whereby the European Commission will ‘seek to carry out more detailed regular monitoring of the SDGs in an EU context’ which should draw on work already being carried out by the European Commission and its agencies, as well as the European External Action Service.
These policies are, in 2022, under review through the European Semester process. As the statistical office of the EU, Eurostat may consider that there are a number of UN indicators which lie outside the scope of official statistics, for example, indicators on governance. Furthermore, in developed economies, some of the indicators from the UN indicator list for monitoring SDGs may be considered as being of little or no relevance, as they refer to issues that are more pertinent for analysing developing countries. Examples include indicators measuring the share of the population that is living within close proximity of a paved road or the availability of modern methods for family planning.
With this in mind, and following the Communication on European action for sustainability, European Commission services have developed an EU-specific indicator list, designed to measure progress in relation to sustainable development issues. The EU’s monitoring framework for SDGs is based largely on data that are already available for the EU Member States (the ‘acquis’). This divergence in approach to that adopted by the UN reflects the considerable differences in economic, social and environmental developments across the different continents, regions and countries of the world and the degree of relevance for some UN indicators with respect to measuring progress on sustainable development issues in the EU.
For more information on work already conducted in this area and the approach adopted by Eurostat, please refer to Eurostat’s website.
European Neighbourhood Policy
On 2 July 2021, the European Commission and the EU High Representative for Foreign Affairs and Security Policy presented the Eastern Partnership: a Renewed Agenda for cooperation with the EU’s Eastern partners. This agenda is based on the five long-term objectives, with resilience at its core, as defined for the future of the Eastern Partnership in the Joint Communication Eastern Partnership policy beyond 2020: Reinforcing Resilience – an Eastern Partnership that delivers for all in March 2020. It is further elaborated in the Joint Staff Working Document Recovery, resilience and reform: post 2020 Eastern Partnership priorities. It will be underpinned by an Economic and Investment plan. The Joint Declaration of the Eastern Partnership Summit ‘Recovery, Resilience and Reform’ of 15 December 2021 reaffirms strong commitment to a strategic, ambitious and forward-looking Eastern Partnership.
In cooperation with its ENP partners, Eurostat has the responsibility ‘to promote and implement the use of European and internationally recognised standards and methodology for the production of statistics necessary for developing and monitoring policy achievements in all policy areas’. Eurostat undertakes the task of coordinating EU efforts to increase the statistical capacity of the ENP countries. Additional information on the policy context of the ENP is provided here.
Direct access to
- All articles on non-EU countries
- European Neighbourhood Policy countries — statistical overview — online publication
- Statistical cooperation — online publication
- All articles on sustainable development goals
- SDG 1 - No poverty
- SDG 3 - Good Health and well-being
- SDG 7 - Affordable and clean energy
- SDG 8 - Decent work and economic growth
- SDG 17 - Partnerships for the goals
- ENP-East – Energy statistics
Books
- Statistics on European Neighbourhood Policy countries: East — 2018 edition
- Sustainable development in the European Union — Monitoring report on progress towards the SDGs in an EU context — 2020 edition
- Sustainable development in the European Union — Overview of progress towards the SDGs in an EU context — 2020 edition
Factsheets
Leaflets
- Basic figures on the European Neighbourhood Policy — East countries — 2020 edition
- Basic figures on the European Neighbourhood Policy — East countries — 2019 edition
- Basic figures on the European Neighbourhood Policy — East countries — 2018 edition
- Basic figures on the European Neighbourhood Policy — East countries — 2016 edition
- International trade for the European Neighbourhood Policy — East countries — 2016 edition
- Sustainable development in the European Union — Overview of progress towards the SDGs in an EU context — 2018 edition
- Eastern European Neighbourhood Policy countries (ENP-East) (ESMS metadata file — enpe_esms)
- European Commission — International cooperation and development — The 2030 agenda for sustainable development
- European Commission — Communication — Next steps for a sustainable European future: European action for sustainability COM(2016) 739 final
- European Commission and the High Representative for the Union for Foreign Affairs and Security Policy — Joint Communication — Review of the European Neighbourhood Policy JOIN(2015) 50 final
- European External Action Service — European Neighbourhood Policy
- United Nations — The Sustainable Development Goals Report 2020
- United Nations — Sustainable Development Goals Indicators — Global database
- United Nations — Sustainable Development Goals Indicators — Metadata repository
- United Nations — Sustainable Development Goals Indicators — Official list of indicators
- Joint Communication JOIN(2020) 7 final: Eastern Partnership policy beyond 2020: Reinforcing Resilience - an Eastern Partnership that delivers for all (18 March 2020)
- Joint Staff Working Document SWD(2021) 186 final: Recovery, resilience and reform: post 2020 Eastern Partnership priorities (2 July 2021)
- Joint Declaration of the Eastern Partnership Summit: ‘Recovery, Resilience and Reform’ (15 December 2021)


