European Neighbourhood Policy - East - energy statistics
Data extracted in February 2023.
Planned article update: April 2024.
Highlights
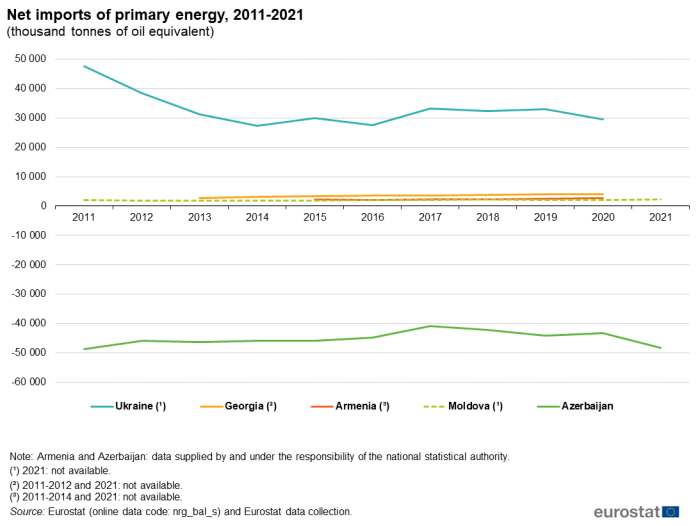
In 2021, Azerbaijan was the only net exporter of energy among the European Neighbourhood Policy-East countries, with net exports of 48 million tonnes of oil equivalent.
Ukraine was the only ENP-East country to report lower levels of electricity generation in 2021 than in 2011.
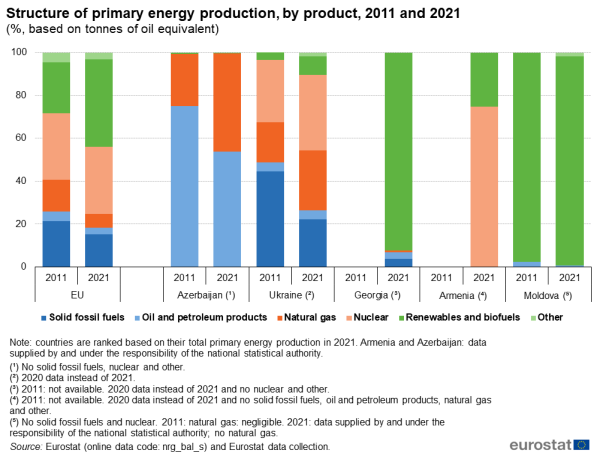
(%, based on tonnes of oil equivalent)
Source: Eurostat (nrg_bal_s) and Eurostat data collection
This article is part of an online publication; it presents information on five European Neighbourhood Policy-East (ENP-East) countries, namely, Armenia, Azerbaijan, Georgia, Moldova and Ukraine, compared with the European Union (EU). Georgia, Moldova and Ukraine also all became enlargement countries in 2022. The European Council gave the three a European perspective and granted Moldova and Ukraine candidate status on 23 June 2022. This article does not contain any data on Belarus, as statistical cooperation with Belarus has been suspended as of March 2022.
Data shown for Georgia exclude the regions of Abkhazia and South Ossetia over which Georgia does not exercise control. The data managed by the National Bureau of Statistics of the Republic of Moldova does not include data from Transnistria over which the government of the Republic of Moldova does not exercise control. Since 2014, data for Ukraine generally exclude the illegally annexed Autonomous Republic of Crimea and the City of Sevastopol and the territories which are not under control of the Ukrainian government. The latest statistics in this Statistics Explained article cover the calendar year 2021, before Russia's invasion of Ukraine. Data on Ukraine for the year 2021 is limited due to exemption under the martial law from mandatory data submission to the State Statistics Service of Ukraine, effective as of 3 March 2022.
The article provides information on the structure of energy production and consumption in the ENP-East countries as well as developments over time. This information is presented through a range of indicators including: primary energy production, energy trade, gross electricity generation, gross inland energy consumption and greenhouse gas emissions.
Full article
Primary energy production
Energy commodities extracted or captured directly from natural resources are called primary energy sources, while energy commodities which are transformed from primary energy sources are called derived products. Primary energy sources cover the extraction of coal and other solid fuels; exploitation of oil and natural gas fields; production by nuclear and hydroelectric power plants; and renewables. The primary production of crude oil is defined as the quantity of fuel extracted or produced within national boundaries, including offshore production. Primary production of natural gas is defined as the quantity of dry gas, measured after purification and extraction of natural gas liquids and sulphur. Energy transformed from one form to another, such as electricity or heat generation in thermal power plants, is not considered as primary production of energy. Energy is often measured in tonnes of oil equivalent (toe). This is a normalised unit, equivalent to the approximate amount of energy that can be extracted from one tonne of crude oil, assigned a net calorific value of 41 868 kilojoules/kg, which allows the potential energy from different quantities of various energy sources to be compared.
Natural resource endowments of fossil fuels largely determine the structure of primary energy production. In Ukraine, the major endowment is coal (mainly located in the easternmost regions), while there is also considerable production from nuclear power, including Europe's largest nuclear power plant with six reactors, in Zaporizhia. Oil and natural gas are the principal sources of primary energy production in Azerbaijan, with most of the fields located offshore in the Caspian Sea. By contrast, in Armenia, Georgia and Moldova there were far fewer natural energy resources available for primary energy production.
The level of primary energy production may fluctuate considerably from one year to the next from changes in energy demand, reflecting, for example, economic fortunes and the number of heating days; from changes in energy prices, which are affected by international market supply and demand; and the weather, particularly for hydroelectric power. Developments in primary energy production may also reflect new energy sources and existing energy resources becoming depleted or being replaced.

(thousand tonnes of oil equivalent)
Source: Eurostat (nrg_bal_s) and Eurostat data collection
There were two main primary energy producers in the ENP-East countries: Azerbaijan produced 66.2 million toe in 2021 and in Ukraine the production was 57.1 million toe in 2020 (no data available for 2021) (see Table 1). Azerbaijan's primary energy production was 5.9 % higher in 2021 than it had been a decade earlier. Notable changes occurred in 2017, when output fell by 4.9 %, before rebounding in 2019 by 6.2 % and in 2021 by 9.5 %. In Ukraine, 2020 primary energy production was 30.4 % below the 2011 figure. Production increased by 2.8 % in 2012 but fell in 2014 by 14.2 % and again in 2015 by 10.6 %. This may be attributed at least in part to the change in geographical coverage of Ukrainian energy statistics. Further falls of 4.6 % occurred in 2016 and 4.2 % in 2017, followed by a smaller rebound in 2018 of 3.4 % and again a decrease of 5.4 % in 2020. Georgia's primary energy production decreased by more than a quarter (27.0 %) between 2013 (no earlier data available) and 2020 (no data available for 2021), from 1.4 million toe to 1.0 million toe, while Moldova's primary energy production increased by 36.8 % between 2011 and 2021, from 0.6 million toe to 0.8 million toe.
Primary energy production in the EU was almost 596 million toe in 2021. Between 2011 and 2021, primary energy production in the EU fell by 12.7 %. The decline in EU output was fairly consistent, with the most significant increases occurring in 2012, by 0.9 % and in 2021, by 4.0 %, while the highest decreases being recorded between 2018 and 2019 (-3.0 %) and between 2019 and 2020 (-7.2 %).
Figure 1 shows that in Azerbaijan, oil and petroleum products, at 53.7 % and natural gas, at 45.9 %, provided almost all national primary production in 2021. Since 2011, the share of natural gas in hydrocarbon production and thus in total energy production has increased, in line with global trends. In Ukraine, nuclear energy provided 35.1 %, natural gas 27.8 % and coal and other solid fuels 22.2 % of primary production in 2020 (no data available for 2021). The contribution of coal and other solid fuels fell from 44.6 % in 2011, while that of nuclear energy increased from 28.9 % and of natural gas from 18.9 %.
The other four ENP-East countries had limited primary energy production – production shares should be viewed in this context. In Georgia, production was mainly focused on hydroelectric power (92.4 % in 2020, no data available for 2021). Moldova had a high contribution from renewables and biofuels in 2021 (97.5 %), still slightly down from 97.7 % in 2011. In Armenia, the largest share of production in 2020 (2021 not available) was from nuclear power (74.8 %).
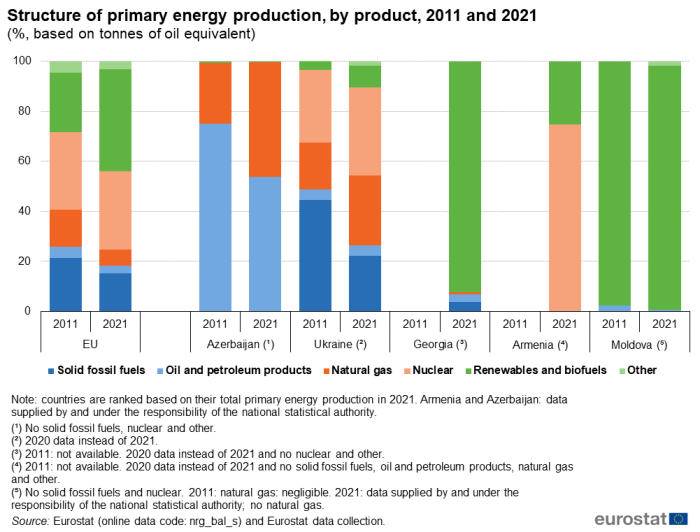
(%, based on tonnes of oil equivalent)
Source: Eurostat (nrg_bal_s) and Eurostat data collection
The structure of primary energy production in the EU is relatively varied, reflecting the availability of fossil fuel deposits and the potential for hydro power, as well as policies concerning the production of nuclear energy and energy from renewable sources. In 2021, the major sources of primary energy in the EU were renewables and biofuels (40.9 %) and nuclear power (31.3 %). Solid fuels accounted for 15.3 % of the primary energy production, while natural gas accounted for 6.4 % and oil and petroleum products for 3.1 %.
Energy trade
If energy consumption exceeds primary production, the shortfall needs to be accounted for by imports of primary or derived products or by reductions in stocks. Net imports are calculated as the quantity of energy imports minus the equivalent quantity of exports. Imports represent all entries into the national territory, excluding transit quantities (notably via gas and oil pipelines); exports similarly cover all quantities exported from the national territory.
Azerbaijan is the only net exporter of energy among the ENP-East countries. Its net energy exports of 48.2 million toe in 2021 were, however, 1.0 % lower in 2021 than in 2011. All the other countries are consistent energy importers. Ukraine was a net importer of 29.5 million toe in 2020 (no data available for 2021), 38.2 % less than in 2011. Moldova imported a net quantity of 2.4 million toe in 2021, up by 18.1 % from 2011. Georgia, at 4.0 million toe net imports in 2020 (no data available for 2021), and Armenia at 2.7 million toe in 2020 (2021 not available), did not report comparable figures for 2011.
In 2021, the EU imported a net quantity of 811.8 million toe of energy, 7.6 % lower than in 2011, with the highest point recorded in 2019, at 908.0 million toe. The large decrease between 2019 and 2020 was partially due to the Covid-19 pandemic.
Electricity generation
Gross electricity production/generation refers to the process of producing electrical energy. It is the total amount of electrical energy produced by transforming other forms of energy, for example coal, nuclear or wind power. It is commonly measured in gigawatt hours (GWh).
Figure 3 shows the development of gross electricity generation in ENP-East countries and the EU over the period 2011-2021. Ukraine was the only ENP-East country to report lower levels of electricity generation at the end of this period than at the beginning, with a 23.0 % contraction. Note that the reported level of electricity generation in Ukraine fell strongly in 2014 and 2015, at least in part due to changes in the geographical coverage. By contrast, among the other four countries reporting three saw strong growths over the period. Azerbaijan had 37.4 % higher electricity generation in 2021 than in 2011. Georgia and Moldova had 25.1 % and 11.3 % growth of electricity generation in 2021 compared with 2011, respectively. An initial period of growth was followed by stability in Armenia, resulting in a 4.3 % increase between 2011 and 2021. EU electrical power production fell by 1.1 % over the period 2011-2021. This is consistent with developed country trends of both economic growth and improved efficiency in electricity.
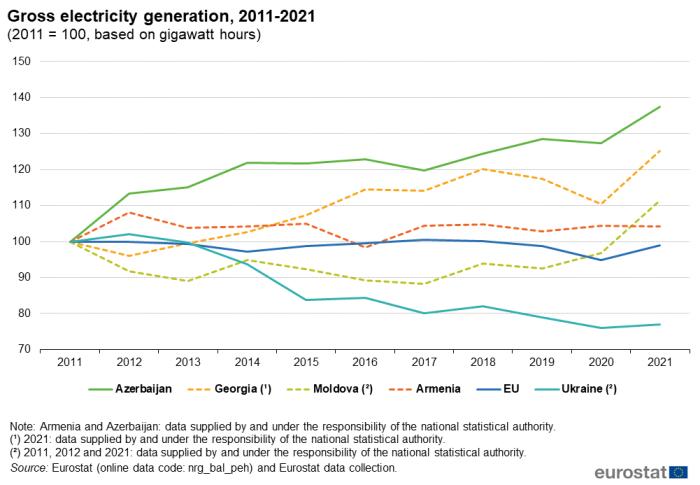
(2011 = 100, based on gigawatt hours)
Source: Eurostat (nrg_bal_peh) and Eurostat data collection
Energy consumption
Gross inland energy consumption is the energy that a country requires to meet its internal (national) demand. It covers consumption by the energy sector itself; distribution and transformation losses; final energy consumption by end users; non-energy use by end users (such as feedstock for the petrochemical industry, lubricants); and statistical differences. It represents the total energy demand of a country or region from all sources necessary to satisfy inland consumption.
Final energy consumption is the total energy consumed by end users, such as households, industry and agriculture. It is the energy which reaches the final consumer's door. Energy consumption by the energy sector itself is therefore not included in the definition of final energy consumption; this is particularly significant when looking at the data for Azerbaijan. The 'other' sector in final energy consumption primarily consists of services, including those of the state, and agriculture, forestry and fishing.
Figure 4 shows the development of gross inland energy consumption over the most recent decade. Azerbaijan recorded constant increases between 2011 and 2021, with a few exceptions in 2016 and 2020 when it fell slightly; its gross inland energy consumption was 29.2 % higher in 2021 than in 2011. Moldova's gross inland energy consumption grew 20.5 % over the period 2011-2021; this growth largely occurred in 2021. It is not possible to draw firm conclusions on the overall change in consumption for Ukraine, as the data available from 2014 onward exclude the illegally annexed Autonomous Republic of Crimea and the City of Sevastopol and the territories which are not under control of the Ukrainian government; nevertheless, the trend of the last years was downwards. For comparison, there was a reduction of 6.2 % overall in the level of energy consumption in the EU during the period 2011-2021, which may, at least in part, be attributed to efforts to improve energy efficiency.
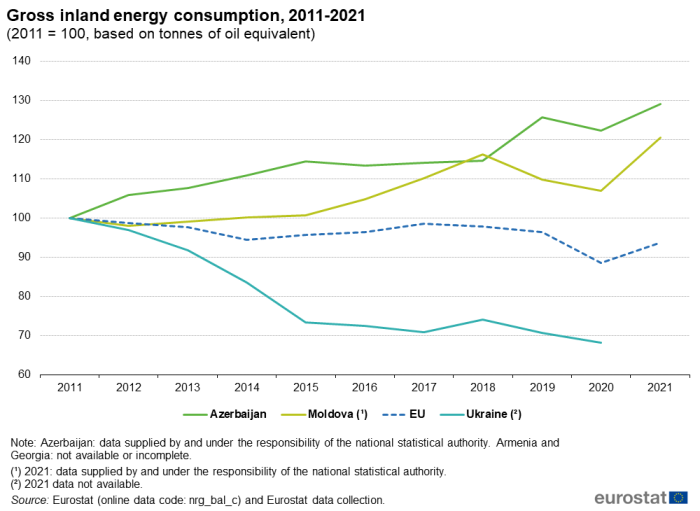
(2011 = 100, based on tonnes of oil equivalent)
Source: Eurostat (nrg_bal_c) and Eurostat data collection
Figure 5 shows the structure of final energy consumption. If a country's industrial sector output declines or the sector becomes more energy efficient, such as by changing the mix of industries, the shares of other sectors in final energy consumption inevitably grow. Countries with smaller industrial sectors tend to show larger household shares of final energy consumption.
Azerbaijan's industry sector consumption share was 16.0 % in 2021. In 2020, Ukraine had the largest share of industry in its final energy consumption, at 36.2 % (no data available for 2021). Georgia's share of industry in final energy consumption was 18.7 %; Armenia's was 12.9 %; that of Moldova was 8.6 % in 2020 (no data available for 2021).
The share of households in final energy consumption in 2021 was 47.9 % in Moldova, 45.5 % in Azerbaijan. In 2020 (no data available for 2021), the share of households in final energy consumption in Armenia was 33.8 %, in Georgia the share was 15.7 % and that of Ukraine was 14.8 %.
The range of shares of transport in final energy consumption is narrower than for the household and industry sectors. Armenia had the largest share in 2020 at 33.5 % and Ukraine the least at 18.1 % (no data available for 2021).
In the EU, transport accounted for 29.2 % of final energy consumption in 2021, industry 25.6 % and households 17.3 %.
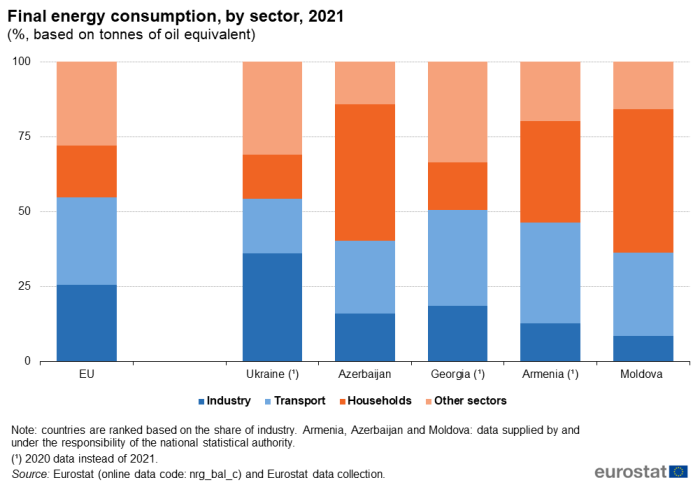
(%, based on tonnes of oil equivalent)
Source: Eurostat (nrg_bal_c) and Eurostat data collection
Greenhouse gas emissions
Figure 6 shows the path of greenhouse gas emissions (GHG) from 2010 to 2020, the latest data available. All ENP-East countries except for Ukraine showed increases, ranging from 2.5 % in Moldova and 17.2 % in Azerbaijan to 25.0 % in Armenia (2017 data; more recent data not available) and 29.8 % in Georgia (2017 data; more recent data not available). Ukraine showed a decrease of 20.6 %, it is possibly partly due to changes in the geographical coverage of the data from 2014 onwards.
In the EU, greenhouse gas emissions in 2020 had fallen by 20.4 % from their 2010 value.
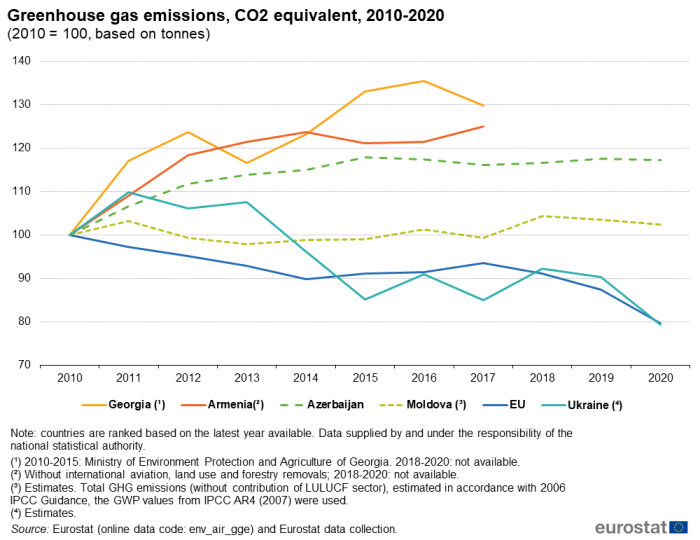
(2010 = 100, based on tonnes)
Source: Eurostat and European Environment Agency (EEA) (env_air_gge) and Eurostat data collection
Source data for tables and graphs
Data sources
The data for ENP-East countries are supplied by and under the responsibility of the national statistical authorities of each country on a voluntary basis. The data result from an annual data collection cycle that has been established by Eurostat. These statistics are available free-of-charge on Eurostat's website, together with a range of additional indicators for ENP-East countries, covering most socio-economic topics.
For EU statistics, the main legislation covering the collection of statistics in relation to energy quantities is Regulation (EC) No 1099/2008 of the European Parliament and of the Council of 22 October 2008 on energy statistics and its amendments. Since its adoption, it has been amended many times and a consolidated version is available. A summary of the relevant legislation is also available on Eurostat's website, under 'Legislation' on the dedicated section for Energy statistics.
Tables in this article use the following notation:
| Value in italics | data value is forecast, provisional or estimated and is therefore likely to change; |
| : | not available, confidential or unreliable value; |
| – | not applicable. |
Context
Energy has been a key feature on the EU's policy agenda for a number of years, largely as a result of fluctuating energy prices; security of supply; and human induced effects of energy use on climate change, in particular, increased levels of greenhouse gas emissions. The use of renewable energy sources is seen as a key element of the EU's energy policy and should help to improve energy security; support the achievement of a carbon neutral society; and decouple energy costs from oil prices.
Alongside this, EU policy has also supported the development of gas pipeline and electricity transmission networks across the EU, as well as of common rules to increase competition between suppliers and promote consumer choice. Energy crises have underlined the EU's need to work with its neighbours on energy security, including diversification of energy sources, routes and suppliers.
In January 2014, the European Commission put forward a 2030 climate and energy framework with the aim of encouraging private investment in infrastructure and low-carbon technologies. The key targets proposed were to have 40 % less greenhouse gases in 2030 than in 1990 and for the share of renewable energy in consumption to reach at least 32 % by 2030. Alongside the proposed targets were plans to reform the emissions trading system and to consider further amendments to the energy efficiency directive.
The EU's 2050 long-term strategy for reducing greenhouse gas emissions was laid out in November 2018, with the aim of making Europe the world's first climate-neutral continent by 2050 in response to the climate and environmental emergency.
In consequence, the European Commission announced the European Green Deal in December 2019. This is an action plan in support of the 2050 long-term strategy which with a further reduction in 2030 greenhouse gas emissions compared with 1990 levels; invest in research and innovation; and preserve Europe's natural environment.
As of 2021, European Union climate legislation to implement these proposals is undergoing detailed development in the EU Council and European Parliament. This package considers the actions required across all sectors, including a reduction of 2030 greenhouse gas emissions compared with 1990 levels of at least 55 %, to be implemented through support for increased energy efficiency and renewable energy. This will enable the EU to move towards a climate-neutral economy and implement its commitments under the Paris Agreement. This process has resulted in a proposal before the European Parliament for a European Strategy for Energy System Integration.
Some ENP-East countries are confronted by energy supply issues, whereby businesses and households cannot be certain that they will have an uninterrupted supply of electricity; this may result from a lack of productive and transmission capacity: not enough generation capacity; insufficient primary energy availability; unreliable plants that have to go off-grid; inefficient transmission systems; or insecure energy supplies due to geo-political relations, for example, when importing fuels or electricity.
On 2 July 2021, the European Commission and the EU High Representative for Foreign Affairs and Security Policy presented the Eastern Partnership: a Renewed Agenda for cooperation with the EU's Eastern partners. This agenda is based on the five long-term objectives, with resilience at its core, as defined for the future of the Eastern Partnership in the Joint Communication Eastern Partnership policy beyond 2020: Reinforcing Resilience – an Eastern Partnership that delivers for all in March 2020. It is further elaborated in the Joint Staff Working Document Recovery, resilience and reform: post 2020 Eastern Partnership priorities. It will be underpinned by an Economic and Investment plan. The Joint Declaration of the Eastern Partnership Summit 'Recovery, Resilience and Reform' of 15 December 2021 reaffirms strong commitment to a strategic, ambitious and forward-looking Eastern Partnership.
The Energy Community is an international organisation which brings together the European Union and its neighbours to create an integrated pan-European energy market. Its objective is to extend the EU internal energy market rules and principles on the basis of a legally binding framework. Georgia, Moldova and Ukraine are members of the Energy Community, while Armenia is an observer. Other energy initiatives concern energy efficiency of buildings; energy legislation and regulation modernisation; and strengthening international nuclear safety.
In cooperation with its ENP partners, Eurostat has the responsibility to promote and implement the use of European and internationally recognised standards and methodology for the production of statistics necessary for developing and monitoring policy achievements in all policy areas. Eurostat undertakes the task of coordinating EU efforts to increase the statistical capacity of the ENP countries. Additional information on the policy context of the ENP is provided here.
Direct access to
Energy statistics
- Shedding light on energy in the EU — a guided tour of energy statistics — 2021 edition
- Energy, transport and environment statistics — 2020 edition
European neighbourhood policy
Books
Factsheets
- Basic figures on the European Neighbourhood Policy-East countries — 2023 edition
- Basic figures on the European Neighbourhood Policy-East countries — 2021 edition
Leaflets
- Basic figures on the European Neighbourhood Policy — East countries — 2020 edition
- Basic figures on the European Neighbourhood Policy — East countries — 2019 edition
- Basic figures on the European Neighbourhood Policy — East countries — 2018 edition
- Basic figures on the European Neighbourhood Policy — East countries — 2016 edition
- Basic figures on the European Neighbourhood Policy — East countries — 2015 edition
- International trade for the European Neighbourhood Policy — East countries — 2016 edition
- European Neighbourhood Policy-East countries — Statistics on living conditions — 2015 edition
- European Neighbourhood Policy — East countries — Key economic statistics — 2014 edition
- European Neighbourhood Policy — East countries — Labour market statistics — 2014 edition
- European Neighbourhood Policy — East countries — Youth statistics — 2014 edition
- Energy (nrg), see:
- Energy statistics - quantities (nrg_quant)
- Energy statistics - quantities, annual data (nrg_quanta)
- Eastern European Neighbourhood Policy countries (ENP-East) (ESMS metadata file — enpe_esms)
- Energy statistics — supply, transformation and consumption (ESMS metadata file — nrg_quant_esms)
- European External Action Service — European Neighbourhood Policy
- European Commission — Energy
- The European Commission's priorities for 2019-2024
- World energy statistics
- Joint Communication JOIN(2020) 7 final: Eastern Partnership policy beyond 2020: Reinforcing Resilience - an Eastern Partnership that delivers for all (18 March 2020)
- Joint Staff Working Document SWD(2021) 186 final: Recovery, resilience and reform: post 2020 Eastern Partnership priorities (2 July 2021)
- Joint Declaration of the Eastern Partnership Summit: 'Recovery, Resilience and Reform' (15 December 2021)
