Comparative price levels for food, beverages and tobacco
Data from 14 December 2023
Planned article update: 20 June 2024
Highlights
This article focuses primarily on price levels for food, beverages and tobacco in 36 European countries. The country groups included in the analysis are the 27 European Union (EU) Member States, three EFTA countries (Iceland, Norway and Switzerland) and six candidate countries (Albania, Bosnia and Herzegovina, Montenegro, North Macedonia, Serbia and Türkiye).
Full article
Overview
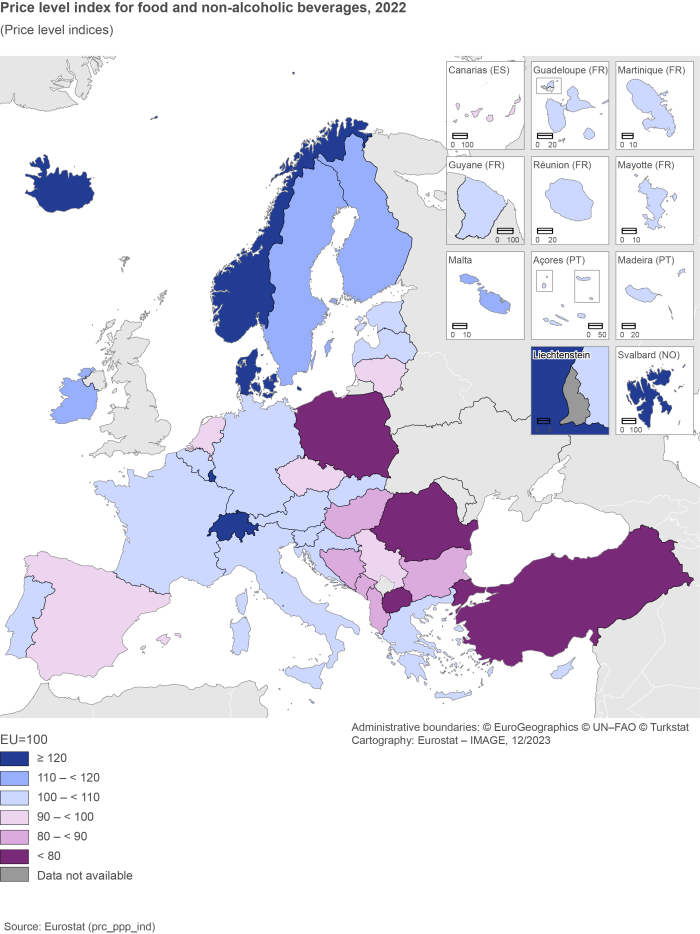
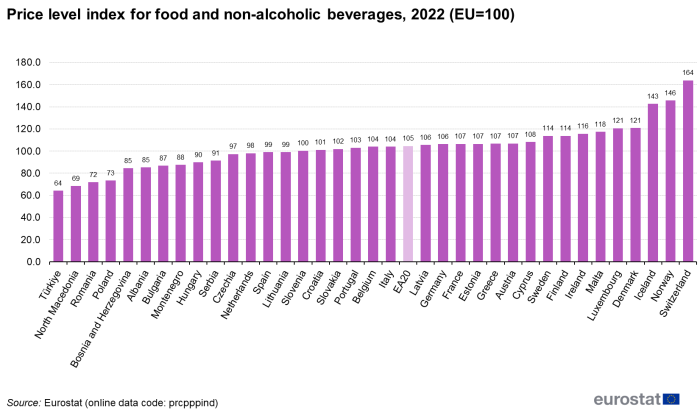
Price levels for food, beverages and tobacco vary considerably across the EU Member States. In 2022, the prices for food and non-alcoholic beverages in Denmark and Luxembourg were 21 % above the EU average, while in Romania they were 28 % below the EU average. Non-alcoholic beverages were more expensive in Denmark at 38 % above the EU average and least expensive in Romania at 21 % below. Alcohol was priced in Finland at 113 % above the EU average, while in Hungary it was at 18 % below. For tobacco, the highest prices were observed in Ireland (161 % above the EU average), while the lowest were recorded in Bulgaria (50 % below).
The results of the survey are expressed in price level indices (PLIs), which provide a comparison of countries' price levels with respect to the European Union average. Map 1 and Figure 1 show the 2022 PLIs for food and non-alcoholic beverages, while the tables present PLIs for sub-groups of products.
Price levels for food, beverages and tobacco
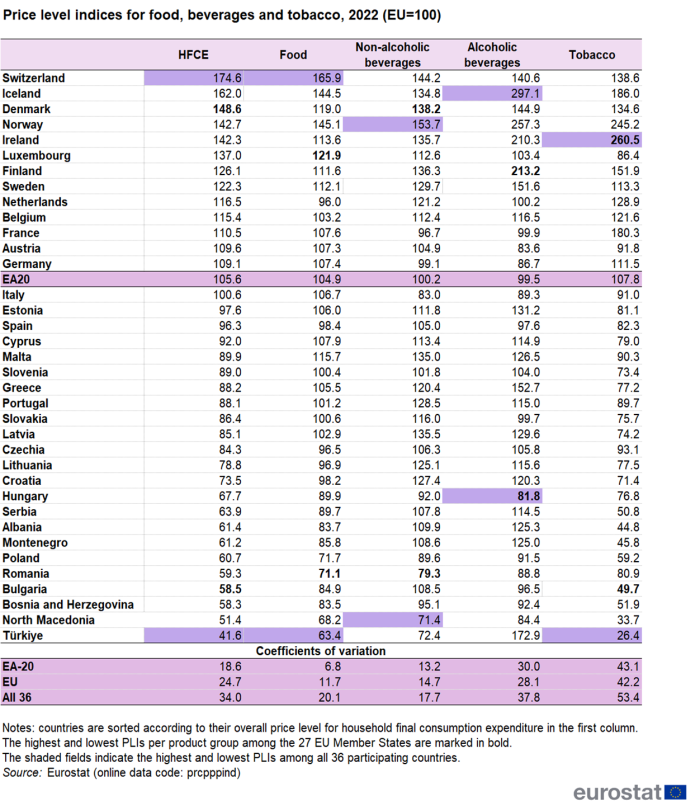
Table 1 shows the PLIs for four important groups: food, non-alcoholic beverages, alcoholic beverages and tobacco. These groups represent on average 16 %, 2 %, 2 % and 3 % of household expenditure respectively. For reference, the PLIs of total household final consumption expenditure (HFCE) are also presented. The highest and lowest PLIs per product group among the 27 EU Member States are marked in bold. The shaded fields indicate the highest and lowest PLIs among all 36 participating countries. At the bottom of the table, coefficients of variation are provided for the euro area (EA-20), the current composition of the EU (27 Member States) and the group of all countries participating in the program (All 36). The coefficients of variation is defined as the standard deviation of the PLIs of the respective group of countries as a percentage of their average PLI. The higher the coefficients of variation, the higher is the price dispersion in the respective product group.
Switzerland is the most expensive country for food, Norway for non-alcoholic beverages, Iceland for alcoholic beverages and Ireland for tobacco within the group of 36 participating countries. Amongst the EU Member States, Luxembourg is the most expensive country for food, Denmark for non-alcoholic beverages, Finland for alcoholic beverages and Ireland for tobacco. The least expensive countries of all 36 are Türkiye for food and tobacco, North Macedonia for non-alcoholic beverages and Hungary for alcoholic beverages. Among the EU Member States, the lowest prices for food and non-alcoholic beverages are observed in Romania. Alcoholic beverages are least expensive in Hungary, tobacco is least expensive in Bulgaria.
Price dispersion is most pronounced within the 36 country group, including both the high price EFTA countries and the mostly low price Western Balkan countries. The lowest price dispersion is found for non-alcoholic beverages, and the highest for tobacco, mainly due to large differences in excise taxation on the latter across the 36 countries. Price dispersion is much less pronounced in the euro area than in the EU as a whole.
Source: Eurostat (prc_ppp_ind)
Source: Eurostat (prc_ppp_ind)
Price levels for bread and cereals, meat, fish and dairy products
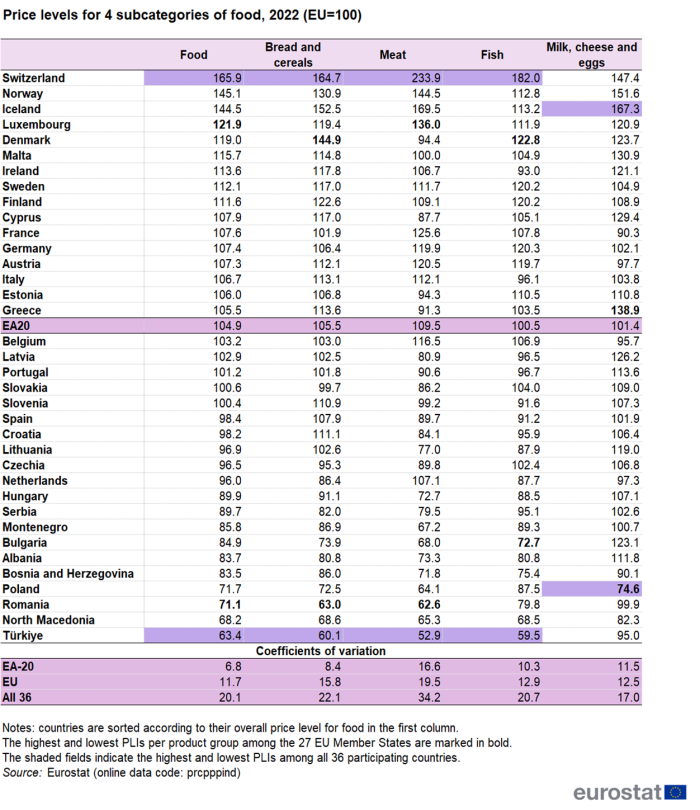
The results of the survey also provide an insight into the different sub-groups of products for all participating countries. Table 2 presents the PLIs for four sub-groups of food: bread and cereals, meat, fish and dairy products. These four sub-groups represent on average 17 %, 23 %, 5 % and 16 % of household expenditure on food, respectively. For comparison, this table includes the PLIs for food as a whole.
Among all 36 countries, Switzerland shows the highest price level for bread and cereals, for meat and for fish. Iceland is the most expensive country for dairy products (milk, cheese and eggs). Within the EU Denmark is the most expensive country for bread and cereals and for fish, Luxembourg for meat, whilst Greece is the most expensive for dairy products (milk, cheese and eggs).
Among all 36 countries Türkiye is the cheapest country for bread and cereals, for meat and for fish. The lowest price level for dairy products (milk, cheese and eggs) is observed in Poland. Among the EU Member States, the lowest price levels for bread and cereals and for meat are observed in Romania. Fish has the lowest price level in Bulgaria, whilst Poland is the least expensive country for dairy products.
The level of dispersion of prices is rather similar between these four sub-groups. Meat shows the highest price dispersion in all country groups. Within the EU, the lowest price dispersion is found for dairy products (milk, cheese and eggs).
Price levels for oils and fats, fruits, vegetables, potatoes and other food products
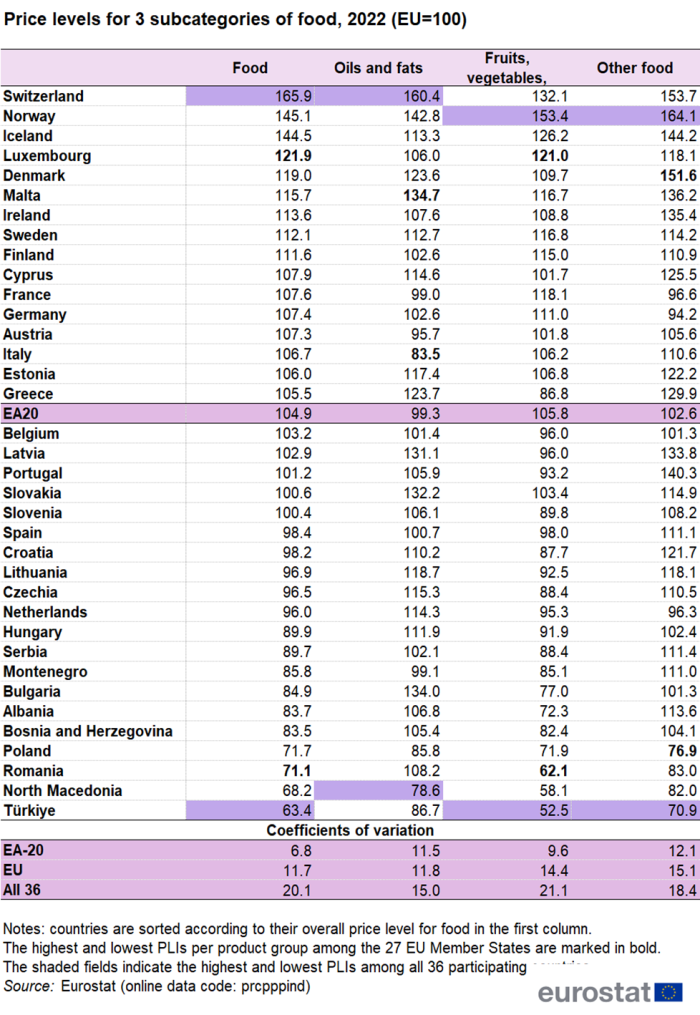
Table 3 shows the PLIs for three further sub-groups of food products: oils and fats; fruits, vegetables and potatoes; and other food products. These sub-groups represent on average 4 %, 22 % and 13 % of household expenditure for food, respectively.
Among all 36 countries the highest prices for oils and fats are observed in Switzerland. Norway has the highest price level for fruits, vegetables and potatoes and for other food products. North Macedonia has the lowest price level for oils and fats, Türkiye is the least expensive country for fruits, vegetables and potatoes and for other food products. Among the EU Member States, Malta is the most expensive country for oils and fats, Luxembourg for fruits, vegetables and potatoes and Denmark for other food. Italy is the least expensive country for oils and fats, Romania for fruits, vegetables and potatoes, and Poland for other food.
Within these three sub-groups, the highest price dispersion can be observed for fruits, vegetables and potatoes.
Price convergence
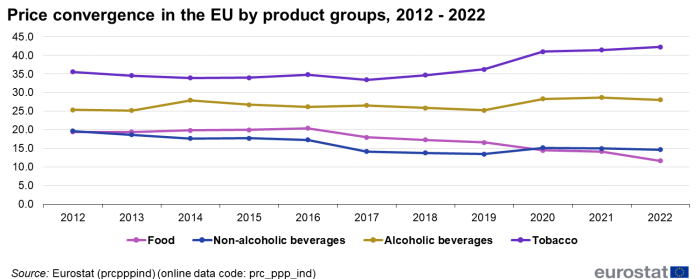
A comparison of the price dispersion within the EU observed on the basis of the surveys conducted since 2012 shows that for two main groups of products, dispersion in 2022 was lower than in 2012.
Figure 2 shows the development of the coefficients of variation of the PLIs for main groups of products in the EU since 2012. A decrease in the coefficients of variation over time can be seen as an indication of price convergence for the respective product group. Price differences have decreased for food and non-alcoholic beverages, while in the last years, price differences have increased for alcoholic beverages and tobacco.
Data sources
The data in this article are produced by the Eurostat-OECD Purchasing Power Parity (PPP) programme. The full methodology used in the programme is described in the Eurostat-OECD Methodological manual on purchasing power parities.
The PPP concept
Purchasing power parities (PPPs) are price relatives that show the ratio of the prices in national currencies of the same good or service in different countries. For example, if the price of a hamburger in Sweden is 28.60 Swedish krona and in Italy it is €2.76, the PPP for hamburgers between Sweden and Italy is 28.60 krona to €2.76 or 10.36 krona to the euro. In other words, for every euro spent on hamburgers in Italy, 10.36 krona would have to be spent in Sweden in order to obtain the same quantity and quality – or volume – of hamburgers.
Published PPPs, usually refer to product groups or broad aggregates like gross domestic product (GDP) rather than to individual products. However, these aggregate PPPs are based on sample surveys of individual goods and services.
Price level indices
Price levels as presented in this publication are the ratios of PPPs to exchange rates. They provide a measure of the differences in price levels between countries by indicating for a given product group the number of units of common currency needed to buy the same volume of the product group or aggregate in each country.
Price level indices (PLIs) provide a comparison of the countries' price levels relative to the European Union average: if the price level index is higher than 100, the country concerned is relatively expensive compared with the EU average, while if the price level index is lower than 100, then the country is relatively cheap compared with the EU average. The EU average is calculated as the weighted average of the national PLIs, weighted with expenditures from national accounts, corrected for price level differences.
Price level indices are not intended to rank countries strictly. In fact, they only provide an indication of the order of magnitude of the price level in one country in relation to others, particularly when countries are clustered around a very narrow range of outcomes. The degree of uncertainty associated with the basic price data and the methods used for compiling PPPs may cause minor differences between the PLIs and result in differences in ranking which are not statistically or economically significant.
The impact of exchange rate changes on PLIs
PLI for a given country is calculated as its purchasing power parity (PPP) divided by its annual average exchange rate to the euro. This implies that exchange rate movements have an impact on the PLIs. A depreciation of a country's currency against the euro will make the country cheaper in comparison to euro area countries and this will show as a decrease of the relative price level expressed in the PLI. The price level change for Türkiye observed in 2022 can be at least partly explained by fluctuations of country's currency against the Euro. In 2022 the national currency of Türkiye showed a large depreciation (66 % between 2021 and 2022).
Organisation
Within the framework of the Eurostat-OECD Purchasing Power Parities (PPP) programme, surveys on prices of household goods and services are carried out cyclically by the National Statistical Institutes (NSIs) of 36 countries. Each survey cycle comprises 6 surveys, each related to a particular group of household consumption products. As 2 surveys are run per year, the whole survey cycle takes 3 years to conclude, before the next cycle starts. The prices used for this publication were collected in spring 2021. The PLIs presented in this article are based on annual national average prices for about 492 goods in total. The expenditure shares reported in this article are based on national accounts data for 2022 and represent the average over all participating countries. The national accounts data are also used as weights in the aggregation of detailed PLIs to aggregate PLIs such as for household final consumption expenditure (HFCE).
Definition of the product groups
The food sub-groups presented in the article include the following types of products:
- bread and cereals: rice, other cereals, flour and other cereal products, bread, other bakery products, pasta products;
- meat: beef and veal, pork, lamb, mutton and goat, poultry, other meats and edible offal, delicatessen and other meat preparations;
- fish: fresh, chilled or frozen fish and seafood, preserved or processed fish and seafood;
- milk, cheese, eggs: fresh milk, preserved milk and other milk products, cheese, eggs and egg-based products;
- oils and fats: butter, margarine, other edible oils and fats;
- fruits, vegetables, potatoes: fresh or chilled fruit, frozen, preserved or processed fruit and fruit-based products, fresh or chilled potatoes, frozen, preserved or processed vegetables and vegetable-based products;
- other food products: sugar, jams, marmalades and honey, confectionery, chocolate and other cocoa preparations, edible ice, ice cream and sorbet, food products n.e.c.;
- non-alcoholic beverages: coffee, tea and cocoa, mineral waters, soft drinks and concentrates, fruit and vegetable juices;
- alcoholic beverages: spirits, wine, beer;
- tobacco: tobacco.
Context
Purchasing power parities (PPPs) are indicators of price level differences across countries. PPPs tell us how many currency units a given quantity of goods and services costs in different countries. PPPs can thus be used as currency conversion rates to convert expenditures expressed in national currencies into an artificial common currency, the purchasing power standard, eliminating the effect of price level differences across countries.
The main use of PPPs is to convert national accounts aggregates, like the gross domestic product (GDP) of different countries, into comparable volume aggregates. Applying nominal exchange rates in this process would overestimate the GDP of countries with high price levels relative to countries with low price levels. The use of PPPs ensures that the GDP of all countries is valued at a uniform price level and thus reflects only differences in the actual volume of the economy.
PPPs are also applied in analyses of relative price levels across countries. For this purpose, the PPPs are divided by the current nominal exchange rate to obtain a price level index (PLI) which expresses the price level of a given country relative to another, or relative to a group of countries like the EU.
The common rules for the provision of input data, and for the calculation and dissemination of PPPs, are laid down in Regulation 1445/2007 of 11 December 2007.
Direct access to
- Comparative price levels (tec00120)
- Price and volume convergence between EU Member States (tec00121)
- GDP per capita in PPS (tec00114)
- Purchasing power parities (PPPs), price level indices and real expenditures for ESA2010 aggregates (prc_ppp_ind)
- Convergence indicators (prc_ppp_conv)
- Eurostat-OECD Methodological manual on purchasing power parities
- Product list 2020-2022

- Purchasing power parities (ESMS metadata file — prc_ppp_esms)
- Regulation (EC) No 1445/2007 of 11 December 2007 establishing common rules for the provision of basic information on Purchasing Power Parities and for their calculation and dissemination
- Summaries of EU Legislation: Purchasing power parities
