Archive:Internet use statistics - individuals
Three quarters of Europeans used the internet in 2013
Statistics in focus 29/2013; Authors: Heidi SEYBERT, Petronela REINECKE
ISSN:2314-9647 Catalogue number:KS-SF-13-029-EN-N
This Statistics Explained article is outdated and has been archived - for recent articles on structural business statistics see here.
This article presents an overview of the findings of the 2013 ‘Survey on ICT (information and communication technology) usage in households and by individuals’. It takes a closer look at internet users’ activities and a set of newly released indicators on online interaction with public authorities and public services (‘e-government’).


Main statistical findings
A large majority of Europeans have used the internet in 2013. It has become important for daily life, education, work and participation in society and enables people to access information and services at any time from any place. Most internet users search for information and news, consult wikis, participate in social networks and buy products online.
In 2013, two in five individuals aged 16-74 years in the EU contacted or interacted with public authorities or public services via websites for private purposes. Among those who used e-government services, income tax declaration was a major reason for use.
The internet habits of different countries and socio-economic groups vary significantly. About a fifth of the EU population have never used the internet.
Internet use by individuals
Three quarters of Europeans used the internet in 2013
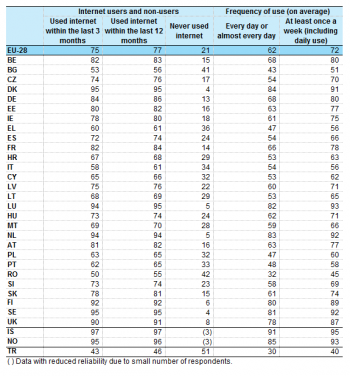
Three quarters of individuals (75 %) in the EU used the internet at least once in the three months prior to the survey. Seven out of ten (72 %) had used it regularly (on average at least once a week) at home, at work or elsewhere (table 1), a level of use just three percentage points below the Digital Agenda target of 75 % of the population by 2015. The share of daily users among internet users was high in all Member States, Iceland and Norway. In the EU, 62% of all individuals used the internet every day or almost every day.
There was significant divergence ('digital divides') according to age and level of formal education (figure 1). 94 % of those aged 16-24 were regular internet users, more than double the proportion in the 55-74 age group (46 %). Similarly, the figure for individuals with a high level of education (93 %) was nearly twice that for those with a low level of education (48 %).
In the EU, the proportion of individuals who have never used the internet halved from 42 % in 2006 to 21 % in 2013 (figure 2), though this trend has slowed in recent years: the number fell from 24 % in 2011 to 22 % in 2012 and 21 % in 2013, and is still six percentage points above the Digital Agenda 2015 target of 15 %.
Large digital divides remain as regards levels of non-use by country (figure 3). The highest proportions of the population with no experience of internet use (whether at home, at work or elsewhere) were registered in Romania (42 %), Bulgaria (41 %) and Greece (36 %), and the lowest in Denmark and Sweden (4 %), the Netherlands and Luxembourg (5 %) and Finland (6 %). In four Member States (Italy, Cyprus, Portugal and Poland), about a third of the population are non-users.
E-Government
The following indicators show the use of e-government services by individuals and provide information on the perceived quality of public authorities' websites and satisfaction with e-government services. They cover contacts or interactions with websites concerning citizen's obligations, rights, official documents, public educational services and public health services.
Two in five individuals used e-government services
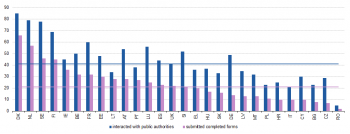
In 2013, 41 % of the EU population had contacted or interacted with public authorities and public services for private purposes over the internet; this figure is nine percentage points below the Digital Agenda target.
One in five individuals filled in and submitted web forms, with the highest proportion (66 %) in Denmark, followed by the Netherlands (57 %), Sweden (46 %), Finland (45 %), Ireland (36 %), Belgium and France (both 32 %). Less than one individual in ten in Bulgaria (8 %), the Czech Republic (7 %) and Romania (2 %) submitted forms online (figure 4). Reasons for the difference include in general varying degrees of internet take-up, online availability of public services and need to submit forms, issues of security or trust, and different levels of ‘e-skills’ and confidence in using websites for this purpose.
Income tax declaration the most popular e-government service
Looking at the reasons for using e-government websites (figure 5), 44 % of e-government users in the EU reported declaration of income tax, followed by requesting personal documents (passport, ID card or driver’s licence) or certificates of birth, marriage or death (20 %), claims for social security benefits (16 %), searching public libraries (16 %), enrolment in higher education or university (9 %) and notification of change of address (6 %).
Four in ten e-government users experienced problems
Four in ten e-government users (41 %) in the EU said they had experienced problems when using e-government websites (figure 6). Nearly a quarter (24 %) had technical problems with the website, 23 % found the information to be insufficient, unclear or out-of-date, and 13 % did not find the online or offline support they needed to obtain the right information and forms, or to fill in or send forms.
One sixth mainly dissatisfied when searching for information and using services
Additional indicators on user satisfaction show that around a sixth of e-government users in the EU were mostly dissatisfied with the ease of using services on e-government websites (16%) and how easy it was to find information (16%). More than one in ten were not satisfied with the usefulness of the information available (13%). Around a fifth (21%) were dissatisfied with the extent to which they were able to track how their requests were being handled (figure 7).
Overall, there seems to be considerable scope for improving e-government services and increasing take-up by individuals in the future.
Internet activity by age group
Communication by e-mail is more or less equally important for internet users in all age groups (figure 8). Larger differences between young and old were recorded when it came to other communication activities covered by the survey, such as social networking and telephone or video calls over the internet. The share of internet users who participated in social networking was 89 % for 16-24 year olds compared with 27 % for 55-74 year olds. The share of users making telephone and video calls through internet-based applications was 45 % for the age group 16-24, compared with 25 % for 55-74 year olds.
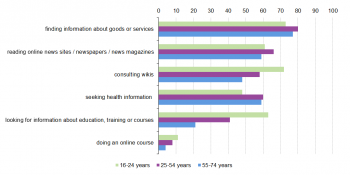
The internet is widely regarded as a source of information and knowledge. More than 70 % of users in all age groups in the EU searched for information about goods or services (figure 9). Many young people used the internet as learning support. Most internet users aged 16-24 consulted wikis (72%), looked for information about education, training or course offers (63%) and read online news (61 %). One in ten young internet users took an online course.
Most internet users in the age group 25-54 read online news (66 %), searched for health information (60 %) and consulted wikis (58 %). These activities were also popular among internet users aged 55-74: nearly 60 % read online news and searched for information about health, and about half consulted wikis.
While over 50 % of internet users aged between 16 and 54 used social networking sites, fewer than one in five used such sites, blogs and e-government or other websites to post opinions on civic or political issues (figure 10). In the 55-74 age group, one in ten users posted such opinions.
A small proportion of internet users took part in online consultations or votes on civic or political issues (e.g. urban planning, signing a petition). One in ten participated in policy decision-making processes.
E-shopping trends
Six in ten internet users shopped online
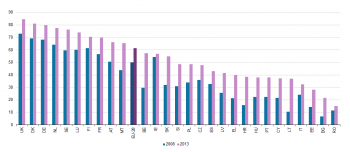
Buying over the internet (e-commerce or e-shopping) has become very popular in the EU, with 61 % of internet users in 2013 using it to buy or order goods or services for private purposes, an increase of eleven percentage points compared with 2008. The share of e-shoppers among internet users varied considerably between Member States: the highest proportions were registered in the United Kingdom (85 %), Denmark (81 %) and Germany (80 %), and the lowest in Romania (15 %), Bulgaria (22 %), Estonia (28 %) and Italy (32 %). The fastest growth between 2008 and 2013, by 20 percentage points or more, was recorded in Belgium, Lithuania, Croatia, Slovakia and Malta (figure 11).
Data sources and availability
The findings in this article are based on the annual survey on ICT usage in households and by individuals. Data for 2013 were aggregated from microdata transmitted by all EU Member States and other countries (Iceland, Norway, Turkey). They are available via the Eurostat website (see link below). Access to microdata for researchers is possible.
The 2013 survey covered 148 290 households with at least one person aged 16-74, and 220 436 individuals aged 16-74 in the EU. Individuals were asked about the last time they used the internet, how often they used the internet and where, mobile internet use, activities including e-government and e-commerce, and their e-skills.
In general, internet activities were carried out in the previous three months before the interview. The main reference period was the first quarter of 2013, as in most countries the data were collected in the second quarter. A 12-month reference period was taken for e-government and e-commerce activities because they tend to be irregular and seasonal. The 2013 survey included a special module on the use of e-government websites.
‘Digital divide’ refers to divergence in the patterns of computer and internet use across countries and sections of the population. ‘E-government’ and ‘e-commerce’ do not involve manually typed e-mails. Users of e-government are those who obtained information, downloaded forms and/or submitted completed forms via websites of public authorities and public services. For the purpose of the survey, ‘public services’ do not include public postal and transport services, utilities (e.g. electricity), news and weather forecast services. Levels of education are defined as follows: high (tertiary education, ISCED 5 or 6), medium (upper secondary education or post secondary, but not tertiary, ISCED 3 or 4), low (no formal education completed, primary or lower secondary education, ISCED 0, 1 or 2).
Context
The findings are used for monitoring several EU policies, in particular the Digital Agenda for Europe, which is one initiative of the Europe 2020 growth strategy and includes several key performance targets for internet use and take-up of services. Annual Digital Agenda Scoreboard reports monitor progress on the basis of indicators in the 2011-2015 Benchmarking Digital Europe Framework.
The Digital Agenda includes measures to promote e-government and exploit the benefits of ICT to help the public sector develop innovative ways of delivering services with fewer resources. A key performance target is that 50 % of EU citizens are e-government users by 2015. The 2011-2015 European e-Government Action Plan supports the provision of a new generation of e-government services at local, regional, national and European levels.
See also
Further Eurostat information
Publications
Database
Dedicated section
Methodology / Metadata
Other information
- Regulation 808/2004 of 21 April 2004 concerning Community statistics on the information society
- Regulation 960/2008 of 30 September 2008 implementing Regulation 808/2004 concerning Community statistics on the information society
- Regulation 1023/2009 of 29 October 2009 implementing Regulation 808/2004 concerning Community statistics on the information society
- Regulation 821/2010 of 17 September 2010 implementing Regulation 808/2004 concerning Community statistics on the information society
- Regulation 937/2011 of 21 September 2011 implementing Regulation 808/2004 concerning Community statistics on the information society
- Regulation 1083/2012 of 19 November 2012 implementing Regulation 808/2004 concerning Community statistics on the information society
External links