Agri-environmental indicator - irrigation
Data from February 2019.
Planned update: September 2025 (with data from IFS 2023)
Highlights
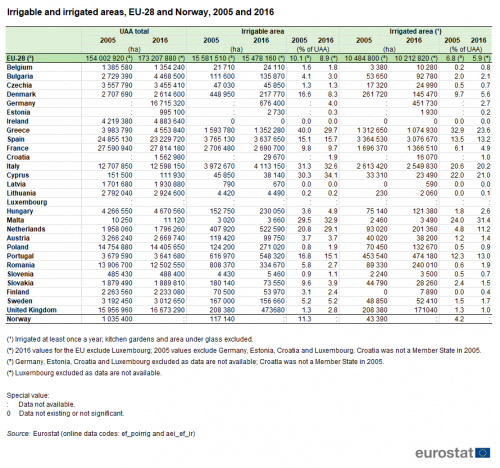
In 2016, 8.9 % of utilised agricultural area in the EU was irrigable (15.5 million hectares) but only 5.9 % was actually irrigated (10.2 million hectares).
Between 2005 and 2016, irrigable areas in the agricultural areas of the EU decreased by 3.5 % and irrigated areas by 6.1 %.
In 2016, Spain (15.7 %) and Italy (32.6 %) had the largest shares of irrigable areas in the agricultural areas of the EU.
(% of total UAA)
Source: Eurostat (ef_poirrig)
This article provides a fact sheet of the European Union (EU) agri-environmental indicator irrigation. It consists of an overview of data, complemented by information needed to interpret these data. This article on irrigation in the EU is part of a set of similar fact sheets, providing a comprehensive picture of the integration of environmental concerns into the Common Agricultural Policy (CAP).
Full article
Analysis at EU and country level
Two thirds of the EU agricultural land equipped with irrigation was actually irrigated in 2016
In 2016, the total agricultural area equipped for irrigation (irrigable area) in the EU[1] was 15.5 million ha (Table 1). However, the area actually irrigated (irrigated area) was lower, reaching 10.2 million hectares (ha). In fact, no country reported that all the irrigable areas had been irrigated.
The extent of irrigated area itself does not allow a statement on the actual amount of water used. Water efficiency in irrigation, as well as groundwater depletion in irrigated areas, also needs to be monitored and addressed, but is outside the scope of this fact sheet.
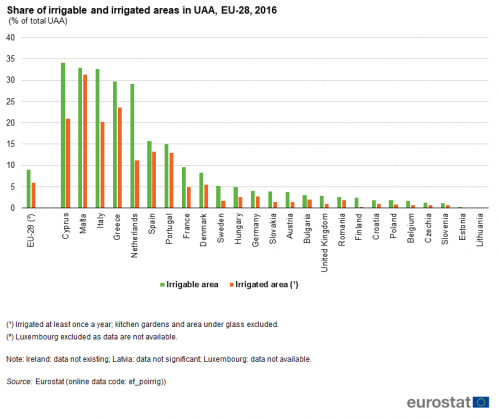
Irrigable and irrigated agricultural areas vary greatly among countries mainly because of regional climate and type of production. Full irrigation is needed in many types of agricultural production of southern European countries. Spain and Italy reported the largest irrigable areas in absolute terms (3.6 million and 4.1 million hectares, respectively) in 2016. The shares of irrigable and irrigated areas in the total utilised agricultural area (UAA) were not surprisingly largest in the Mediterranean countries (Table 1 and Figure 1). Cyprus (34.1 %), Malta (32.9 %), Italy (32.6 %) and Greece (29.7 %) had the largest shares of irrigable UAA in 2016. The same countries reported the largest shares of UAA actually irrigated in 2016; with 31.4 % in Malta, 23.6 % in Greece, 21 % in Cyprus, and 20.2 % in Italy. In the Netherlands the irrigable area was also significant at 29.1 %. In central and western Europe, irrigation is used on a supplementary basis to improve crop production in dry summers. The type of agriculture also plays a role. Fruits and vegetables often require irrigation and horticulture is prominent in the Netherlands.
Source: Eurostat (ef_poirrig) and (aei_ef_ir)
(% of total UAA)
Source: Eurostat (ef_poirrig)
Both irrigable and irrigated areas declined in the EU between 2005 and 2016
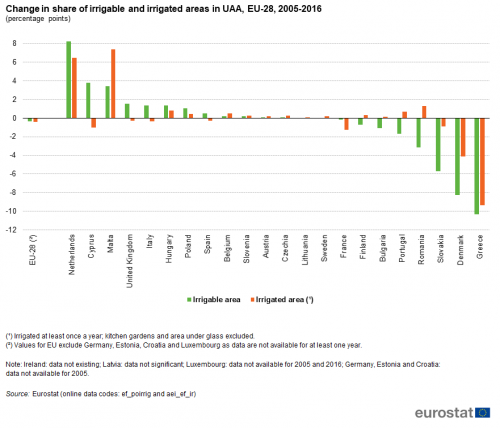
Compared to 2005, irrigable areas decreased by 3.5 % and irrigated areas by 6.1 %[2]. Figure 2 shows the change in the shares of irrigable and irrigated areas in total UAA in the EU between 2005 and 2016 in percentage points. The share of area equipped with irrigation increased the most in the Netherlands (8.3 percentage points; p.p.), followed by Cyprus (3.8 p.p.) and Malta (3.5 p.p.). However, a significant increase in the share of irrigated areas can only be reported for Malta (7.4 p.p.) and the Netherlands (6.5 p.p.).
Greece and Denmark reported the largest decreases in shares of both irrigable and irrigated areas (Figure 2), followed by Slovakia. France was the only other country reporting decreased shares of both areas equipped for irrigation and areas actually irrigated.
(percentage points)
Source: Eurostat (ef_poirrig), (aei_ef_ir)
Analysing a longer time period using data from 1995 compared to 2016 (for the limited number of countries available, see methodology chapter) three countries showed important increases in the share of irrigable areas in total UAA over time; Italy, the Netherlands and Spain (Figure 3). Significant decreases were reported in Denmark, Portugal and Greece.
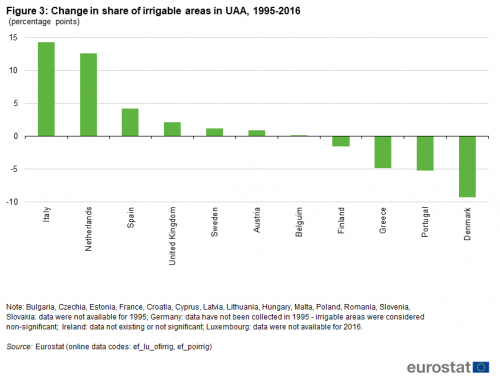
(percentage points)
Source: Eurostat (ef_lu_ofirrig), (ef_poirrig)
Analysis at regional level
Irrigation is mainly applied in southern European regions
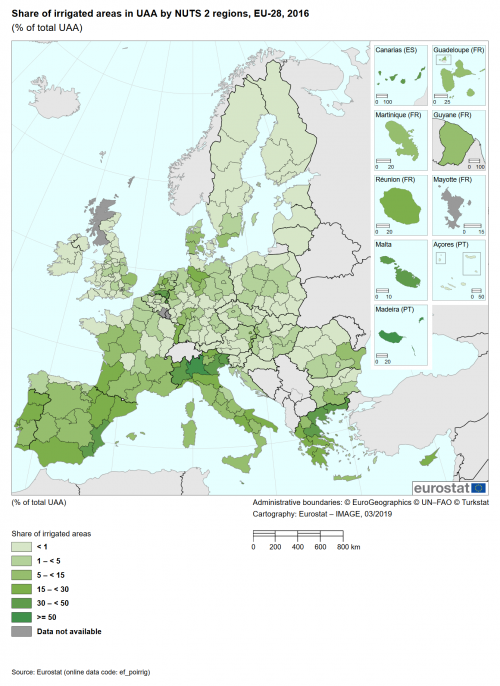
Map 1 shows the share of irrigable areas and Map 2 the share of irrigated areas in UAA at NUTS 2 regional level in 2016. The highest share in 2016 was found on the Portuguese island Madeira, both for irrigable areas (83.6 %) and irrigated areas (75.3 %). Madeira provides a widespread hydraulic system of irrigation channels, so-called Levadas, which are i. a. used for agricultural irrigation[3].
Furthermore, high shares of irrigable and irrigated areas are found in the regions of the southern European countries, especially in Greece, Spain, Italy and Malta, but also in France, Cyprus and Portugal, where irrigation is an essential element in many types of agricultural production. In particular, the northern regions of Italy are predominantly equipped for irrigation. The Italian regions with a share of irrigable areas more than 50 % were Lombardia, Veneto, Emilia-Romagna, Friuli-Venezia Giulia and Piemonte. These were also the regions with the highest share of actual irrigation in Italy. In Greece, Kentriki Makedonia, Thessalia and Anatoliki Makedonia (Thraki) were the regions with the largest share of irrigable and irrigated areas. In Spain, the southern regions Comunidad Valenciana and Región de Murcia reported the largest share of both irrigable and irrigated areas.
In central and northern European countries, supplementary irrigation is generally used to improve production in dry summers, especially when the dry period occurs at a sensitive crop growth stage. In the Netherlands, for instance, a relatively large share of irrigated areas was found in the regions Noord-Brabant and Limburg (these regions are mostly drought-sensitive sandy soils with a low availability of surface water[4]). However, the region Flevoland reported the largest share of irrigable areas in the Netherlands and the second largest in all Member States amounting to 73.7 %. Nevertheless, irrigation was only used on 21.6 % of UAA in Flevoland in 2016.
Generally less irrigation was found in Ireland, the United Kingdom (except East Anglia), the Scandinavian and Baltic Member States, northern Spain, in the north and east of France (except Alsace), Belgium, in large parts of Germany and Austria and in the eastern Member States.
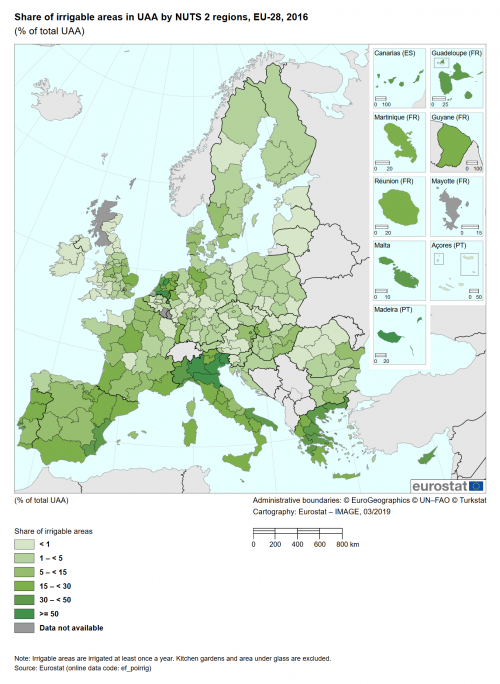
(% of total UAA)
Source: Eurostat (ef_poirrig)

(% of total UAA)
Source: Eurostat (ef_poirrig)
Source data for tables and graphs
Data sources
Indicator definition
The indicator assesses the trend of the irrigable and irrigated areas and their share of the total utilised agricultural area (UAA). The irrigable area is the area which is equipped for irrigation. This area does not show so much variation from year to year as it is costly for the farmer to invest in irrigation equipment. The irrigated area measures the actual amount of land irrigated and can vary significantly from year to year due to, for instance, meteorological conditions or the choice of crop.
Main indicator
- Share of irrigable area in utilised agricultural area (UAA) (and its trend)
Supporting indicator
- Irrigable area
- Irrigated area
- Share of irrigated area in total UAA
Links with other indicators
This indicator has links to a number of other AEI indicators that describe developments in some of the main contributory factors.
The link to AEI 20 "Water abstraction" is especially important as the relative and total area irrigated do not provide enough information to estimate the environmental implications of irrigation on depletion of water resources and thus the sustainability of the cropping systems. The link to AEI 12 "Intensification/Extensification" is relevant as intensification processes in cropping systems usually go together with an increase in inputs such as water use. Extensification usually has an opposite effect. So this indicator tells something about the driving forces behind the changes in irrigable area.
Data used and methodology
The indicator is considered fully operational. Proposals to improve this indicator include:
- collecting data on water metering to be able to monitor and evaluate this practice. Water metering is an important practice to improve the efficiency of water use by irrigation.
- analysing data at river basin scale. As the EU water policy is mainly built on it, it would be relevant for the information to be aggregated to this scale at some point.
- improve link with the AEI 20 indicator. The effects of irrigation on the environment depend also on the current state of water management in the area. Negative effects can for instance occur in water stressed areas. To be able to assess the effects of irrigation on the environment it would be necessary to link the data to water abstraction and state of water in the area.
Data on irrigable areas and irrigated areas are collected in the Farm structure survey (FSS). Data for all EU countries except Croatia are available from 2003. Data for all EU countries are available from 2010. The trends analyses presented in this article exclude some countries, because data were not available for every country in every year.
- 1995: Data not available for Bulgaria, Czechia, Estonia, France, Croatia, Cyprus, Latvia, Lithuania, Hungary, Malta, Poland, Romania, Slovenia, Slovakia; Germany: data have not been collected in 1995 - irrigable areas were considered non-significant; Ireland: data not existing or not significant;
- 2005: Data not available for Luxembourg, Croatia, Germany, Estonia
- 2016: Data not available for Luxembourg
Crops under glass and kitchen gardens, which are assumed to be generally irrigable and irrigated, are not considered within the scope of this article.
The legal basis for the FSS from 2010 onwards is Regulation (EC) No 1166/2008 of 19 November 2008 on farm structure surveys and the survey on agricultural production methods, which repealed Council Regulation (EEC) No 571/1988. The FSS are conducted consistently throughout the EU with a common methodology at a regular base and provide therefore comparable and representative statistics across countries and time, at regional levels (down to NUTS 3 level). Every 3 or 4 years the FSS is carried out as a sample survey, and once in the ten years as a census. The basic unit underlying the FSS is the agricultural holding. The FSS covers all agricultural holdings with UAA of at least one hectare (ha) and also those holdings with UAA of less than 1 ha where their market production exceeds certain natural thresholds. Although the thresholds for defining an agricultural holding can be different between countries (as high as five hectares of UAA in some cases), it has been ensured that the survey covers 98 % of the UAA and the livestock of each country.
Context
The primary objective of irrigation is to provide plants with sufficient water to obtain optimum yields and a high-quality harvested crop. Irrigation is essential in dry climates where precipitation is not sufficient for plant growth. Supplemental irrigation is also vital to produce high levels of quality and yield of crops on croplands in semi-arid and sub-humid climates during dry seasonal periods and drought spells where otherwise farming would not be economically viable. Irrigation increases yield and therefore contributes significantly to agricultural output and food supply. Irrigation water use is a major driving force behind water abstraction globally. In the EU, the agricultural sector accounts for 46 % of the total annual water use in average, of which most is used in southern Europe (around 90 %)[5]. Here, water abstraction at unsustainable rates occurs when the demand for water exceeds the amount available during a certain period. In the coming years, climatic conditions like a decrease in precipitation in southern Europe together with the lengthening of the thermal growing season, may lead to a slight increase in water requirement for irrigation.
Rates of agricultural water use depend on various factors: the crop species chosen (e.g. water-intensive crops such as potatoes in northern Europe or cotton, grain maize, and rice in southern Europe), the fraction of irrigated area, the irrigation technology in use (e.g. drip versus furrow irrigation), the irrigation strategy of the farmer (e.g. full versus complementary irrigation), the presence of legal restrictions, water prices and pumping costs, and certainly the weather conditions. Because of the inter-annual variability of the given factors affecting irrigation requirements, irrigated areas may change from year to year, while irrigable areas (defined as the total area equipped for irrigation) are less variable in time. For this reason, irrigable areas are used to present trends in irrigation. Crops under glass and kitchen gardens, which are assumed to be generally irrigable and irrigated, are not considered here.
Policy relevance and context
The need for a more sustainable and integrated approach to managing water resources in Europe is reflected in water-related policy and legislation. The Water Framework Directive (WFD) (Directive 2000/60/EC) requires the ‘promotion of sustainable water use based on long term protection of available water resources’. A balance between abstraction and recharge of groundwater must be ensured, with the aim of achieving good quantitative status with respect to groundwater. The WFD also requires that water pricing policies are implemented that provide adequate incentives for the efficient use of water resources[6]
In recognition of the acuteness of the water scarcity and drought challenges in Europe, the European Commission undertook in 2006 and early 2007 an in-depth assessment of the situation at EU level. In July 2007 the Commission adopted a Communication on Water Scarcity and Droughts, which identified an initial set of policy options to be taken at European, national and regional levels to address water scarcity within the EU. This set of proposed policies aims to move the EU towards a water-efficient and water-saving economy. One important factor in this context is future land use, which is crucial for mitigating water stress in the long run. Furthermore, data on agricultural water use are important for the authorities in regions with water shortage.
The main policy objectives at EU level in relation to water use and water stress were set out in the 6th and 7th Environmental Action Programmes and the Water Framework Directive:
- to ensure that the rates of extraction from our water resources are sustainable over the long term and to promote sustainable water use based on a long-term protection of available water resources;
- to ensure a balance between abstraction and recharge of groundwater;
- national, regional and local authorities need, among other things, to introduce measures to improve the efficiency of water use and to encourage changes in agricultural practices necessary to protect water resources (and quality);
- EU Member States shall ensure that water-pricing policies provide adequate incentives for users to use water resources efficiently, and thereby contribute to the environmental objectives of the Water Framework Directive.
Furthermore, also the Common Agricultural Policy (CAP) instruments aim at a sustainable water management by promoting the following measures[7]:
- Certain rural development measures support investments for improving the state of irrigation infrastructures or irrigation techniques that require the abstraction of lower volumes of water, as well as actions to improve water quality.
- The cross-compliance framework includes statutory requirements related to water protection and management arising from the implementation of the groundwater directive and nitrates directive, as well as GAEC standards.
Agri-environmental context
Within Europe, there is a great variability in the availability of water resources and, therefore, a marked spatial variability in agricultural water management practices and consumption. Climate is the main factor that determines agricultural water consumption; there are regions where irrigation is the only source of water for crop cultivation (this is the case during summer in some Mediterranean areas), while in other regions, irrigation is used as a supplement to rain-fed agriculture. Irrigation technology is also a major factor influencing the level of agricultural water consumption. The number of Member States that experience seasonal or long term droughts has increased over the years. Agricultural water use is a serious concern especially in southern parts of Europe, where water is scarce and highly variable from year to year. In dry periods of the year or in generally dry regions it is necessary to irrigate certain crops to obtain reasonable yields. If not properly applied, irrigation can lead to over-abstraction of groundwater supplies, secondary salinisation salinisation (by salt-rich irrigation water and/or insufficient drainage), and to pollution of water by nutrients, pesticides, and other farm inputs. Soil erosion can arise from intensive irrigation on slopes. While increasing agricultural production on the land, irrigation can also lead to the destruction of former high nature value habitats including arable dry land and low density pastures. If irrigation over-abstracts the sustainably available water resources, desiccation of former wetlands and the reduction of sensitive aquatic environments[8] can occur. The environmental impact of irrigation, however, depends on the water abstraction rate and the water availability at local level. The water sources used for irrigation also matter, e.g. surface water can be replenished much faster than groundwater.
Irrigation can also have environmental benefits. Traditional irrigation systems create diverse and intricate landscapes, which support a variety of wildlife and have important cultural and historic value. In the same way, the creation and management of rice fields often provides important feeding and over-wintering opportunities for some bird species. Moreover, through a redistribution of water resources, new irrigation projects can contribute to improvement of aquifer recharge and habitat conservation in the areas receiving the new water. This may be the case, for instance, for irrigation projects that entail the creation of wetland areas, which may provide new feeding and/or breeding opportunities for wildlife. Investment in modern irrigation equipment can reduce the water consumption and increase the crop water productivity, enabling sustainable agricultural production in rural areas and fighting land abandonment.
Direct access to
- Agriculture (agr), see:
- Farm structure (ef)
- Farm structure - 2008 legislation (from 2005 onwards) (ef_main)
- Farm land use - Permanent crops, other farmland, irrigation (ef_po)
- Irrigation: number of farms, areas and equipment by size of irrigated area and NUTS 2 regions ([1])
- Farm land use - Permanent crops, other farmland, irrigation (ef_po)
- Farm structure - 2008 legislation (from 2005 onwards) (ef_main)
- Farm structure (ef)
- Agriculture (agr), see:
- Farm structure (ef)
- Share of irrigable and irrigated areas in utilised agricultural area (UAA) by NUTS 2 regions ([2]
- Farm structure (ef)
- Agriculture, forestry and fishery statistics - 2018 edition
- Farm structure (ef_esms)
- Commission Communication COM(2006)508 final - Development of agri-environmental indicators for monitoring the integration of environmental concerns into the common agricultural policy
- Commission Staff working document accompanying COM(2006)508 final
Notes
- ↑ EU-28 except Luxembourg as data are not available.
- ↑ The trend analysis excludes some countries, since data were not available for every country in every year. More information on the concerned countries and years can be found in the methodology chapter.
- ↑ UNESCO, Levadas of Madeira Island, 2017.
- ↑ Stoof, C.R., Ritsema, C.J., Waterwinning voor beregening in de landbouw en op sportvelden: een overzicht van de regelgeving in Nederland, Alterra, Wageningen, 2006.
- ↑ European Environment Agency, Use of freshwater resources, 2019.
- ↑ European Comission, Managing scarce water resources. Implementing the pricing policies of the Water Framework Directive. Final Report. Ref. Ares(2010)37255, Brussels, 2010.
- ↑ European Commission, Agriculture and water, 2019.
- ↑ IEEP, The environmental impacts of irrigation in the European Union. A report to the Environment Directorate-General of the European Commission by the Institute for European Environmental Policy, London, in association with the Polytechnical University of Madrid and the University of Athens, 2000.