International trade in services - an overview
Data extracted in July 2023.
Planned article update: August 2024.
Highlights
In 2022, Germany had the highest value of services exports (€408 billion) and services imports (€438 billion) among the EU Member States, followed by Ireland.
Between 2012 and 2022, the fastest growth for trade in services among EU Member States was recorded in Ireland and Lithuania; each recorded double-digit annual increases for both exports and imports, as did Romania (2013 to 2022) and Cyprus.
Globalisation patterns in EU trade and investment is an online Eurostat publication presenting a summary of recent European Union (EU) statistics on economic aspects of globalisation, focusing on patterns of EU trade and investment.
This article describes the major developments of International trade in services, and the EU Member States.
The provision of services contributes a substantial share of the EU’s economic wealth and accounts for more than 50 % of GDP in each of the EU Member States. Services also play an important role in all modern economies. A resilient tertiary service sector, as well as increased availability of services, may boost economic growth and enhance industrial performance. In an increasingly globalised world, services such as finance, insurance, transport, logistics and communications deliver key intermediate inputs and thereby provide crucial support to the rest of the economy.
Full article
International trade in services
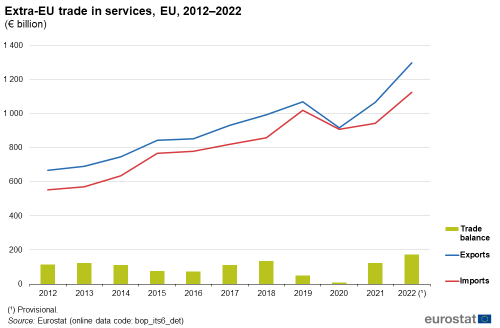
Since 2012, flows of EU international trade in services have increased substantially; the EU’s trade surplus for services was valued at €175 billion in 2022
During the period from 2012 to 2015, the value of EU exports and imports of services to and from non-member countries (also referred to as extra-EU trade) grew steadily. The pace at which the value of exports and imports grew slowed in 2016, before accelerating once more up until 2019. The impact of the COVID-19 crisis in 2020 led to a substantial fall in the value of both exports (down 14.3 %) and imports (down 10.9 %) from and to the EU; note these data are based on a series in nominal prices. There was a strong rebound in 2021 for EU exports, which almost returned to pre-pandemic levels. However, a different pattern was observed for EU imports as they rose at a modest pace in 2021. In 2022, the increase accelerated: the EU’s exports and imports of services were clearly valued above the levels observed before the pandemic in 2019.
During the period 2012–2022 (see Figure 1), the highest annual growth rates for extra-EU exports were in 2015 (up 13.1 %), 2021 (up 16.1 %) and 2022 (up 21.8 %), the only years that double-digit growth rates were recorded. The highest growth rates for extra-EU imports were registered in 2014 (up 11.5 %), 2015 (up 21.0 %), 2019 (up 18.8 %) and 2022 (up 19.1 %).
In 2022, the value of EU exports of services (€1 300 billion) was higher compared to the value of imports (€1 126 billion), resulting in a trade surplus of €175 billion (see Figure 1). From an initial level of €116 billion in 2012, the EU’s trade surplus for services grew to €122 billion in 2013 and then fell back to €74 billion by 2016 as the value of imports of services grew at a faster pace than the value of exports. The trade surplus subsequently widened (once again) to reach a peak of €135 billion in 2018, before a rapid acceleration in the value of imports led to it falling to €51 billion in 2019. The surplus contracted further in 2020 to €9 billion as both exports and imports of services were impacted by the COVID-19 crisis. With a rapid rebound in the value of exports and more modest growth in the value of imports in 2021 and 2022, the EU’s trade surplus reached €122 billion in 2021 and €175 billion in 2022.
Trade in services agreement
Box 1 – Trade in Services Agreement
The Trade in Services Agreement (TiSA) is in the process of being negotiated by 23 World Trade Organization (WTO) members (one of which is the EU); together they account for an estimated 70 % of global trade in services. If additional WTO members join the process, it is hoped that any agreement may be extended into a broader multilateral trade deal.
The TiSA architecture is based on the WTO’s general agreement on trade in services (GATS) and all negotiated provisions are compatible with the GATS. TiSA aims to open-up markets and approve common rules in areas such as licensing, financial services, telecommunication services, e-commerce and maritime transport, as well as for professionals who wish to temporarily move abroad in order to provide services. It aims to remove discriminatory rules that act as barriers to entry. By doing so, foreign enterprises should thereafter have the freedom to establish offices and a business presence across a range of additional services in each of the geographical markets.
The talks started formally in March 2013, and by the end of 2013 most participants had indicated which of their service markets they were prepared to open and to what extent. After 21 different negotiation rounds, the talks were put on hold in November 2016 and at the time of writing (July 2023) they had yet to restart; there is no formal deadline for ending the negotiations.
Trade in services by EU Member States
In 2022 among the EU Member States Germany had the highest value of services exports (€408 billion) and services imports (€438 billion) followed by Ireland
In 2022, Germany recorded the highest share (16.1 %) of exports of services among the EU Member States (see Figure 2); note these figures for individual Member States are based on world trade flows, in other words, the sum of intra- and extra-EU trade. Ireland (13.3 %) and France (12.7 %) were the only other Member States to record double-digit shares. Considering the size of their respective economies, along with Ireland, the Netherlands (7.7 %) and Luxembourg (5.1 %) accounted for relatively large shares of the total value of services exported by Member States.
The highest share of imports of services among the EU Member States in 2022 was Germany with (19.4 %) followed by Ireland (15.7 %) and France (12.0 %); they were the only Member States to record double-digit shares. Again, there were relatively high shares – relative to the size of their economies – for the Netherlands (7.3 %) and Luxembourg (4.7 %).
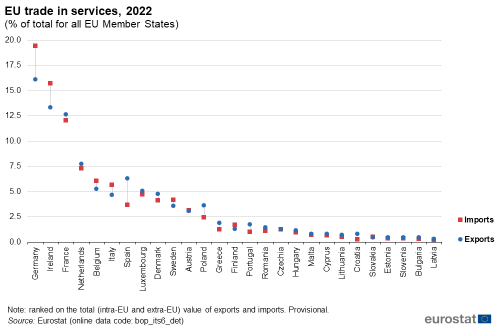
(% of total for all EU Member States)
Source: Eurostat (bop_its6_det)
During the period from 2012 to 2022, the highest growth rates for trade in services were recorded in Ireland and Lithuania
Figure 3 presents the average annual rate of change for international trade in services over the period from 2012 to 2022; note that these rates of change are based on nominal prices. EU exports to non-member countries rose on average by 6.9 % per year during the period under consideration, while the average growth rate for imports was slightly higher, at 7.4 % per year.
The expansion in the value of trade in services (for intra- and extra-EU trade combined) was considerably higher in some of the EU Member States, with the fastest growth rates – for imports and exports combined – being recorded in Ireland, Lithuania, Romania (2013–2022 data) and Cyprus. By contrast, the Netherlands and Italy recorded the slowest increases for trade in services.
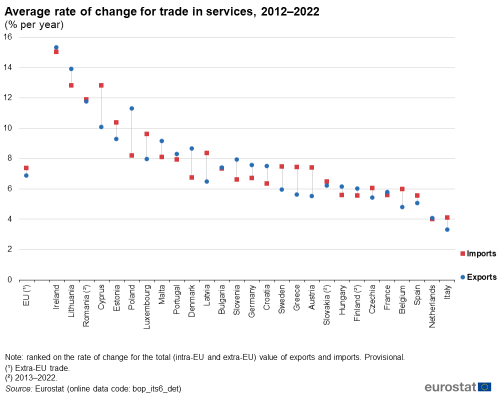
(% per year)
Source: Eurostat (bop_its6_det)
In 2022, Germany and Ireland had the highest values of extra-EU exports of services …
The structure of trade in services may be analysed in more detail, distinguishing between trade flows that are destined for non-member countries (extra-EU trade) on one hand and trade flows with other EU Member States (intra-EU trade) on the other. There are considerable differences between Member States as to the relative importance of intra- and extra-EU trade.
In absolute terms, Germany and Ireland had the highest values of extra-EU exports of services (€237 billion and €230 billion, respectively, in 2022), which equated to 18.2 % and 17.7 % of the EU’s exports to non-member countries (see Figure 4). The next highest share was recorded for France (13.6 %).
… while the value of Irish extra-EU imports of services was even higher
In 2022, Ireland had the highest value of imports of services from non-member countries: €298 billion (26.5 % of the EU’s imports from non-member countries). Offshore financial centres were the main origin for imports of services into the Irish economy; these centres are usually small countries/jurisdictions that provide financial services to non-residents on a scale that is disproportionate with the size and the financing of their domestic economy. Germany (18.3 %) and France (11.2 %) had the next highest shares of extra-EU services imports in 2022.
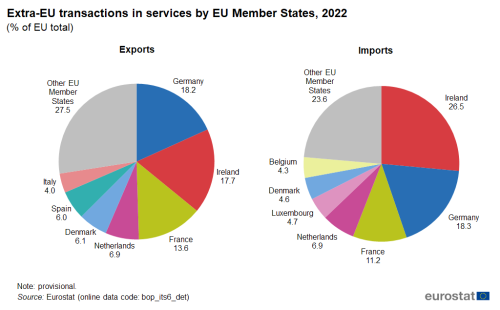
(% of EU total)
Source: Eurostat (bop_its6_tot)
In 2022, the highest values of intra-EU imports and exports of services were recorded in Germany
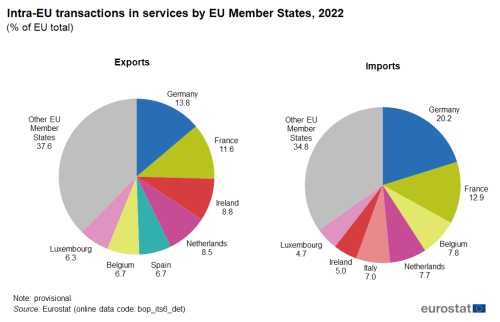
A similar analysis for intra-EU trade is presented in Figure 5. It shows that Germany had the highest value of services exports to other EU Member States (€170 billion in 2022), which equated to 13.8 % of the total for the 27 Member States. France (11.6 %) was the only other Member State to account for a double-digit share of intra-EU exports of services in 2022, although Ireland (8.8 %) and Luxembourg (6.3 %) had particularly high shares relative to the size of their economies.
Germany was also the largest importer of services from other EU Member States, with imports valued at €228 billion in 2022, some 20.2 % of the total for the 27 Member States. The next highest share was recorded in France (12.9 %).
It can be noted that the cumulative share of the seven EU Member States with the highest values of extra-EU services exports in 2022 was equal to almost three quarters (72.5 %) of the EU total, whereas the cumulative share of the seven Member States with the highest values of intra-EU services exports was considerably lower, at 62.4 %. These figures suggest that extra-EU trade in services is more concentrated between a few trading nations.
(% of EU total)
Source: Eurostat (bop_its6_tot)
A closer analysis of intra and extra-EU trade flows reveals that 21 of the EU Member States reported that a majority of their total trade in services took place with other EU Member States (rather than with non-member countries). In 2022, the highest share of trade in services with other Member States was recorded by Austria (75.5 %), while in excess of 70.0 % of all trade in services in Slovenia, Croatia, Slovakia, Lithuania and Romania was also with other Member States. By contrast, a majority of the trade in services that was conducted by France, Germany, Denmark, Greece and Cyprus was with extra-EU partners, while more than three quarters (76.3 %) of all trade in services in Ireland was with non-member countries.
Source data for tables and graphs
Direct access to
Metadata
- Balance of payments – international transactions (BPM6) (ESMS metadata file – bop_6_esms)
Further methodological information
