|
 |
| For any question on data and metadata, please contact: Eurostat user support |
|
|||
| 1.1. Contact organisation | CENTRAL STATISTICS OFFICE, IRELAND |
||
| 1.2. Contact organisation unit | Business Statistics Directorate |
||
| 1.5. Contact mail address | Central Statistics Office, Skehard Road, Cork T12 X00E, Ireland |
||
|
|||
| 2.1. Metadata last certified | 15/06/2023 | ||
| 2.2. Metadata last posted | 15/06/2023 | ||
| 2.3. Metadata last update | 15/06/2023 | ||
|
|||
| 3.1. Data description | |||
The CSO’s Production in Building and Construction Index provides a short-term indicator of output in the construction sector. The index monitors trends in the value and the volume of production in building and construction. The primary purpose of the index is to measure changes in “Value Added" of construction work done at constant prices. The “Capital Goods price index for building and construction materials” is used as the price deflator for this series. |
|||
| 3.2. Classification system | |||
NACE Rev. 2 - Each company surveyed is asked to break down their work done into product level i.e. the CC categories for residential, non residential and civil engineering. Thus the product level is assigned independent of NACE. |
|||
| 3.3. Coverage - sector | |||
Activity coverage: Sector F (41-43) of NACE Rev. 2. Size coverage: All enterprises with employment size classes of at least 20 persons are included and the Neyman allocation method is used to optimally select sample sizes for the remaining size classes. This is a stratified sampling method, splitting the sample into sub-samples. Size class by NACE Rev. 2 group is considered as a sub-sample when choosing samples for the QSC. |
|||
| 3.4. Statistical concepts and definitions | |||
The subject of the statistics is the value of construction work done. The quarterly production in building and construction index provides quarterly statistics on output in the sector. The index monitors trends in the value and the volume of production in building and construction. The primary purpose of the index is to measure changes in value added at constant prices. The volume of work done is derived from the value figures using the Wholesale Prices Index (WPI) “Capital goods for Building and Construction materials” index as a deflator. The CSO collects absolute values and publishes an index, which is derived by comparing results for the current quarter, and the same quarter in the previous year. The Production in Building and Construction Index is calculated using a modified fixed weight Laspeyres index. |
|||
| 3.5. Statistical unit | |||
Administrative Source : Enterprise Reporting unit: Any enterprise classified to Sector F of NACE Rev. 2. |
|||
| 3.6. Statistical population | |||
The QSC is a sample survey. Approximately 2,200 companies are surveyed each quarter. The Central Business Register in the CSO provides the basis for the STS Register. It is from this STS Register that samples are chosen. The population comprises all enterprises classified to Sector F of NACE Rev. 2, which currently stands at approx. 62,000 enterprises. The Business Register is updated continuously based on various Revenue sources and on survey returns. The Business Register and STS register are synchronised annually. However the STS register is also updated more frequently based on survey returns and other information received. |
|||
| 3.7. Reference area | |||
Republic of Ireland. |
|||
| 3.8. Coverage - Time | |||
The results from 2003 onwards have been calculated from the survey returns. In the absence of survey data prior to 2003, a retrospectively derived series was calculated, back to 2000, using a combination of data sources. First results from the survey were published in August 2007 |
|||
| 3.9. Base period | |||
Base (reference) year: 2015 |
|||
|
|||
Data - Collected in Euro. Data - Disseminated as indices. |
|||
|
|||
Reference Quarter. |
|||
|
|||
| 6.1. Institutional Mandate - legal acts and other agreements | |||
Legal basis: This survey is carried out in accordance with the Statistics (Quarterly Survey of Construction) Order, 2017, Number 23, made under the 1993 Statistics Act. The statistics are also required for EU comparisons under Council Regulation (EC) No 1165/98 and amended by Regulation (EC) No.1893/2006. |
|||
| 6.2. Institutional Mandate - data sharing | |||
Section 34 of the 1993 Statistics Act states: The Office may provide, for statistical purposes only, information obtained in any way under this Act or the repealed enactments, in such form that it cannot be directly or indirectly related to an identifiable person or undertaking, to such persons and subject to such charges, conditions and restrictions as the Director General may determine. The data is not sent to the OECD, UN, IMF or other international organisations. |
|||
|
|||
| 7.1. Confidentiality - policy | |||
The provision on statistical confidentiality is regulated by Sections 32 and 33 of the 1993 Statistics Act. Section 32 states: All information furnished by a person, undertaking or public authority under this Act shall be used only for statistical compilation and analysis purposes. Section 33 states: (1) No information obtained in any way under this Act or the repealed enactments which can be related to an identifiable person or undertaking shall, except with the written consent of that person or undertaking or the personal representative or next-of-kin of a deceased person, be disseminated, shown or communicated to any person or body except as follows: (a) for the purposes of a prosecution for an offence under this Act; (b) to officers of statistics in the course of their duties under this Act; (c) for the purposes of recording such information solely for the use of the Office in such form and manner as is provided for (2) The Office may, for statistical purposes only, assign codes derived from information collected under this Act classifying undertakings listed in the administrative systems of other public authorities by economic activity and size (persons engaged) categories. (3) The Taoiseach may by order prescribe such further prohibitions on the disclosure of identifiable records or information obtained under this Act or the repealed enactments for such periods as may be prescribed. (4) Nothing in this Act shall be construed to require any person or undertaking to provide information in relation to a matter on which information was sought in circumstances that would entitle the person or undertaking to decline to give the information in a civil proceeding in any court or on grounds of privilege. |
|||
| 7.2. Confidentiality - data treatment | |||
All data collected is treated as confidential. |
|||
|
|||
| 8.1. Release calendar | |||
A twelve month advance release calendar is published on the CSO website. |
|||
| 8.2. Release calendar access | |||
| 8.3. Release policy - user access | |||
Simultaneous release to all interested parties: No users have prior access to the data before its general release. Data are made available to all users simultaneously on predefined days on the CSO website home page : http://www.cso.ie/en/index.html The production index is further used for estimation purposes in national accounts – Preliminary Series are transmitted to National Accounts within 60 days after the end of the reference period. Provisional data are transmitted to National Accounts on the same day as the national publication within 75 days of the reference period. The transmission is done via email. Transmission to Eurostat: Preliminary Series are transmitted to Eurostat within 60 days after the end of the reference period. Provisional data are transmitted on the same day as the national publication within 75 days of the reference period. The transmission is done via eDamis. |
|||
|
|||
Quarterly: Both to Eurostat and nationally |
|||
|
|||
| 10.1. Dissemination format - News release | |||
News releases for indices of production of building construction and civil engineering are not produced on a regular basis. An information notice was published with the Q4 2018 data to inform users that a new base year was being used. https://www.cso.ie/en/releasesandpublications/in/pbci/informationnotice-productioninbuildingandconstructionindexq42018/ |
|||
| 10.2. Dissemination format - Publications | |||
Quarterly publications on the Production in Building and Construction Index are located on the CSO website at: https://www.cso.ie/en/statistics/buildingandconstruction/productioninbuildingandconstructionindex/ |
|||
| 10.3. Dissemination format - online database | |||
The “Production in Building and Construction Index” tables, released in the online database PxStat on the CSO website are updated quarterly: Statistical Product - Production in Building and Construction Index |
|||
| 10.4. Dissemination format - microdata access | |||
Microdata is not publicly available. |
|||
| 10.5. Dissemination format - other | |||
Data are sent to Eurostat to be used in European aggregates and/or to be released as national data. |
|||
| 10.6. Documentation on methodology | |||
Dissemination of documentation on methodology and sources used in preparing statistics: This is available on the CSO website at: http://www.cso.ie/en/methods/construction/productioninbuildingandconstructionindex/ |
|||
| 10.7. Quality management - documentation | |||
A Quality Report is available on the CSO website at: http://www.cso.ie/en/methods/qualityreports/productioninbuildingandconstructionindex/ |
|||
|
|||
| 11.1. Quality assurance | |||
Quality checks and validation of data are done throughout the whole compilation process. Details are available on http://www.cso.ie/en/methods/qualityreports/productioninbuildingandconstructionindex/ (Quality Survey of Construction) - Chapter 5 “Quality” – a summary of main points are given here): 1 Accuracy and Reliability 1.1 Sampling Effects, Representativity The QSC is designed as a short term indicator, so while it provides good estimates of quarter-on- quarter change, it is not designed to be used to examine long term or structural changes in the construction sector. 1.2 Non-Sampling Effects Sample Selection is taken from the CSO Central Business Register. Coverage is dependent on the quality of the Register used. Updates to the Register are made continually throughout each year, to improve the quality. All enterprises classified under NACE Rev 2, Sector F are available for sample selection. A Neyman Allocation is used to optimally select the samples by size class and NACE Rev 2 Group for size classes A (1-4 employees) and B (5-19 employees), while all of size classes C Extensive follow up of non-responding companies is carried out by telephone, e-mail, and by issuing postal reminders. Data is compared at local level. Data for the current quarter is compared with data for the previous quarter. Construction firms return data by eform or by post. The returned postal forms are scrutinized and then scanned and verified. Due to the use of scanning rather than keying data manually, the risk of data capture error is greatly reduced. Any character which may be rejected by the scanner is manually keyed. The use of eforms also reduces the risk of data capture error. Edits have been developed to compare values for variables in each category of work done against previous returns. If differences exceed specified thresholds, an edit is raised. The system produces lists of errors for each type of edit each quarter. These are then analysed and records are corrected as appropriate. It is assumed that non- respondents have the same characteristics as respondents Grossing or imputation is not used when generating results for the QSC, however, weighting is used. Weights have been derived for each category of construction by size class. Each firm is size coded at the time of rebasing the series. So the size classes are based on activity in the middle of the base period. It is assumed that each firm remains in the same size class throughout the base period. 2 Timeliness and Punctuality 2.1 Provisional Results Provisional Results are produced for the current quarter within 75 days of the reference date. The release contains value and volume indices together with annual percentage change for production in Building and Construction and also for subsectors such as Civil Engineering, Residential and Non-Residential, together with EU comparative data. 2.2 Final Results Final results are provided for the last published quarter - e.g. if the current quarter published is q1 2014 then final results for q4 2013 will be produced within 150 days of the reference date. The release table details are the same as those outlined in section 5.3.1 for provisional results. 3 Coherence Data from the QSC is checked for consistency with other data sources such as:
The QSC compares reasonably with these indicators in value and volume of construction output in Ireland. 4 Comparability Comparisons are made between quarters going back to Q1 2000 and there is no break in the time series. 5 Accessibility and Clarity 5.1 Assistance to Users, Special Analyses The publications, background notes and methodology documents are available on the CSO website. Historical data is also available on the CSO’s databank. Specific user requests are acceded to where possible, and where confidentiality issues do not arise. 5.2 Revisions Revisions are made to provisional data due to late returns or amendments being required to existing returns. Revised data becomes final data.
The quality system used within the CSO is detailed in a corporate document entitled "Standards and Guidelines, Volume 1, Quality in Statistics". |
|||
| 11.2. Quality management - assessment | |||
Indices are based on reliable data. Publication of results are always punctual. Further methodological details and other information can be found in point 13. Accuracy. Data from the QSC is checked for consistency with other data sources such as:
The trends between series are consistent on a quarterly basis regarding numbers employed and hours worked. There is a lag of one quarter between planning permissions and work done. House completions and commencements are more consistent with the QSC on an annual basis. As a result, there are no obvious weak points. |
|||
|
|||
| 12.1. Relevance - User Needs | |||
The QSC is designed as a short term indicator, so while it provides good estimates of quarter-on- quarter change, it is not designed to be used to examine long term or structural changes in the construction sector. It is of relevance to the following user groups:-
|
|||
| 12.2. Relevance - User Satisfaction | |||
No index for user satisfaction is available, but there are regular meetings with national experts and essential users to react to new requirements, if these are not in contrast with legal necessities or constraints. In addition a user’s satisfaction survey takes place in periodic intervals. |
|||
| 12.3. Completeness | |||
The production index is fully compliant regarding STS-Regulation 1165/98. (All the required series are produced although the classification system used for breakdown of total construction does not follow the STS regulations (NACE Rev. 2 instead of Classification of Types of Construction (CC))). |
|||
|
||||||||||||||||||||||||||||||||||||||||||||||||||||||||||||||||||||||||||||
| 13.1. Accuracy - overall | ||||||||||||||||||||||||||||||||||||||||||||||||||||||||||||||||||||||||||||
For interpretation of results, users have to be aware that every index draws a picture of reality in a simplified way. There is no statistical model which is able to represent the complexity of reality in total. A benchmarking exercise is carried out annually by the annual survey of construction against the quarterly returns and the match is excellent on the value of work done. The volume of work done is derived by deflating the value by the price index of building and construction (including wages and materials). The sample selection technique used minimizes sampling error (details given in 13.2). Also non-response contributes to non-sampling error but with relatively high response rates (circa 50%-60%) the effect should be small. Key companies are also targeted for non-response leading to response rate of close to 100% within this list. Provisional and final indices in general report same trends - Difference in volume index between provisional and final between 2022Q1 and 2022Q4 varied between -1.2% and +2.3%. |
||||||||||||||||||||||||||||||||||||||||||||||||||||||||||||||||||||||||||||
| 13.2. Sampling error | ||||||||||||||||||||||||||||||||||||||||||||||||||||||||||||||||||||||||||||
The sample design is as follows: All enterprises with 20 or more employees or with sizeclass C or D (more than 20 employees - set at rebase) are included. Also all that responded in either of last 2 quarters are included (except those non-census enterprises who have responded in 5 last consecutive quarters are given survey break). The remainder are divided into strata based on sizeclass (A and B) and NACE. The number to be randomly selected from each stratum is determined using Neyman Allocation (applying minimum strata size where available of 25). Results were as follows:
A method of measurement of sampling error is currently under development. |
||||||||||||||||||||||||||||||||||||||||||||||||||||||||||||||||||||||||||||
| 13.3. Non-sampling error | ||||||||||||||||||||||||||||||||||||||||||||||||||||||||||||||||||||||||||||
Detailed information on non-sampling errors, as applicable to QSC are as follows: - Coverage errors - Neyman Allocation should be providing optimal allocation (based on employment levels) for strata A and B - while strata C and D are fully covered. - Data collection errors - Negligible - Forms are sent by post or by email to construction firms. The returned postal forms are scrutinized and then scanned and verified. Due to the use of scanning rather than keying data manually, the risk of data capture error is greatly reduced. Any character which may be rejected by the scanner is manually keyed. The use of eForms also reduces the risk of data capture error. Edits have been developed to compare values for variables in each category of work done against previous returns. If differences exceed specified thresholds, an edit is raised. The system produces lists of errors for each type of edit each quarter. These are then analysed and records are corrected as appropriate. - Unit and item non-response (missing data) - Final response levels at approx. 55-65% - All strata should be well represented in responses. - Data processing errors - Minimal - If any they will be picked up while processing for index calculations (There are 2 versions of programs run simultaneously by 2 different persons to ensure processing completed correctly). - Model errors - It is assumed that non- respondents have the same characteristics as respondents. Grossing or imputation is not used when generating results for the QSC, however, weighting is used. Weights have been derived for each category of construction by sizeclass. Each firm is sizecoded at the time of rebasing the series. Thus the sizeclasses are based on activity in the middle of the base period. It is assumed that each firm remains in the same sizeclass throughout the base period. |
||||||||||||||||||||||||||||||||||||||||||||||||||||||||||||||||||||||||||||
|
|||
| 14.1. Timeliness | |||
At the end of the reference quarter, eform or postal forms are sent to the enterprises asking them to fill out the relevant data within a 2 week period. Missing responses are then requested by eform and/or postal reminders and certain enterprises are also contacted by phone. Provisional Results are produced for the current quarter within 75 days of the reference date. The release contains value and volume indices together with annual percentage change for production in Building and Construction and also for subsectors such as Civil Engineering, Residential and Non-Residential, together with EU comparative data. Final results are produced within 150 days of the reference date. |
|||
| 14.2. Punctuality | |||
National publications have always been on time. Deliveries to Eurostat have also always been on time. |
|||
|
|||
| 15.1. Comparability - geographical | |||
It is possible to compare calculated Irish aggregates with those of other European countries, due to harmonised STS indices in the European Union. Moreover, the production index is provided to UN on ISIC Rev. 4 to enable further country comparisons. |
|||
| 15.2. Comparability - over time | |||
Comparisons are made between quarters going back to Q1 2000 and there is no break in the time series. |
|||
| 15.3. Coherence - cross domain | |||
Cross-checks with absolute STS data in industry and construction Compare over period: compare with previous STS-values (previous month and year) SBS data (e.g. activity, turnover)
Data from the QSC is also checked for consistency with other data sources such as:
An analysis quantifying the differences between the above is not published but one reason is that each data series serves a different purpose. An internal coherence exercise is undertaken on a quarterly basis as follows: (a) LFS: when the numbers employed in construction rise or fall one would expect the volume of construction to similarly rise or fall. (b) EHECS: when the number of hours worked in construction rise or fall one would expect the volume of construction to similarly rise or fall. (c) When I compare trends of planning permissions by product (residential, civil engineering and non residential) planning permissions predict the trend of the QSC by one quarter. (d) House completions data series are based on the number of new dwellings connected by ESB Networks to the electricity supply. These represent the number of homes completed and available, and do not reflect any work-in progress. ESB Networks have indicated that there was a higher backlog in work-in-progress in 2005 than usual (estimated as being in the region of 5,000 units). This backlog was cleared through the connection of an additional 2,000 houses in Quarter 1 2006 and 3,000 houses in Quarter 2 2006. (e) House commencements: The unusually high figures for February 2014 arose from the introduction on March 1st of the new Building Control (Amendment) Regulations 2014 (S.I. No. 9 of 2014). The trigger for the application of the new regulations is the lodgement of a commencement notice application. In order to avoid the additional obligations under the new regulations, many projects may have been fast-tracked and commencement notice applications lodged prior to the coming into effect of the new regulations on 1 March 2014. (f) House registrations: Data up to and including 2001 and from 2010 represent HomeBond Registrations. Data from 2002 to 2009 includes HomeBond Registrations and Premier Guarantee Registrations. |
|||
| 15.4. Coherence - internal | |||
Non residential and civil engineering products are classified by the enterprise surveyed. |
|||
|
|||
Total cost of survey production: In order to reduce the burden on enterprises a review of the QSC was carried out in 2010 using Lean Six Sigma. As a result a number of methodological changes were introduced, which included reducing the content and complexity of the original questionnaire. Total burden on respondents: 1,800 person hours. Administrative Costs: €77,400 (2013 Prices) Source: Response Burden Barometer, 2017 (https://www.cso.ie/en/releasesandpublications/ep/p-rbb/responseburdenbarometer2021) |
|||
|
|||
| 17.1. Data revision - policy | |||
This revision policy is described in footnotes given for the relevant tables and in the description of the respective statistics. There is at least one quarter advance notice given for major changes in methodology by including footnotes in the respective tables. We also have a database called PxStat, which contains all published data of the QSC, and it has an audit trail of all revisions going back since the survey was first introduced a decade ago. Any revisions made nationally are transmitted to Eurostat at the same time. |
|||
| 17.2. Data revision - practice | |||
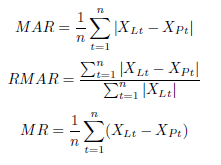
Revisions are made to provisional data due to late returns or amendments being required on existing returns. Revised data becomes final data. Data is revised within one quarter and is marked as provisional until then. The data series back to the rebase year is revised during a rebase e.g. data was revised back to Q1 2015 in the most recent rebase, data for earlier years were spliced and rescaled. Production in Construction data is typically revised once. Early indices are published 75 days after the end of the reference period and final indices are published 150 days after the end of the reference period. Data was revised in March 2021 back to Q1 2015 due to a correction of an error in the applicaton of the Laspeyres Index and to the revision of the deflator that is used. The Quality Indicators used in the data revision practice are: MAR (Mean Absolute Revision) and MR (Mean Revision). The formulas used to calculate these QI are:
The computed values for the last 20 quarterly Production in Building and Construction indicators are:
PROD:F: MAR = 0.030 , RMAR = 0.245 , MR = -0.0049
|
|||
|
|||
| 18.1. Source data | |||
Type of source: Statistical sample survey of enterprises from the STS register. The Central Business Register in the CSO provides the basis for the STS Register. The Business Register is updated continuously based on various Revenue sources and on survey returns. The Business Register and STS register are synchronised annually. As part of this, manual checks are done on birthing / ceasing enterprises with 50 or more employees or turnover >= 20 million. Other enterprises are birthed automatically. Manual checks are also done before ceasing enterprises which sent in a survey return in the previous year. The STS register is also updated more frequently based on survey returns and other information received. The QSC is a sample survey. All enterprises classified under NACE Rev 2, Sector F are available for sample selection. Approximately 2,200 companies are surveyed each quarter. This consists of a census of approximately 400 enterprises with 20 or more persons engaged and the remainder is a random sample of the smaller units stratified by activity (NACE Revision 2) and employment size class. Frequency of updating the sample: Quarterly. |
|||
| 18.2. Frequency of data collection | |||
Data are collected on a quarterly basis. |
|||
| 18.3. Data collection | |||
Data are collected by eform and postal form. Emails, postal reminders and telephone calls are used to seek the return of forms from non-respondents. |
|||
| 18.4. Data validation | |||
Returned postal forms are scrutinized and then scanned and verified. A number of validation procedures are in place for all returned data. Edits have been developed to compare values for variables in each category of work done against previous returns. If differences exceed specified thresholds, an edit is raised. The system produces lists of errors for each type of edit each quarter. These are then analysed and records are corrected as appropriate. SDMX is the tool we use in validating the structure of the file and codes used that is submitted to Eurostat. It has been in use since the submission of the Q1 2019 data in June 2019. |
|||
| 18.5. Data compilation | |||
The inquiry is used to obtain information on the value of construction work done. Volume indices are derived from value figures using the Wholesale Prices Index (WPI) “Capital goods for Building and Construction materials” index as a deflator. The QSC Index is calculated using a modified fixed weight Laspeyres index: (∑Wq-1(CTq//CTq-1)/∑W0)*100 W0 and W q-1 are the base weights and updated values respectively. CTq and CTq-1 are the category values of production (or output) for the current and previous quarter respectively. In the case of the QSC, 3 base weights are used, one for each category of construction work. The compilation of the index for the current quarter (q) is based on the percentage change in the value of quarterly production (based on a matched sample) over the previous quarter. The quarterly production in building and construction index provides quarterly statistics on output in the construction sector. The index monitors trends in the value and the volume of production in building and construction. It is assumed that non- respondents have the same characteristics as respondents. Grossing or imputation is not used when generating results for the QSC, however, weighting is used. Weights have been derived for each category of construction by sizeclass. Each firm is sizecoded at the time of rebasing the series. Thus sizeclasses are based on activity in the middle of the base period. It is assumed that each firm remains in the same sizeclass throughout the base period. Frequency of weight update: Every 5 years. Note: This calculation methodology is currently undergoing review within the CSO and changes might be implemented at a future date. |
|||
| 18.6. Adjustment | |||
Seasonal Adjustment is conducted using the direct seasonal adjustment approach. Under this approach each individual series is independently adjusted. Each individual seasonally adjusted series is calculated based on working day adjusted data. The adjustments are completed by applying the X-13-ARIMA model, developed by the U.S. Census Bureau to the working day adjusted data. This methodology estimates seasonal factors while also taking into consideration factors that impact on the quality of the seasonal adjustment such as:
See attached metadata document in the annex. |
|||
|
|||
No comment. |
|||
|
|||
|
|||
| Seasonal Adjustment Metadata |
|||