|
 |
|
| For any question on data and metadata, please contact: Eurostat user support |
|
|||
| 1.1. Contact organisation | Statistics Austria |
||
| 1.2. Contact organisation unit | Directorate Social Statistics |
||
| 1.5. Contact mail address | STATISTICS AUSTRIA Social Statistics Guglgasse 13 1110 Vienna AUSTRIA |
||
|
|||
| 2.1. Data description | |||
[Not requested] |
|||
| 2.2. Classification system | |||
Not available. |
|||
| 2.3. Coverage - sector | |||
Not available. |
|||
| 2.4. Statistical concepts and definitions | |||
Not available. |
|||
| 2.5. Statistical unit | |||
Not available. |
|||
| 2.6. Statistical population | |||
Not available. |
|||
| 2.7. Reference area | |||
Not available. |
|||
| 2.8. Coverage - Time | |||
Not available. |
|||
| 2.9. Base period | |||
Not available. |
|||
|
|||
| 3.1. Source data | |||
The Structure of Earnings Survey was conducted as a combination of primary and secondary statistics. The use of secondary data meant that the survey could be restricted to those characteristics which cannot be obtained from sources of administrative data. With the exception of the variable citizenship, optional variables were not usually included in the survey.
Earnings: B42 Gross earnings in reference month, B421 Earnings related to overtime, B422 Special payments for shift work; Hours worked: B27/B271 Full-time or part-time employee, B32 Number of hours paid, B321 Number of overtime hours paid; Workplace-related characteristics: B23 Occupation, B26 Length of service in the enterprise, B28 Type of employment contract, B33 Annual days of holiday leave; Enterprise-related variables: A11 Geographical location of the local unit, A13 Principal economic activity of the local unit[1]), A14 Form of economic and financial control, A15 Collective pay agreement;
Business register: A11 Geographical location of the enterprise (NUTS 1), A13 Principal economic activity of the enterprise (NACE Rev. 2) Social security data: A12 Size of the enterprise, B21 Sex, B22 Age, B29 Citizenship Wage tax data: B31 Number of weeks, B41 Gross annual earnings, B411 Annual bonuses and allowances; Education register:B25 Highest successfully completed level of education; |
|||
| 3.2. Frequency of data collection | |||
[Not requested] |
|||
| 3.3. Data collection | |||
[Not requested] |
|||
| 3.4. Data validation | |||
[Not requested] |
|||
| 3.5. Data compilation | |||
[Not requested] |
|||
| 3.6. Adjustment | |||
[Not requested] |
|||
|
|||
| 4.1. Quality assurance | |||
Not available. |
|||
| 4.2. Quality management - assessment | |||
[Not requested] |
|||
|
|||
| 5.1. Relevance - User Needs | |||
The results of the Structure of Earnings Survey (SES) are used at national level mainly by employer and employee organisations, various federal ministries, the Austrian National Bank, universities and other research institutes, the media, enterprises and private individuals. |
|||
| 5.2. Relevance - User Satisfaction | |||
Information about the profile of users or the level of satisfaction with the data provided is not available for Austria. |
|||
| 5.3. Completeness | |||
[Not requested] |
|||
| 5.3.1. Data completeness - rate | |||
[Not requested] |
|||
|
||||||||||||||||||||||||||||||||||||||||||||||||||||||||||||||||||||||||||||||||||||||||||||||||||||||||||||||||||||||||||||||||||||||||||||||||||||||||||||||||||||||||||||||||||||||||||||||||||
The two-stage random sample includes a total of 11 160 enterprises and 200 000 employees. The unit-response rate was 98.3%. |
||||||||||||||||||||||||||||||||||||||||||||||||||||||||||||||||||||||||||||||||||||||||||||||||||||||||||||||||||||||||||||||||||||||||||||||||||||||||||||||||||||||||||||||||||||||||||||||||||
| 6.1. Accuracy - overall | ||||||||||||||||||||||||||||||||||||||||||||||||||||||||||||||||||||||||||||||||||||||||||||||||||||||||||||||||||||||||||||||||||||||||||||||||||||||||||||||||||||||||||||||||||||||||||||||||||
[Not requested] |
||||||||||||||||||||||||||||||||||||||||||||||||||||||||||||||||||||||||||||||||||||||||||||||||||||||||||||||||||||||||||||||||||||||||||||||||||||||||||||||||||||||||||||||||||||||||||||||||||
| 6.2. Sampling error | ||||||||||||||||||||||||||||||||||||||||||||||||||||||||||||||||||||||||||||||||||||||||||||||||||||||||||||||||||||||||||||||||||||||||||||||||||||||||||||||||||||||||||||||||||||||||||||||||||
In Austria, the Structure of Earnings Survey is conducted on the basis of a two-stage random sampling approach of enterprises (first stage) and employees (second stage). The business register kept by Statistics Austria forms the basis for the sampling of enterprises, while the selection of employees is based on social security data. The population used for sampling comprises around 39 700 enterprises with at least 10 employees in NACE Rev. 2 Sections B-N and P-S and the approximately 2 332 000 employees of these enterprises. Some 11 160 enterprises and 200 000 employees were selected for sampling. As a first step, a stratified random sample of enterprises was drawn from the business register. The variables economic activity (NACE Rev 2), location at level NUTS 1 and size of the enterprise were used as stratification criteria.
Sampling frame: Number of enterprises in the sample by economic activity and size of the enterprise in %
In a second step, a simple random sample of employees was drawn within the selected enterprises. For this purpose, the enterprise data and the social security data of employees were linked by means of a personal ID (bPK). Then, depending on the size of the enterprise, the corresponding number of employees per enterprise was selected. In order not to over-burden enterprises, the maximum number of selected employees per enterprise was limited to 80.
Selection of employees within the enterprises
Drawing the sample at the level of the local unit was not possible, because, based on the data sources available at the moment of sampling (social security data), employees could be unambiguously allocated only at enterprise level. Although the local unit has been recorded in the context of wage tax data since 2007, these data were not yet available at the moment of sampling. Statistics Austria was therefore able to conduct a random selection of employees only at enterprise level but not at local unit level. Enterprises with several local units were, pursuant to the national implementing regulation[1]), nevertheless required to allocate the employees selected to the local unit. This affected around 20% of the enterprises. However, the other 80% of enterprises did not have to provide information about local units.
[1] Regulation of the Federal Minister for Economic Affairs and Labour on the Structure of Earnings Survey in industry and parts of the service sector (Verdienststrukturstatistik-Verordnung), Federal Law Gazette (BGBl.) II No 66/2007, as amended by BGBl. II No 99/2011 |
||||||||||||||||||||||||||||||||||||||||||||||||||||||||||||||||||||||||||||||||||||||||||||||||||||||||||||||||||||||||||||||||||||||||||||||||||||||||||||||||||||||||||||||||||||||||||||||||||
| 6.2.1. Sampling error - indicators | ||||||||||||||||||||||||||||||||||||||||||||||||||||||||||||||||||||||||||||||||||||||||||||||||||||||||||||||||||||||||||||||||||||||||||||||||||||||||||||||||||||||||||||||||||||||||||||||||||
Coefficients of variation in %
|
||||||||||||||||||||||||||||||||||||||||||||||||||||||||||||||||||||||||||||||||||||||||||||||||||||||||||||||||||||||||||||||||||||||||||||||||||||||||||||||||||||||||||||||||||||||||||||||||||
| 6.3. Non-sampling error | ||||||||||||||||||||||||||||||||||||||||||||||||||||||||||||||||||||||||||||||||||||||||||||||||||||||||||||||||||||||||||||||||||||||||||||||||||||||||||||||||||||||||||||||||||||||||||||||||||
Over-coverage was found with regard to just 0.8% of the enterprises in the sample. Statistical units in Section O (public administration and defence; compulsory social security) were not part of the population, which meant that local units whose higher-level unit was allocated to Section O in the business register were not recorded. According to the business register, this led to under-coverage of 9.1% of employees. To correct for unit non-response the net sample was adjusted to the population given by the selection framework. Missing information in the response to the survey was completed by calling the enterprise back or imputed from administrative data. Due to the use of administrative data required by law, the survey could be restricted to those characteristics which could not be obtained from sources of administrative data. |
||||||||||||||||||||||||||||||||||||||||||||||||||||||||||||||||||||||||||||||||||||||||||||||||||||||||||||||||||||||||||||||||||||||||||||||||||||||||||||||||||||||||||||||||||||||||||||||||||
| 6.3.1. Coverage error | ||||||||||||||||||||||||||||||||||||||||||||||||||||||||||||||||||||||||||||||||||||||||||||||||||||||||||||||||||||||||||||||||||||||||||||||||||||||||||||||||||||||||||||||||||||||||||||||||||
The fact that the samples are drawn on the basis of the business register and social security data (see point 6.2. Sampling error) means that any coverage errors are directly connected to the quality and current relevance of the administrative data. In order to achieve a high level of completeness and relevance, Statistics Austria conducts ongoing technical comparisons between the business register and external sources of administrative data (register of companies, tax and social security data etc.). Moreover, information from economic surveys makes a substantial contribution to keeping the business register up to date. Only those categories of employees corresponding to the definitions in the Structure of Earnings Survey are taken over from the social security data. |
||||||||||||||||||||||||||||||||||||||||||||||||||||||||||||||||||||||||||||||||||||||||||||||||||||||||||||||||||||||||||||||||||||||||||||||||||||||||||||||||||||||||||||||||||||||||||||||||||
| 6.3.1.1. Over-coverage - rate | ||||||||||||||||||||||||||||||||||||||||||||||||||||||||||||||||||||||||||||||||||||||||||||||||||||||||||||||||||||||||||||||||||||||||||||||||||||||||||||||||||||||||||||||||||||||||||||||||||
Over-coverage Over-coverage was found with regard to just 0.8% of the enterprises in the sample. These enterprises were no longer active at the time of the survey and thus did not respond (see also point 6.3.3 Non-response errors).
Over-coverage by NACE
There was a slight over-coverage of 1.2% of employees in the sample within still-active enterprises. Around half of this recording error related to employees who were not/no longer employed by the enterprise. The other half related to employees who, in the reference month, received no income from dependent employment from the enterprise. One reason for the over-coverage was the lack of correspondence between the business register and social security data because of ever more complicated company structures which, in some cases, make it more difficult to precisely attribute employees to enterprises. Another reason was that, in the social security data, persons were recorded as being employees even though they were already on unpaid leave, undertaking compulsory military or civilian service, taking part in a labour market promotion measure, were counted as employed under social security law but as self-employed under labour law, or had already left the enterprise.
Under-coverage Statistical units in Section O (public administration and defence; compulsory social security) were not part of the population, which meant that local units whose higher-level unit was allocated to Section O in the business register were not recorded. According to the business register, this led to under-coverage of 9.1% of employees. According to the employee estimation model in the business register[1]) the under-coverage relates mainly to the service sector, in particular education (Section P -53%) and parts of public health and social services (Section Q -27%). In the education sector, it is mainly public employees in schools and childcare facilities who are not covered[2]) and, in health and social work, some employees in public homes and hospitals. Smaller economic sectors were also affected. In the area of "arts, entertainments and recreation" (Section R -23%), employees of public libraries, archives, museums and swimming baths are missing. In industry, municipal employees in Section P "water supply and waste disposal" (-41%) were not recorded. This can lead to either an over-estimation or under-estimation of earnings in these sectors. [1] Employees are allocated to a local unit on the basis of an allocation key. This allocation key is based on an estimation model according to which the employees of the enterprise are allocated to the local units. [2] Section P "Education" in ÖNACE 2008 includes private and faith-based childcare establishments and schools, all universities and colleges, driving schools and the adult education sector. |
||||||||||||||||||||||||||||||||||||||||||||||||||||||||||||||||||||||||||||||||||||||||||||||||||||||||||||||||||||||||||||||||||||||||||||||||||||||||||||||||||||||||||||||||||||||||||||||||||
| 6.3.1.2. Common units - proportion | ||||||||||||||||||||||||||||||||||||||||||||||||||||||||||||||||||||||||||||||||||||||||||||||||||||||||||||||||||||||||||||||||||||||||||||||||||||||||||||||||||||||||||||||||||||||||||||||||||
[Not requested] |
||||||||||||||||||||||||||||||||||||||||||||||||||||||||||||||||||||||||||||||||||||||||||||||||||||||||||||||||||||||||||||||||||||||||||||||||||||||||||||||||||||||||||||||||||||||||||||||||||
| 6.3.2. Measurement error | ||||||||||||||||||||||||||||||||||||||||||||||||||||||||||||||||||||||||||||||||||||||||||||||||||||||||||||||||||||||||||||||||||||||||||||||||||||||||||||||||||||||||||||||||||||||||||||||||||
To prevent measuring errors, the already tried and tested questionnaire (slightly adapted) was used for the primary survey. With the paper-and-pencil questionnaire, the enterprises were provided with detailed information. Enterprises could also complete a web-based questionnaire. This web-based questionnaire incorporated explanatory texts and plausibility tests on the individual survey parameters. Moreover, integrated classifications allowed the automatic recognition of NACE codes and occupations according to ISCO-08. A hotline was also available to provide information to enterprises. The submitted data were subjected to several layers of plausibility testing at both micro and macro levels for the ex-post identification of any measuring errors. The first step was for the survey data to be examined and corrected at micro level. In a second step the survey data were linked to the secondary data and subjected to a further plausibility test. After weighting the data, the aggregates were submitted to a third plausibility test (macro plausibility). The secondary data were, overall, of very high quality. The business register is being continually improved in order to make it more comprehensive and up-to-date (see point 6.3.1). The social security data come from monthly notifications to the social security institutions, meaning that employment relationships can be recorded precisely to the day. Tests are carried out upstream in the Statistics Austria database system to ensure the good quality of these data. For wage tax, data from the Austrian wage tax statistics which had already been verified by the tax statistics department of Statistics Austria were used. In this way, optimum data quality could be ensured in the calculation of gross annual earnings and annual bonuses and allowances. In order to determine the number of weeks to which the gross annual earnings related, information was available from the social security data (date of joining or leaving the enterprise) and from the wage tax data (reference period). In 87.9% of cases, the two sources concurred. In the case of discrepancies, the 'real' number of weeks was determined by comparing the monthly earnings from primary data and the monthly earnings calculated from secondary data. The figure with the smallest difference was considered 'real'. In 0.6% of cases, the selection was not plausible, which meant that the number of weeks was calculated on the basis of gross monthly earnings and annual earnings.
Data source for the number of weeks in the reference year (B31)
The data from the education register are based on data from the 2001 census, which are constantly updated and supplemented according to the information sent by schools, universities and other educational establishments. However, the education register does not differentiate between ISCED 0/1 and ISCED 2 qualifications. The data on ISCED 0 and 1 come from information provided by the Public Employment Service Austria (AMS), which means that there may be under-coverage of qualifications for those persons who had not had any contact with the AMS for a long period. On the other hand, there is the risk of slight over-coverage in the area of ISCED 2. Moreover, at that time data did not allow a distinction to be made between ISCED 5a and 6 qualifications, as information on ISCED 6 has existed only since 2001, and earlier census data did not differentiate. [1] The characteristics relating to the local unit (A11 and A13) were recorded only for those 20% or so of enterprises in the sample that had workplaces in various NUTS 2 regions and/or at 2-digit level of NACE Rev. 2. |
||||||||||||||||||||||||||||||||||||||||||||||||||||||||||||||||||||||||||||||||||||||||||||||||||||||||||||||||||||||||||||||||||||||||||||||||||||||||||||||||||||||||||||||||||||||||||||||||||
| 6.3.3. Non response error | ||||||||||||||||||||||||||||||||||||||||||||||||||||||||||||||||||||||||||||||||||||||||||||||||||||||||||||||||||||||||||||||||||||||||||||||||||||||||||||||||||||||||||||||||||||||||||||||||||
Because of the legal obligation to provide information [1] the non response rate is very low (1.7% unit non-response). [1] Regulation of the Federal Minister for Economic Affairs and Labour on the Structure of Earnings Survey in industry and parts of the service sector (Verdienststrukturstatistik-Verordnung), Federal Law Gazette (BGBl.) II No 66/2007, as amended by BGBl. II No 99/2011 |
||||||||||||||||||||||||||||||||||||||||||||||||||||||||||||||||||||||||||||||||||||||||||||||||||||||||||||||||||||||||||||||||||||||||||||||||||||||||||||||||||||||||||||||||||||||||||||||||||
| 6.3.3.1. Unit non-response - rate | ||||||||||||||||||||||||||||||||||||||||||||||||||||||||||||||||||||||||||||||||||||||||||||||||||||||||||||||||||||||||||||||||||||||||||||||||||||||||||||||||||||||||||||||||||||||||||||||||||
In Austria, responding to the SES is a legal requirement. Moreover, a whole range of measures were taken to limit non-responses: firstly, reminder letters to enterprises that did not reply by the response deadline; then dunning letters sent to those enterprises that had not replied to the reminder letter; thirdly, reminder telephone calls and, fourthly, reports to the authorities for suspected failure to comply with information obligations (see point 7.2). Thanks to these measures, the overall unit response rate was 98.3%. The unit non-response rate of 1.7% (187 enterprises) can be further broken down into two almost equal halves: 0.8% the result of over-coverage (see also point 6.3.1. 'Coverage errors') and 0.9% refusals.
Unit-Response rate
|
||||||||||||||||||||||||||||||||||||||||||||||||||||||||||||||||||||||||||||||||||||||||||||||||||||||||||||||||||||||||||||||||||||||||||||||||||||||||||||||||||||||||||||||||||||||||||||||||||
| 6.3.3.2. Item non-response - rate | ||||||||||||||||||||||||||||||||||||||||||||||||||||||||||||||||||||||||||||||||||||||||||||||||||||||||||||||||||||||||||||||||||||||||||||||||||||||||||||||||||||||||||||||||||||||||||||||||||
See point 6.3.4.1. Imputation |
||||||||||||||||||||||||||||||||||||||||||||||||||||||||||||||||||||||||||||||||||||||||||||||||||||||||||||||||||||||||||||||||||||||||||||||||||||||||||||||||||||||||||||||||||||||||||||||||||
| 6.3.4. Processing error | ||||||||||||||||||||||||||||||||||||||||||||||||||||||||||||||||||||||||||||||||||||||||||||||||||||||||||||||||||||||||||||||||||||||||||||||||||||||||||||||||||||||||||||||||||||||||||||||||||
Implausible survey data or missing values were completed either by calling the enterprise back (e.g. occupation, earnings, working time) or, if possible, imputed from sources of administrative data (e.g. length of service in the enterprise, type of employment contract and number of annual days of holiday leave). See point 6.3.4.1. Imputation. |
||||||||||||||||||||||||||||||||||||||||||||||||||||||||||||||||||||||||||||||||||||||||||||||||||||||||||||||||||||||||||||||||||||||||||||||||||||||||||||||||||||||||||||||||||||||||||||||||||
| 6.3.4.1. Imputation - rate | ||||||||||||||||||||||||||||||||||||||||||||||||||||||||||||||||||||||||||||||||||||||||||||||||||||||||||||||||||||||||||||||||||||||||||||||||||||||||||||||||||||||||||||||||||||||||||||||||||
Missing information about the length of service in the enterprise (B26) was calculated on the basis of information from social security data on the date of joining or leaving the enterprise. Information on the type of employment contract (B28) was also completed with the aid of social security data. For annual days of holiday leave (B33), the statutory holiday entitlement was imputed, taking into account age and length of service.
Item imputation rate (survey data)
Conversely, any gaps in the sources of administrative data were completed with the aid of corresponding statistical procedures on the basis of the survey data. Gross annual earnings (B41) and Annual bonuses and allowances (B411) were then imputed using regression analysis. The basis of the calculation was the information on gross monthly earnings from the survey. The imputation could be undertaken by means of linear regression because of the high degree of correlation (Pearsons r=0.962, p<0.001) between gross monthly earnings and gross annual earnings (extrapolated with information on the date of joining or leaving the enterprise). Annual bonuses also showed a high linear correlation (r=0.891) with gross annual earnings, therefore the imputation of missing values is also based on linear regression.
Item imputation rate (administrative data)
Missing information on the highest completed level of education (B25), on the other hand, was imputed on the basis of a discriminant analysis, using the predictors sex, gross hourly earnings, age and occupation. Six sig-nificant discriminant functions (p<0.001) led to a Wilks' lambda of 0.578. Information on education was missing for 0.8% of employees with Austrian citizenship (A) and 38.1% of employees with other citizenship (B). This is because the education register receives ongoing notifications only from educational institutions in Austria. The ongoing qualification of employees from other countries can be taken into account only if the training was completed in Austria, the qualification is officially recognised, the Public Employment Service Austria (AMS) provides the information or if an academic degree is entered in the Central Register of Residents (ZMR). The value of variable B25 is therefore significantly restricted for non-Austrians (B). This means that the earnings of employees who are not Austrian, broken down by level of education, could be either over- or under-recorded.
Item imputation rate variable B25 by citizenship
Total imputation rate If 19 variables (all obligatory variables: B21 to B43, + B29) are assumed, a total imputation rate of 0.7% is arrived at. |
||||||||||||||||||||||||||||||||||||||||||||||||||||||||||||||||||||||||||||||||||||||||||||||||||||||||||||||||||||||||||||||||||||||||||||||||||||||||||||||||||||||||||||||||||||||||||||||||||
| 6.3.5. Model assumption error | ||||||||||||||||||||||||||||||||||||||||||||||||||||||||||||||||||||||||||||||||||||||||||||||||||||||||||||||||||||||||||||||||||||||||||||||||||||||||||||||||||||||||||||||||||||||||||||||||||
To correct for unit non-response the net sample was adjusted to the population given by the selection framework. The weighting of the data, like the sampling, took place in several steps. The first step was to reproduce the sample design, by giving each enterprise the base weight of the sampled unit Wk, representing the reciprocal selection probability in the stratum h (Wk=Nh/nh). Using the total number of employees per enterprise as a basis, a sample weight was also calculated for each employee in the sample. Using the base weight Wk of the enterprise k, the number of employees Bk of this enterprise and the number of employees bk of the enterprise k in the sample, the base weight Wbhk was calculated for each employee in the sample unit. Wbhk= Wk*Bk/bk Based on the allocation of employees to local units by the enterprises a breakdown by economic activity and region at the level of the local unit could be conducted within the meaning of the European legal basis. For the weighting of the local units summarised as aggregates, it was necessary, in a next step, to calibrate the weights such that the sum of the weights of each NUTS 2 region cross-referenced with NACE sections matched the corresponding population. The second step of the weighting was then to modify the basic weighting Wbhk, which initially was allocated to each aggregate, so that the sum of the weights of these units corresponded both with the corresponding figures from the population in the cross-referencing of the NACE sections and NUTS-2 region and the sum of all male and female employees in the population.[1])
[1] Weighting by gender has been carried out since 2006, as the Structure of Earnings Survey has been used throughout the EU as the source for calculating the gender pay gap. |
||||||||||||||||||||||||||||||||||||||||||||||||||||||||||||||||||||||||||||||||||||||||||||||||||||||||||||||||||||||||||||||||||||||||||||||||||||||||||||||||||||||||||||||||||||||||||||||||||
| 6.4. Seasonal adjustment | ||||||||||||||||||||||||||||||||||||||||||||||||||||||||||||||||||||||||||||||||||||||||||||||||||||||||||||||||||||||||||||||||||||||||||||||||||||||||||||||||||||||||||||||||||||||||||||||||||
[Not requested] |
||||||||||||||||||||||||||||||||||||||||||||||||||||||||||||||||||||||||||||||||||||||||||||||||||||||||||||||||||||||||||||||||||||||||||||||||||||||||||||||||||||||||||||||||||||||||||||||||||
| 6.5. Data revision - policy | ||||||||||||||||||||||||||||||||||||||||||||||||||||||||||||||||||||||||||||||||||||||||||||||||||||||||||||||||||||||||||||||||||||||||||||||||||||||||||||||||||||||||||||||||||||||||||||||||||
[Not requested] |
||||||||||||||||||||||||||||||||||||||||||||||||||||||||||||||||||||||||||||||||||||||||||||||||||||||||||||||||||||||||||||||||||||||||||||||||||||||||||||||||||||||||||||||||||||||||||||||||||
| 6.6. Data revision - practice | ||||||||||||||||||||||||||||||||||||||||||||||||||||||||||||||||||||||||||||||||||||||||||||||||||||||||||||||||||||||||||||||||||||||||||||||||||||||||||||||||||||||||||||||||||||||||||||||||||
[Not requested] |
||||||||||||||||||||||||||||||||||||||||||||||||||||||||||||||||||||||||||||||||||||||||||||||||||||||||||||||||||||||||||||||||||||||||||||||||||||||||||||||||||||||||||||||||||||||||||||||||||
| 6.6.1. Data revision - average size | ||||||||||||||||||||||||||||||||||||||||||||||||||||||||||||||||||||||||||||||||||||||||||||||||||||||||||||||||||||||||||||||||||||||||||||||||||||||||||||||||||||||||||||||||||||||||||||||||||
[Not requested] |
||||||||||||||||||||||||||||||||||||||||||||||||||||||||||||||||||||||||||||||||||||||||||||||||||||||||||||||||||||||||||||||||||||||||||||||||||||||||||||||||||||||||||||||||||||||||||||||||||
|
||||||||||||||||||||||||||||||||
| 7.1. Timeliness | ||||||||||||||||||||||||||||||||
In order to keep the period of time between the reference period and the publication of data at national level as short as possible, first results were published in a press release and on the homepage of Statistics Austria on 12 July 2012. Therefore the period between the end of the reference year and the publication of first results was 18 months + 2 weeks. |
||||||||||||||||||||||||||||||||
| 7.1.1. Time lag - first result | ||||||||||||||||||||||||||||||||
[Not requested] |
||||||||||||||||||||||||||||||||
| 7.1.2. Time lag - final result | ||||||||||||||||||||||||||||||||
[Not requested] |
||||||||||||||||||||||||||||||||
| 7.2. Punctuality | ||||||||||||||||||||||||||||||||
The final data were delivered to Eurostat on 28 June 2012. Overview of the data collection process
|
||||||||||||||||||||||||||||||||
| 7.2.1. Punctuality - delivery and publication | ||||||||||||||||||||||||||||||||
[Not requested] |
||||||||||||||||||||||||||||||||
|
||||||||||||||||||||||||||||||||||||||||||||||||||||||||||||||||||||||||||||||||||||||||||||||||||||||||||||||||||||||||||||||||||||||||||
| 8.1. Comparability - geographical | ||||||||||||||||||||||||||||||||||||||||||||||||||||||||||||||||||||||||||||||||||||||||||||||||||||||||||||||||||||||||||||||||||||||||||
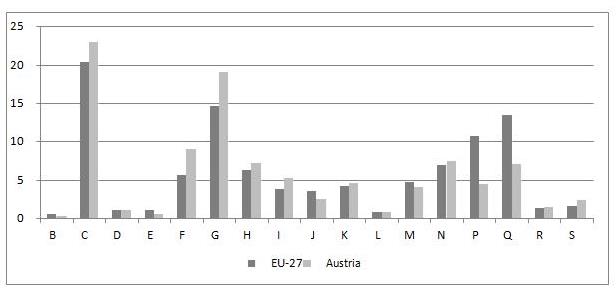
The comparability of the results between Member States is restricted because of under-coverage in NACE Rev. 2 Sections P, Q, E and R (see point 6.3.1. Coverage error). Statistical units in Section O were not part of the population, which meant that local units whose superordinate enterprise was allocated to Section O in the business register were not recorded. The proportion of employees in those economic sectors (except R) was therefore much lower in Austria than the EU average. The exclusion of Section O from the survey population also affects the results for certain professional groups such as teaching professionals (ISCO 23), health professionals (ISCO 22), health associate professionals (ISCO 32) and personal care workers (ISCO 53).
Proportion of employees by economic activity in %
Q: Eurostat. Not including Greece. Enquiry of 27 November 2012 |
||||||||||||||||||||||||||||||||||||||||||||||||||||||||||||||||||||||||||||||||||||||||||||||||||||||||||||||||||||||||||||||||||||||||||
| 8.1.1. Asymmetry for mirror flow statistics - coefficient | ||||||||||||||||||||||||||||||||||||||||||||||||||||||||||||||||||||||||||||||||||||||||||||||||||||||||||||||||||||||||||||||||||||||||||
[Not requested] |
||||||||||||||||||||||||||||||||||||||||||||||||||||||||||||||||||||||||||||||||||||||||||||||||||||||||||||||||||||||||||||||||||||||||||
| 8.2. Comparability - over time | ||||||||||||||||||||||||||||||||||||||||||||||||||||||||||||||||||||||||||||||||||||||||||||||||||||||||||||||||||||||||||||||||||||||||||
The changes to the definitions between the 2002, 2006 and 2010 surveys are mainly the result of amendments to legal acts and classifications (NACE, ISCO). Pursuant to Article 3 of Regulation (EC) No 530/1999, the inclusion of Sections M – O of NACE Rev. 1 was optional for the SES 2002. Furthermore, a derogation from Article 6 has been in force for Austria in 2002, whereby the parameters could relate to the enterprise rather than to the local unit. The following differences in particular should also be taken into account with regard to the comparability of the surveys over time. Coverage:
Statistical units:
Weighting:
Comparison of gross hourly earnings 2006 / 2010
|
||||||||||||||||||||||||||||||||||||||||||||||||||||||||||||||||||||||||||||||||||||||||||||||||||||||||||||||||||||||||||||||||||||||||||
| 8.2.1. Length of comparable time series | ||||||||||||||||||||||||||||||||||||||||||||||||||||||||||||||||||||||||||||||||||||||||||||||||||||||||||||||||||||||||||||||||||||||||||
[Not requested] |
||||||||||||||||||||||||||||||||||||||||||||||||||||||||||||||||||||||||||||||||||||||||||||||||||||||||||||||||||||||||||||||||||||||||||
| 8.3. Coherence - cross domain | ||||||||||||||||||||||||||||||||||||||||||||||||||||||||||||||||||||||||||||||||||||||||||||||||||||||||||||||||||||||||||||||||||||||||||
The characteristics 'Wages and salaries' per employee (employment relationship) in the National Accounts and 'Gross annual earnings' in the reporting month are comparable only with certain caveats. Such comparisons lead to a discrepancy of -5%. The main reasons for this discrepancy are:
Comparison of wages and salaries per employee in National Accounts and gross annual earnings in the SES
|
||||||||||||||||||||||||||||||||||||||||||||||||||||||||||||||||||||||||||||||||||||||||||||||||||||||||||||||||||||||||||||||||||||||||||
| 8.4. Coherence - sub annual and annual statistics | ||||||||||||||||||||||||||||||||||||||||||||||||||||||||||||||||||||||||||||||||||||||||||||||||||||||||||||||||||||||||||||||||||||||||||
[Not requested] |
||||||||||||||||||||||||||||||||||||||||||||||||||||||||||||||||||||||||||||||||||||||||||||||||||||||||||||||||||||||||||||||||||||||||||
| 8.5. Coherence - National Accounts | ||||||||||||||||||||||||||||||||||||||||||||||||||||||||||||||||||||||||||||||||||||||||||||||||||||||||||||||||||||||||||||||||||||||||||
[Not requested] |
||||||||||||||||||||||||||||||||||||||||||||||||||||||||||||||||||||||||||||||||||||||||||||||||||||||||||||||||||||||||||||||||||||||||||
| 8.6. Coherence - internal | ||||||||||||||||||||||||||||||||||||||||||||||||||||||||||||||||||||||||||||||||||||||||||||||||||||||||||||||||||||||||||||||||||||||||||
[Not requested] |
||||||||||||||||||||||||||||||||||||||||||||||||||||||||||||||||||||||||||||||||||||||||||||||||||||||||||||||||||||||||||||||||||||||||||
|
|||
| 9.1. Dissemination format - News release | |||
The most important results were communicated, in the form of a press release (English version). |
|||
| 9.2. Dissemination format - Publications | |||
Internet An overview of the key findings (text and tables in HTML, PDF and Excel formats) can be found on the website of Statistics Austria (English version). Statistische Nachrichten
Printed publications Detailed results and tables are presented in the publication entitled 'Verdienststrukturerhebung 2010 – Struktur und Verteilung der Verdienste in Österreich' (Print version, including CD ROM with tables in Excel format; free PDF file available from our website). Statistical Yearbook Selected results are published in the Statistical Yearbook in the chapters 'Income; earnings" and 'Employment and the labour market' (print version, including CD ROM with tables in Excel format). |
|||
| 9.3. Dissemination format - online database | |||
STATCUBE database The data can also be found on the Statistics Austria website under Publications & Services, STATcube – Statistical Database |
|||
| 9.3.1. Data tables - consultations | |||
[Not requested] |
|||
| 9.4. Dissemination format - microdata access | |||
[Not requested] |
|||
| 9.5. Dissemination format - other | |||
- |
|||
| 9.6. Documentation on methodology | |||
Metadata Meta data (definitions, explanations, methods, quality) can be found on the website of Statistics Austria (German version). |
|||
| 9.7. Quality management - documentation | |||
[Not requested] |
|||
| 9.7.1. Metadata completeness - rate | |||
[Not requested] |
|||
| 9.7.2. Metadata - consultations | |||
[Not requested] |
|||
|
|||
[Not requested] |
|||
|
|||
| 11.1. Confidentiality - policy | |||
[Not requested] |
|||
| 11.2. Confidentiality - data treatment | |||
[Not requested] |
|||
|
|||
Annex: Plausibility of variables Annexes: Plausibility of variables |
|||
|
|||
|
|||